
- Bitcoin trades at $75,882 (−1.34% 24h, $1.524T market cap) as first U.S. rate hike in 3 years approaches
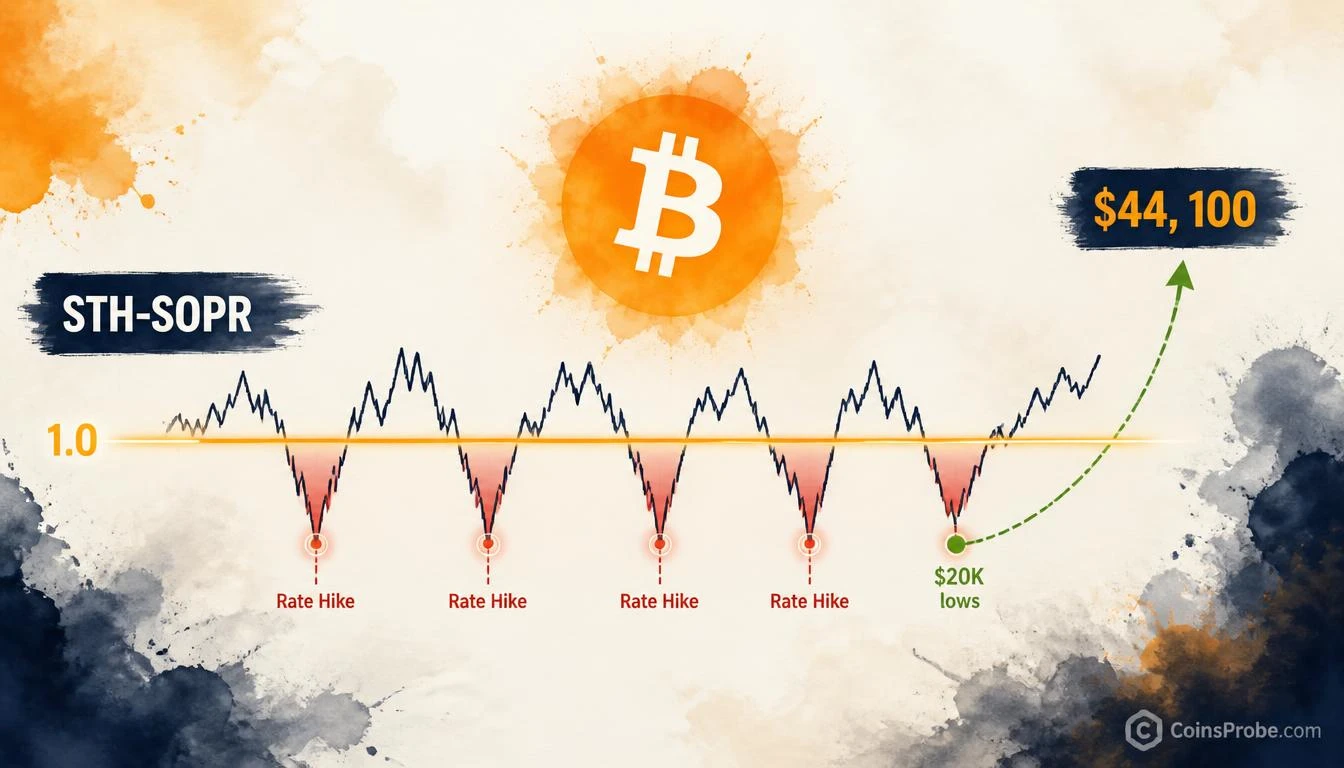
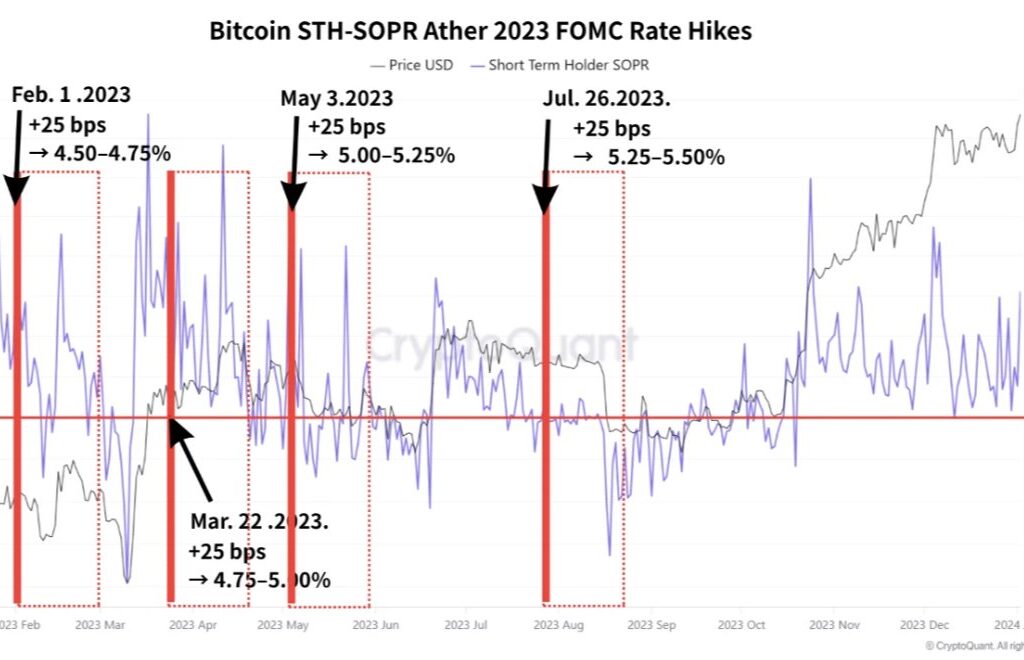
- In 2023, all four +25 bps FOMC hikes triggered STH-SOPR dips below 1.0 — each followed by recovery above 1.0 per CryptoQuant (@xwinfinance)
- Bitcoin rose from $20K–$22.5K hike lows to $44,100 by Jan 2024 — a 96%–120% gain after every capitulation window
- Watch STH-SOPR 1.0 line: sustained close below signals distribution; recovery above confirms buyer absorption
Bitcoin is trading at approximately $75,882 — down 1.34% in the last 24 hours — with a market cap of $1.524 trillion, as the first U.S. interest rate hike in three years approaches. The question on every macro trader’s desk is not whether the hike will pressure Bitcoin, but whether buyers will absorb the selling pressure it creates — because in 2023, that distinction was the entire difference between a temporary capitulation and a trend-ending collapse.
That framework comes directly from CryptoQuant analyst @xwinfinance, writing via @cryptoquant_com: “The key is whether loss-taking persists and buyers absorb selling pressure — not simply the rate-hike headline.” The chart backing that conclusion is a daily Bitcoin STH-SOPR overlay spanning February 2023 through January 2024 — covering every FOMC rate hike in that cycle. The data is unambiguous: rate hikes did not break Bitcoin. Sustained loss-taking without recovery would have.
What STH-SOPR Actually Measures — Before Citing the Reading
The Short-Term Holder Spent Output Profit Ratio (STH-SOPR) measures whether Bitcoin moved by short-term holders (coins held under 155 days) is changing hands at a profit or a loss. A reading above 1.0 means the average STH is selling into profit. A reading below 1.0 means the average STH is selling at a loss — a capitulation signal. The critical behavioral threshold is the 1.0 line: when SOPR dips below 1.0 and then recovers above it, the historical interpretation is that buyers stepped in at or below the sellers’ cost basis, absorbing the panic.
This is not a directional momentum indicator. STH-SOPR does not predict whether price goes up or down — it measures whether short-term market participants are being shaken out or held whole. That distinction matters enormously in rate-hike environments, where fear-driven selling can look structurally identical to genuine distribution until the SOPR recovery (or lack thereof) reveals which one it actually was.
The 2023 Roadmap: Four Rate Hikes, Four SOPR Dips, Four Recoveries
The chart published by @cryptoquant_com covers four FOMC rate decisions during the 2023 tightening cycle — each delivering a +25 basis point hike:
| FOMC Date | Rate Change | STH-SOPR Reaction | SOPR Outcome |
|---|---|---|---|
| February 1, 2023 | +25 bps | Dipped below 1.0 | Recovered above 1.0 |
| March 22, 2023 | +25 bps | Dipped below 1.0 | Recovered above 1.0 |
| May 3, 2023 | +25 bps | Dipped below 1.0 | Recovered above 1.0 |
| July 26, 2023 | +25 bps | Dipped below 1.0 | Recovered above 1.0 |
Source: CryptoQuant via @cryptoquant_com — STH-SOPR daily, Feb 2023–Jan 2024
The entry price for short-term holders during the rate-hike lows ranged between approximately $20,000 and $22,500. By the end of the charted period in January 2024, Bitcoin had reached $44,100 — a gain of roughly 96% to 120% from the lows where SOPR capitulation was most acute. Four hikes. Four sub-1.0 SOPR dips. Four recoveries. Zero structural breaks.
The red highlighted zones on the chart are not arbitrary — they mark the precise windows where panic-selling peaked around each announcement. In every instance, the SOPR line’s return above 1.0 confirmed that buyers were absorbing the forced selling, not running from it. As @xwinfinance’s framing makes explicit: the hike itself was not the variable. Sustained loss-taking was.
What the Chart Shows — And What It Doesn’t
What it says: In each of the four 2023 rate-hike windows, STH-SOPR dropped below 1.0, indicating short-term holders sold at a loss. In each case, SOPR recovered above 1.0 within the same trading window, confirming buyer absorption and trend continuation. Bitcoin’s price ultimately reached $44,100 by January 2024.
What it doesn’t say: The chart does not guarantee that the same pattern will repeat in the current cycle. STH-SOPR is a coincident-to-lagging on-chain metric — it confirms what has already happened in realized price terms. It does not predict the duration, depth, or magnitude of any SOPR dip that may occur around the incoming rate hike.
What to watch for continuation: A dip below 1.0 that fails to recover — meaning SOPR remains below 1.0 for multiple consecutive daily closes — would represent a structurally different outcome than 2023. That sustained sub-1.0 reading would indicate sellers are overwhelming buyers rather than triggering temporary capitulation. Per @xwinfinance’s framework: that is the bearish case, not the rate-hike announcement itself.
For broader context on how Bitcoin has historically responded to Fed decisions, CoinsprProbe’s analysis of Bitcoin’s record across 14 FOMC decisions shows the rate event itself has rarely been the primary driver of sustained directional moves.
Current Setup — Bitcoin at $75,882 Entering the Hike
Bitcoin enters this rate-hike window at $75,882, which is materially different from the $20,000–$22,500 range that characterized the 2023 hike cycle. The STH-SOPR dynamic will play out from a significantly elevated cost basis for recent buyers. That means two things: the absolute price depth of any SOPR dip could be larger in dollar terms while remaining similar in percentage terms, and the recovery threshold — the 1.0 line — represents a higher dollar cost basis that buyers must defend.
The 24-hour volume stands at $38.6 billion as of writing, suggesting active market participation heading into the announcement. Volume context matters here because SOPR recovery requires willing buyers — and $38.6B in daily volume indicates that market depth is present, even if direction remains contested.
On the contrarian Fed case, CoinsprProbe has previously covered @alicharts’ analysis of why a Fed hold scenario could be more bullish than consensus expects — which provides a useful counterpoint to the rate-hike-as-negative framing.
Bullish and Bearish Scenarios
Bullish Scenario — SOPR Dip Below 1.0 Followed by Recovery
If the rate hike announcement triggers an STH-SOPR drop below 1.0 — replicating the 2023 pattern — and SOPR recovers above 1.0 within 1–3 daily closes, the historical analog from @xwinfinance’s chart points to trend continuation. The 2023 precedent produced a move from the $20,000–$22,500 hike lows to $44,100 over approximately five months. Applied to current price structure, the bullish confirmation signal is not a specific dollar target but a specific on-chain condition: SOPR back above 1.0 with buyers demonstrably absorbing the selling.
Bearish Scenario — Sustained STH-SOPR Below 1.0
If STH-SOPR drops below 1.0 and fails to recover — sustaining below the break-even level across multiple daily closes — that signals a structurally different environment than 2023. In that scenario, short-term holders are selling at a loss and no cohort of buyers is absorbing the pressure at current prices. The immediate support zone to monitor is the range between $72,000 and $74,000, which represents a meaningful technical cluster. Loss of that range on sustained sub-1.0 SOPR would open a retest toward the $65,000–$68,000 region.
The One Variable That Matters More Than the Hike
@xwinfinance’s framing — validated by four consecutive data points in 2023 — reduces a complex macro event to a single measurable test: does loss-taking persist, or do buyers absorb it? That is not a qualitative assessment. It is a live, verifiable on-chain reading updated daily on CryptoQuant’s STH-SOPR feed. Traders who watched the rate-hike headline in 2023 and sold on announcement missed four consecutive buy signals. Traders who watched SOPR recover above 1.0 after each hike had a documented, repeatable framework for staying long.
The same framework applies now. The rate hike is the catalyst for potential SOPR dislocation. Whether that dislocation becomes a buying opportunity or the start of sustained distribution will be answered by a single number: whether STH-SOPR closes and holds above 1.0 in the sessions following the announcement.
Frequently Asked Questions
What is STH-SOPR and why does it matter for Bitcoin during rate hikes?
Did Bitcoin’s price fall during the 2023 FOMC rate hikes?
What level must STH-SOPR hold for the bullish 2023 analog to remain valid?
What is the bearish price scenario if STH-SOPR fails to recover?
Source: CryptoQuant · Published by CoinsProbe Markets Desk
The opinions and market insights shared on CoinsProbe represent the views of individual authors based on prevailing market conditions at the time of publication. Cryptocurrency investments carry significant risk and volatility. Readers are encouraged to conduct their own research and seek professional financial advice before making investment decisions. CoinsProbe and its contributors do not accept responsibility for financial losses or decisions made based on published content.
CoinsProbe may publish sponsored articles, affiliate links, or promotional collaborations. All sponsored material is clearly labeled to maintain transparency with our audience. Our editorial decisions remain fully independent, and advertising partnerships do not influence reviews, rankings, or published opinions.
Since 2023, CoinsProbe has delivered reliable insights on cryptocurrency, blockchain, and digital assets. Our content is created by experienced researchers and analysts who follow strict editorial standards focused on accuracy, transparency, and credibility. Every article is carefully reviewed and verified using trusted sources and current market data. We provide unbiased analysis and timely updates covering everything from emerging crypto projects to major industry developments.