
- Bitcoin trades at $75,943 (-1.28%) — near multi-month lows ahead of a critical FOMC decision
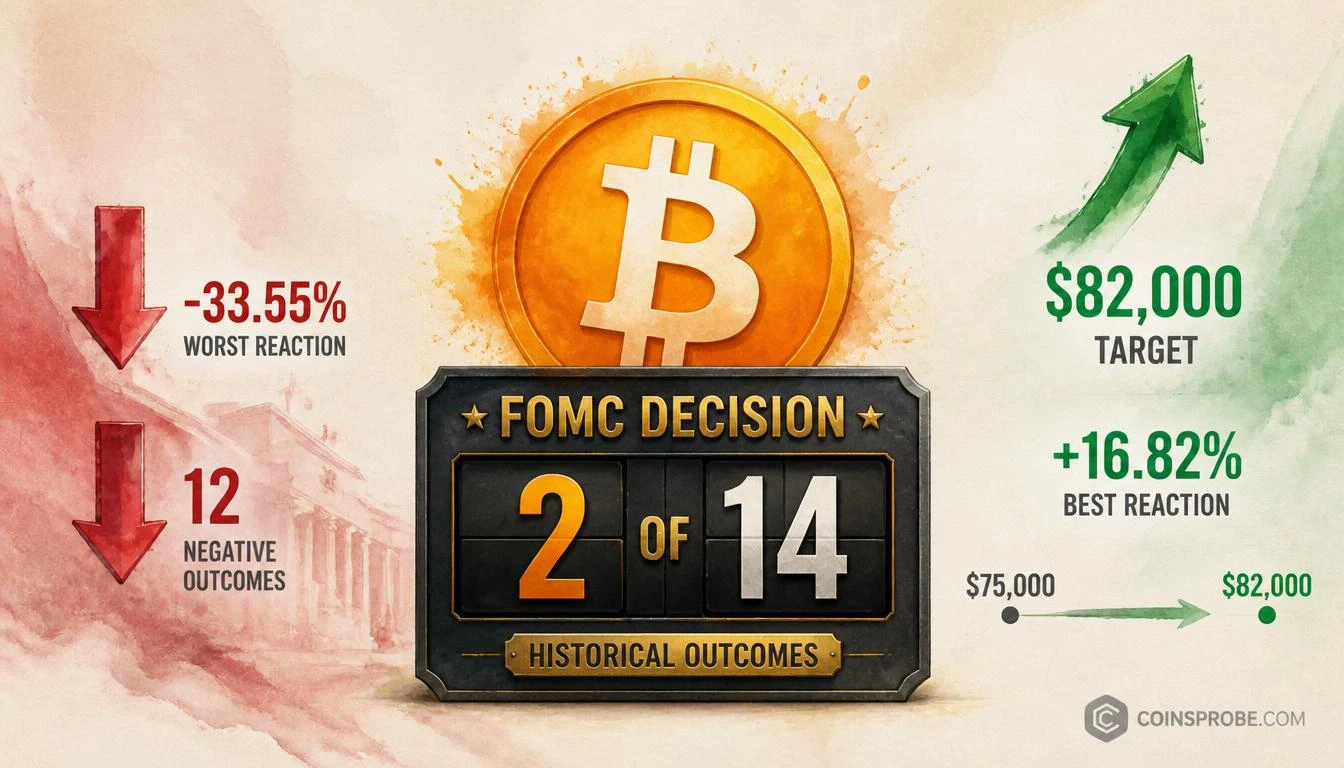
- BTC has risen after only 2 of 14 FOMC decisions since June 2024 — a 14% win rate per @alicharts chart
- A Warsh rate-hold surprise could push BTC from $75,000 support to $82,000 — an 8% move
- Both prior positive FOMC reactions produced double-digit gains: +10.52% and +16.82%
Bitcoin is trading at $75,943 — down 1.28% in the past 24 hours — with a market capitalization of approximately $1.53 trillion. Behind that number sits one of the most statistically unfavorable setups in macro trading: Bitcoin has risen after only 2 of the past 14 FOMC decisions. That is a 14% historical win rate. And yet, analyst Ali Martinez (@alicharts) is making a specific, mechanism-driven case for why this decision could be the exception.
The thesis is not that the FOMC record has changed. It is that the surprise factor has. Martinez frames it precisely: “If Warsh holds rates steady, the surprise could trigger a powerful rally across risk assets as investors rapidly reposition. Bitcoin, which has risen after only two of the past 14 FOMC decisions, could bounce from $75,000 and break above $82,000.” This is a contrarian asymmetric setup — low base-rate probability, high-impact outcome if realized. The catalyst is not the decision itself. It is the delta between expectation and outcome.
The FOMC Track Record — 14 Decisions, 2 Positive Outcomes
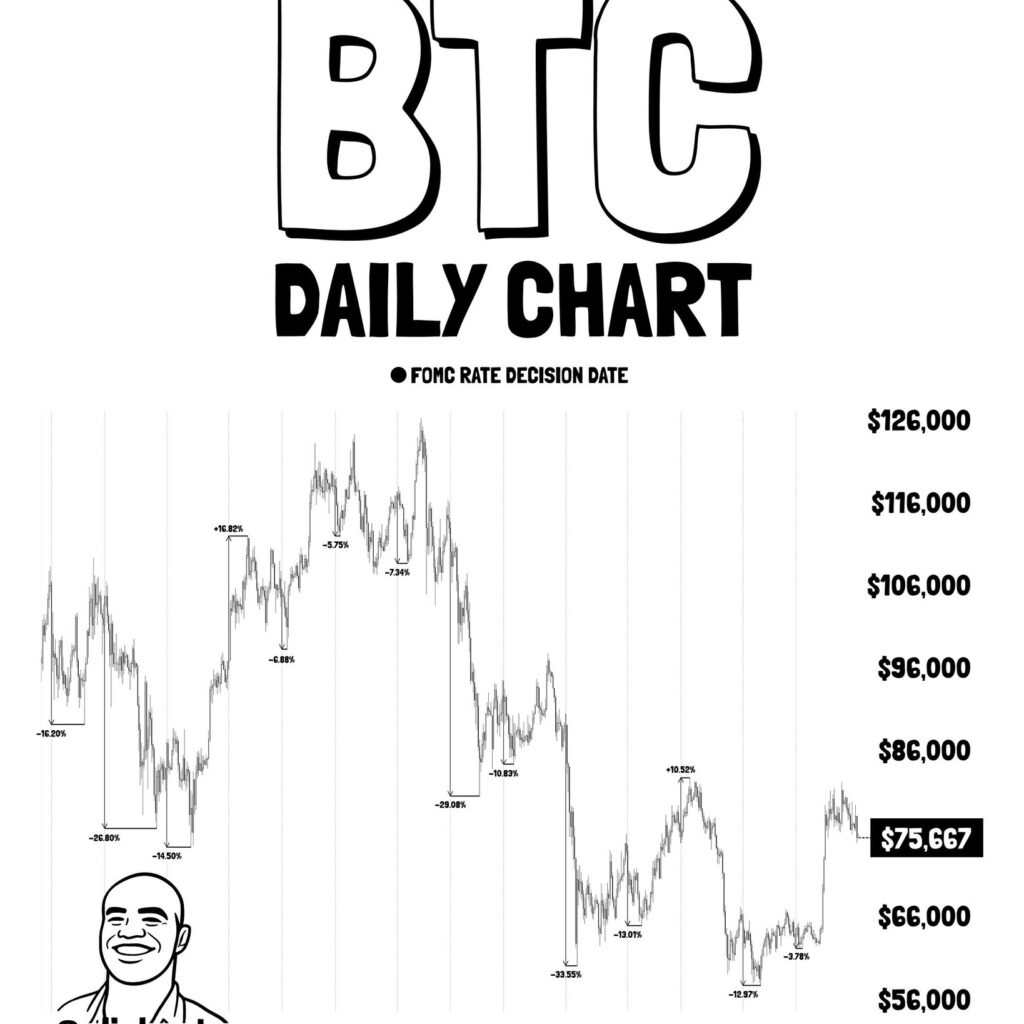
The chart shared by @alicharts documents every FOMC rate decision from June 2024 through mid-2025, marking each decision date directly on Bitcoin’s daily price chart. The data is stark.
| Outcome Type | Count | Range |
|---|---|---|
| Positive BTC reactions | 2 of 14 | +10.52%, +16.82% |
| Negative BTC reactions | 12 of 14 | -5% to -33.55% |
| Largest single drop | January 2025 | -33.55% |
Source: @alicharts (X) — BTC Daily FOMC Reaction Chart
The two positive outcomes — +16.82% and +10.52% — were not random. Each occurred in a context where the Fed’s action or language diverged from the dominant market expectation at the time. That is the precise mechanism Martinez is mapping onto the current setup.
The current price of $75,943 places Bitcoin near multi-month lows, having traded as high as approximately $108,000 in December 2024. The chart’s price range of $56,000–$126,000 over the covered period illustrates how violent FOMC-adjacent volatility has been in both directions. The majority of that volatility has been downward.
The Contrarian Setup — Why a Warsh Rate Hold Changes the Equation
The mechanism @alicharts identifies is not technical — it is behavioral. Markets price in an expected Fed outcome before the decision. When the actual outcome deviates, the re-pricing is rapid and mechanical: stop-losses trigger, short positions cover, and risk assets receive simultaneous inflows from investors who had been positioned for the opposite outcome.
The specific scenario: Fed Chair Warsh holds rates steady when markets have priced in movement. That gap between expectation and delivery is what Martinez calls the “surprise factor.” The larger the pre-positioned expectation for a rate action, the more violent the repricing if that action does not materialize.
This matters structurally for Bitcoin because of where it sits on the chart. At $75,943, Bitcoin is near the $75,000 support zone that @alicharts identifies as the bounce origin. A surprise hold, under this thesis, could compress the distance to $82,000 rapidly — a move of approximately 8% from current levels — as repositioning capital enters simultaneously across risk asset classes. For additional context on what a Fed no-hike surprise could mean for broader markets, see our prior analysis: Fed No-Hike Surprise Could Be the Catalyst Markets Need — @alicharts.
The Daily Chart — What @alicharts’ Data Reveals
The BTC daily chart shared by @alicharts covers approximately June 2024 through July 2025 and plots each FOMC decision with a black dot directly on the price action. The visualization makes the pattern impossible to ignore: the overwhelming majority of black dots are followed by price deterioration.
Key observations from the chart:
- BTC reached a notable high of approximately $108,000 in December 2024 — a period that also saw one of the two positive FOMC reactions (+16.82%)
- The January 2025 FOMC decision produced the worst single reaction in the dataset: -33.55%
- Current price at $75,667–$75,943 represents multi-month lows within the $56,000–$126,000 range documented
- The setup as charted shows BTC sitting at a level where the two prior positive FOMC reactions produced double-digit percentage gains
The statistical context is, by default, bearish. But Martinez’s point is precisely that low-probability events carry the highest surprise premium — and the surprise premium is what moves markets in the short term. It is also worth noting that Bitcoin’s current technical structure has been under pressure from broader macro forces, including what the CLARITY Act Senate rejection triggered in short-term holder behavior.
What the Data Actually Says — And What It Doesn’t
What it says: Bitcoin has a documented 14% win rate following FOMC decisions over the past 14 cycles. The two positive outcomes both produced double-digit percentage gains (+10.52% and +16.82%), meaning when BTC does respond positively to an FOMC event, the move is not modest.
What it doesn’t say: This setup predicts a positive outcome. A 14% win rate means an 86% historical base rate of negative or flat reactions. Martinez is not forecasting a rally — he is identifying the specific condition (a Warsh rate hold surprise) that would create the mechanism for one.
What to watch for confirmation: Immediate price reaction in the 30–60 minutes following the FOMC announcement. Historical positive reactions were sharp and immediate — not gradual. A failure to break above $78,000 within that window on a hold scenario would suggest the surprise premium is not materializing at the scale required.
The $82,000 Target — Mechanism and Math
The $82,000 level identified by @alicharts is not arbitrary. From the current price of approximately $75,943, that represents an 8% move. From the $75,000 bounce zone cited in the thesis, it is a 9.3% move.
Contextually, the two prior positive FOMC reactions produced gains of +10.52% and +16.82%. An 8–9% target from the $75,000 zone is conservative relative to the historical positive-reaction range. That conservatism is appropriate given that the base rate remains 14%.
The $82,000 level also represents a meaningful structural reclaim. Bitcoin spent significant time in the $82,000–$88,000 zone earlier in 2025 before the deterioration to current levels. A reclaim of $82,000 would shift the technical structure from a series of lower highs and lower lows into a more contested range. For traders tracking Bitcoin’s recent buy signal setups at current levels, the analysis on Bitcoin’s TD Sequential buy signal and its prior bounce track record provides additional technical context.
Bullish Scenario — Warsh Holds, $82,000 Reclaimed
A rate hold surprise triggers immediate short-covering and risk-asset repositioning. Bitcoin bounces from the $75,000 support zone and breaks above $82,000 — consistent with the +10.52% and +16.82% outcomes seen in the 2 of 14 prior positive FOMC reactions. Sustained close above $82,000 opens the $88,000 zone.
Bearish Scenario — Expected Decision, Continued Pressure
If the FOMC delivers the expected outcome — no surprise hold — the base rate reasserts. The 86% historical negative-reaction probability suggests further pressure on $75,000. A loss of that level with conviction opens a retest of the lower range documented in the chart, toward $70,000–$68,000. The January 2025 precedent of -33.55% represents the tail-risk scenario if the decision is read as hawkish by markets.
Bottom Line
Bitcoin trades at $75,943 — within the exact bounce zone @alicharts identifies — ahead of an FOMC decision that carries a documented 14% historical win rate for positive BTC reactions. The contrarian thesis from Martinez is mechanistically specific: a Warsh rate hold would create a surprise premium, forcing rapid repositioning across risk assets and pushing BTC from $75,000 toward $82,000. That is an 8–9% move supported by a low base rate but a high-impact precedent — the two prior positive reactions both exceeded 10%. The setup demands conservative sizing and post-decision confirmation, not pre-decision positioning. Watch $75,000 as the critical support floor — loss of that level invalidates the bounce thesis entirely. Watch $82,000 as the confirmation target — a break above that level signals the surprise premium is materializing at scale.
Frequently Asked Questions
How many times has Bitcoin risen after an FOMC decision?
What is the $82,000 Bitcoin target and where does it come from?
What was Bitcoin’s worst reaction to an FOMC decision?
Why would a Fed rate hold be a surprise for Bitcoin markets?
What level would invalidate the Bitcoin bounce thesis?
Source: Ali Charts · Published by CoinsProbe Markets Desk
The opinions and market insights shared on CoinsProbe represent the views of individual authors based on prevailing market conditions at the time of publication. Cryptocurrency investments carry significant risk and volatility. Readers are encouraged to conduct their own research and seek professional financial advice before making investment decisions. CoinsProbe and its contributors do not accept responsibility for financial losses or decisions made based on published content.
CoinsProbe may publish sponsored articles, affiliate links, or promotional collaborations. All sponsored material is clearly labeled to maintain transparency with our audience. Our editorial decisions remain fully independent, and advertising partnerships do not influence reviews, rankings, or published opinions.
Since 2023, CoinsProbe has delivered reliable insights on cryptocurrency, blockchain, and digital assets. Our content is created by experienced researchers and analysts who follow strict editorial standards focused on accuracy, transparency, and credibility. Every article is carefully reviewed and verified using trusted sources and current market data. We provide unbiased analysis and timely updates covering everything from emerging crypto projects to major industry developments.