

- Bitcoin trades at $81,333 (+2.07% 24h) as its Realized Cap resumes an upward trajectory after a documented contraction phase
- CryptoQuant analyst @metaverse9429 flags the 2023 structural parallel — when a Realized Cap recovery preceded Bitcoin's multi-quarter bull run
- Thesis is explicitly conditional: analyst states "if both hold" — price above Realized Cap AND continued capital inflow must both persist
- Realized Cap rising = new capital entering at higher cost bases; a plateau or rollover would invalidate the recovery signal before any price level does
Bitcoin is trading at $81,333 — up 2.07% in the past 24 hours, with a market capitalization of approximately $1.63 trillion — as one of the most structurally important on-chain metrics quietly begins to recover. The asset’s Realized Cap is rising again after a prior contraction phase, and according to CryptoQuant, the setup bears a meaningful resemblance to the early-2023 recovery that preceded Bitcoin’s most sustained bull run in years.
The observation comes from CryptoQuant analyst @metaverse9429, published via the CryptoQuant Quicktake platform and amplified by the official @cryptoquant_com account. The analyst’s exact conclusion: “If both hold, this renewed rise could mark the early stage of a healthier market structure, as it did in 2023.” The qualifier — “if both hold” — is not a formality. It is the central condition this entire thesis rests on.
What the Realized Cap Actually Measures
Before interpreting the current reading, the mechanism matters. Bitcoin’s Realized Cap is not market capitalization. It does not multiply the current price by circulating supply. Instead, it values each bitcoin at the price at which it last moved on-chain — its last realized transaction price. The aggregate of those individual cost bases produces the Realized Cap.
The practical implication: when the Realized Cap rises, it means capital is actively flowing into Bitcoin at higher prices than before. Coins are changing hands — or being held — at elevated cost bases. This is structurally different from a market cap increase driven purely by price appreciation with no new capital entering. A rising Realized Cap confirms that actual money is being deployed into the network. A declining Realized Cap signals the opposite: capital exit, realized losses being locked in, and deteriorating market structure.
The CryptoQuant Chart — What It Shows
The chart shared by @cryptoquant_com covers approximately 2016 to mid-2026, plotting Bitcoin’s price (right axis, logarithmic scale) against its Realized Cap in blue (left axis, denominated in USD terms from 0 to 1 trillion). The Realized Cap’s trajectory is annotated with directional arrows: a steep rise (green arrow), a plateau and decline phase (red arrow), followed by a recovery and another sharp climb (green arrow) at the chart’s right edge.
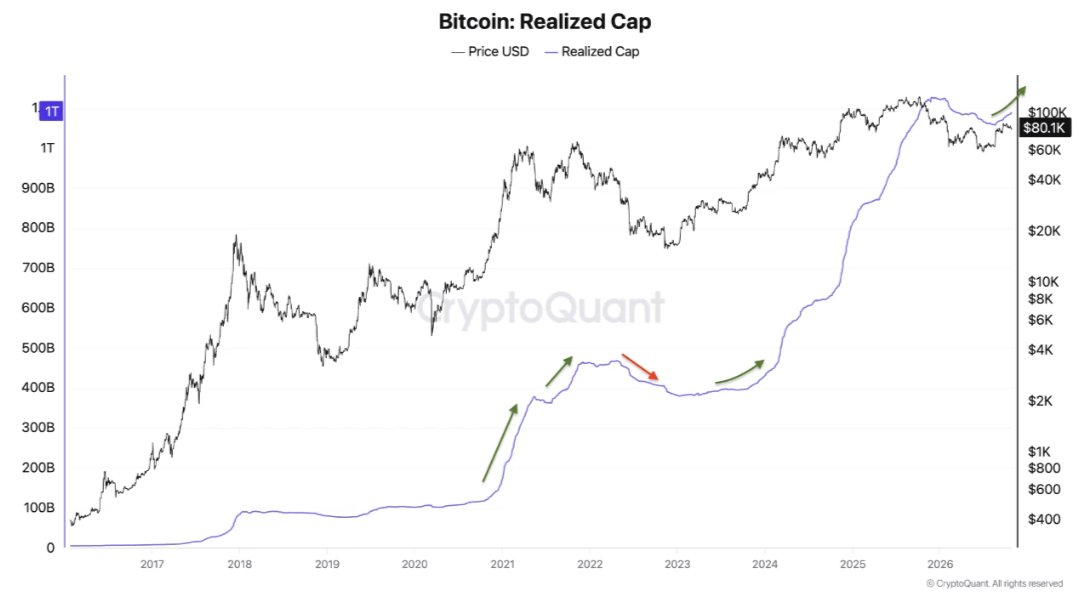
Critically, price is currently positioned above the Realized Cap line — the historically bullish configuration that has persisted during every sustained Bitcoin uptrend. The pattern status confirmed by the chart: the Realized Cap has resumed its upward trajectory, with the large green arrow at the right edge mirroring the 2023 recovery setup. The analyst is not projecting a future breakout — the Realized Cap is already rising. The question is whether that rise sustains.
The 2023 Parallel — Why It Matters
The 2023 reference is precise, not rhetorical. In early 2023, Bitcoin’s Realized Cap had contracted through the FTX collapse and extended bear market of 2022. When it began rising again — coinciding with price recovering from the $15,000–$16,000 lows — it signaled that new capital was re-entering the network at higher realized prices. That recovery in Realized Cap preceded Bitcoin’s advance from below $20,000 to eventually surpassing $69,000 in that cycle.
The structural parallel @metaverse9429 draws is that the current renewed rise in Realized Cap echoes that 2023 pattern: a prior contraction phase followed by a resumption of capital inflow. The chart’s annotated red arrow (decline phase) and the subsequent green arrow (current recovery) visually encode that comparison across the 2016-to-2026 timeline. This is not a recency-biased read — it is a decade-long dataset identifying a repeated structural signature.
For additional context on Bitcoin’s recent macro behavior, our earlier analysis of the Bitcoin Q4 midterm pattern outlines the seasonal forces that have historically shaped fourth-quarter price action.
The Condition: “If Both Hold”
The analyst’s conclusion is explicitly conditional. The phrase “if both hold” refers to two requirements that must remain intact for the thesis to develop. @metaverse9429 does not state this thesis as a certainty — and that restraint is the most important part of the note.
What are the two conditions? The analyst’s quicktake does not enumerate them by name in the surface tweet text, but the framing — a Realized Cap rise that is sustained, combined with price maintaining its position above the Realized Cap line — is the logical reading consistent with the chart’s visual structure. Bitcoin’s price remaining above Realized Cap is condition one: it preserves the cost-basis premium that historically characterizes bull markets. The Realized Cap itself continuing to rise — not plateauing or reversing — is condition two: it confirms ongoing capital inflow rather than a one-time technical bounce.
If either fails — if price drops below Realized Cap, or if the Realized Cap itself stalls and rolls over — the 2023 analogy breaks down. The analyst is explicit that this is an early-stage signal, not a confirmed structural shift.
Why This Matters at $81,333
Bitcoin at $81,333 with a rising Realized Cap is a materially different picture from Bitcoin at $81,333 with a flat or declining Realized Cap. The former indicates that the market is building a higher aggregate cost base — meaning holders are not capitulating, and new entrants are absorbing supply at elevated prices. The latter would indicate price is being held up without corresponding capital commitment.
The 24-hour trading volume of $23.08 billion provides a live data point on market participation. Volume alone does not determine Realized Cap direction — that requires on-chain settlement, not just exchange turnover — but sustained volume at current price levels is consistent with the capital inflow narrative the Realized Cap is beginning to reflect.
The broader macro environment also shapes follow-through probability. As detailed in our analysis of global monetary expansion, liquidity conditions in major economies have historically influenced Bitcoin’s ability to sustain capital inflow at elevated prices.
Bullish Scenario
If the Realized Cap continues rising and Bitcoin’s spot price holds above it — the two conditions @metaverse9429 specifies — the setup replicates the 2023 structural recovery pattern. In 2023, that configuration marked the early stage of a multi-quarter bull market. Continuation here would confirm that the current rise is capital-driven, not speculative price-only inflation.
Bearish Scenario
A reversal in the Realized Cap — where the blue line plateaus and begins declining again — would signal capital is exiting rather than accumulating. Combined with price losing its premium above the Realized Cap, that configuration historically corresponds to bear market re-entry, not cycle continuation. The 2022 bear market’s most sustained damage occurred precisely when both conditions inverted.
Bitcoin’s Realized Cap has resumed its upward climb after a documented contraction phase, with price holding above it at $81,333 — the precise structural alignment that characterized the early 2023 recovery. CryptoQuant analyst @metaverse9429 identifies this as a positive signal, but anchors the entire thesis on one conditional: both must hold. Capital inflow must persist, and price must maintain its realized-cap premium. Neither is guaranteed. The metric to track is CryptoQuant’s Realized Cap in real time — a plateau or rollover invalidates the thesis before any price level does. Watch Bitcoin’s Realized Cap trajectory as the primary confirmation signal for whether this recovery is structural or premature.
Frequently Asked Questions
What is Bitcoin’s Realized Cap and why does it differ from market cap?
What are the two conditions @metaverse9429 requires for the bullish thesis to hold?
What happened in 2023 when Bitcoin’s Realized Cap last recovered like this?
Where can I track Bitcoin’s Realized Cap in real time to monitor this signal?
Source: CryptoQuant · Published by CoinsProbe Markets Desk
The opinions and market insights shared on CoinsProbe represent the views of individual authors based on prevailing market conditions at the time of publication. Cryptocurrency investments carry significant risk and volatility. Readers are encouraged to conduct their own research and seek professional financial advice before making investment decisions. CoinsProbe and its contributors do not accept responsibility for financial losses or decisions made based on published content.
CoinsProbe may publish sponsored articles, affiliate links, or promotional collaborations. All sponsored material is clearly labeled to maintain transparency with our audience. Our editorial decisions remain fully independent, and advertising partnerships do not influence reviews, rankings, or published opinions.
Since 2023, CoinsProbe has delivered reliable insights on cryptocurrency, blockchain, and digital assets. Our content is created by experienced researchers and analysts who follow strict editorial standards focused on accuracy, transparency, and credibility. Every article is carefully reviewed and verified using trusted sources and current market data. We provide unbiased analysis and timely updates covering everything from emerging crypto projects to major industry developments.