
- CryptoQuant flags Bitcoin profitability and MVRV momentum improving simultaneously — two of three on-chain signals now constructive
- Apparent Demand remains the key weak spot per CryptoQuant — the only metric requiring new capital inflows to turn positive
- MVRV momentum measures rate of change in market-to-realized-value gap — sustained expansion above 1.0 has preceded every major Bitcoin bull leg
- CryptoQuant V2 indicators now live via API — Apparent Demand shift will be observable on-chain before price confirms
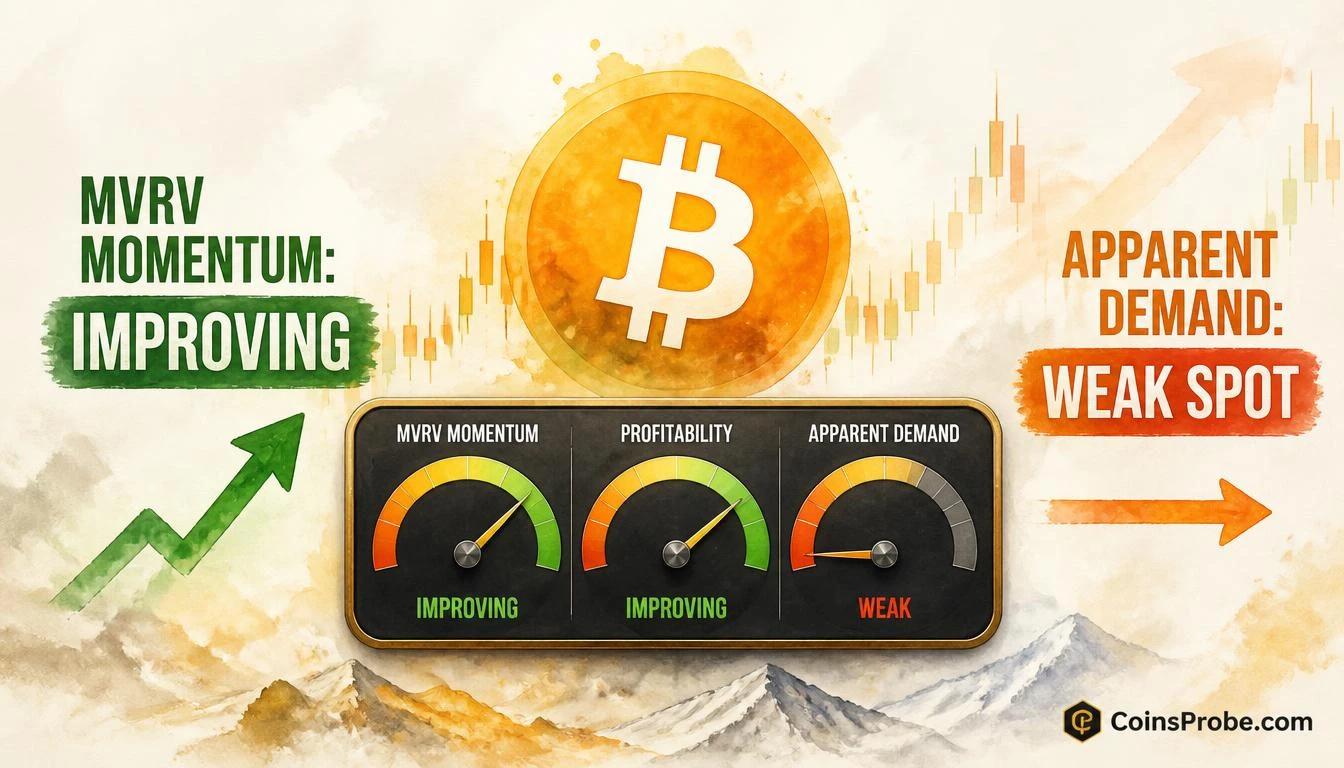
Bitcoin is flashing a split signal — and the divergence between its on-chain metrics matters more than any single price level. Profitability conditions and MVRV momentum are improving simultaneously, but Apparent Demand — the metric that drives sustained rallies — remains the critical weak spot in an otherwise constructive setup.
CryptoQuant (@cryptoquant_com) flagged the divergence directly: “Profitability and MVRV momentum are improving, while Apparent Demand remains the key weak spot.” That three-word qualifier — “key weak spot” — is the load-bearing phrase in the entire note. Two out of three signals are aligning. The third is the one that matters for continuation.
What These Three Indicators Actually Measure
Before interpreting the readings, the mechanics of each metric need to be clear — because all three measure fundamentally different things, and conflating them produces the wrong conclusion.
Profitability in CryptoQuant’s framework measures what percentage of the circulating Bitcoin supply is currently held at an unrealized gain relative to its realized (cost-basis) price. When profitability improves, it means more coins have risen above their acquisition price — reducing the structural sell pressure from underwater holders. This is a sentiment stabilizer, not a demand signal.
MVRV Momentum is derived from the Market Value to Realized Value ratio — a metric that compares Bitcoin’s current market capitalization against the aggregate cost basis of every coin on-chain. When MVRV momentum is improving, the gap between market price and realized price is widening in a positive direction. Historically, sustained MVRV expansion above the 1.0 threshold has preceded every major Bitcoin bull leg. The momentum component — the rate of change, not just the level — adds a velocity dimension that the raw ratio lacks.
Apparent Demand measures the net flow of Bitcoin into the market from new supply versus the coins being absorbed by long-term holders and exchange outflows. It is the closest on-chain proxy to real buying pressure. When Apparent Demand is negative or flat, new capital is not entering the market at a rate sufficient to absorb supply — regardless of how constructive MVRV or profitability look. This is why CryptoQuant explicitly isolates it as the weak spot: the other two metrics can improve on existing holder behavior alone. Apparent Demand requires new money.
Why the Divergence Creates an “Interesting Setup”
The specific combination CryptoQuant identifies — profitability and MVRV improving while Apparent Demand lags — is not a random mix of signals. It describes a market in a particular phase: one where existing holders are comfortable and growing their unrealized gains, but where fresh capital has not yet confirmed the move.
This pattern has appeared at inflection points before the broader market recognized a regime shift. The improvement in MVRV momentum means the realized price floor is rising — meaning even at current prices, the average on-chain cost basis is being left behind. That is structurally positive. But without Apparent Demand turning, price advances can stall or retrace as supply from early entrants meets insufficient new buying to absorb it.
The setup is not bullish confirmation. It is a pre-condition for bullish confirmation — which is precisely why CryptoQuant describes it as “interesting” rather than resolved. For context on how on-chain signals have historically preceded Bitcoin moves, the Bitcoin TD Sequential Buy Signal analysis documents how technical exhaustion readings align with on-chain shifts at key turning points.
The One Metric to Watch: Apparent Demand
Of the three signals CryptoQuant flags, Apparent Demand is the only one that requires active market participation to improve — and therefore the only one that cannot be inferred from existing holder behavior. Profitability rises as price rises. MVRV momentum improves as the market price outpaces the realized price. Both can advance on low volume if selling pressure is absent.
Apparent Demand is different. It turns positive only when the rate of new Bitcoin absorption — through exchange outflows, new wallet accumulation, and ETF inflows — exceeds the rate at which new supply enters the market. In practical terms: Apparent Demand turning positive is the on-chain confirmation that new buyers are entering at scale.
Until that reading shifts, the setup CryptoQuant identifies remains a potential catalyst, not a confirmed signal. The two improving metrics create the structural foundation. Apparent Demand is the ignition.
It is worth noting that CryptoQuant has released these metrics — including profitability, MVRV momentum, and Apparent Demand — as part of its V2 indicator suite, now available through the CryptoQuant API. These are not retroactive observations; they are live, tracked signals that institutional and professional analysts can monitor in real time. That availability matters: when Apparent Demand does shift, it will be visible on-chain before it registers in price action.
What Confirmation Looks Like
The setup resolves in one of two directions. A bullish resolution requires Apparent Demand turning from flat or negative to clearly positive — measurable through sustained exchange outflows, rising ETF net inflows, and new wallet accumulation at scale. When that happens alongside the already-improving MVRV momentum and profitability, all three metrics align and the structural case for continuation becomes data-backed rather than conditional.
A bearish resolution — or at minimum a stalled one — occurs if Apparent Demand fails to inflect while MVRV momentum plateaus or reverses. In that scenario, the profitability and MVRV improvements were reflecting a temporary price recovery absorbed by existing holders, not a genuine demand expansion. Zcash provides a useful parallel: even when unrealized profits accumulate significantly on-chain — as documented in the Zcash whale profitability analysis — structural hedging activity can signal that smart money is not yet committed to the upside.
Bullish Scenario
Apparent Demand turns positive on the CryptoQuant V2 dashboard while MVRV momentum continues expanding. All three metrics align. This is the on-chain confirmation that the “interesting setup” has resolved bullishly — and historically, that three-metric alignment has preceded sustained Bitcoin advances.
Bearish Scenario
Apparent Demand remains flat or deteriorates. MVRV momentum peaks and begins contracting as price stalls. The two improving metrics were reflecting a low-volume relief move rather than genuine demand expansion. The setup fails to confirm.
The CryptoQuant read is precise: two of three signals are constructive. The third — Apparent Demand — is the deciding variable. It cannot be inferred; it must be observed. Watch the CryptoQuant V2 Apparent Demand reading. When it turns, the setup CryptoQuant flagged on October 2 will have its answer.
Frequently Asked Questions
What is Apparent Demand in CryptoQuant’s framework and why does it matter?
What does improving MVRV momentum mean for Bitcoin right now?
Are CryptoQuant’s V2 indicators different from their existing metrics?
What would confirm that Bitcoin’s current setup has resolved bullishly?
Source: CryptoQuant · Published by CoinsProbe Markets Desk
The opinions and market insights shared on CoinsProbe represent the views of individual authors based on prevailing market conditions at the time of publication. Cryptocurrency investments carry significant risk and volatility. Readers are encouraged to conduct their own research and seek professional financial advice before making investment decisions. CoinsProbe and its contributors do not accept responsibility for financial losses or decisions made based on published content.
CoinsProbe may publish sponsored articles, affiliate links, or promotional collaborations. All sponsored material is clearly labeled to maintain transparency with our audience. Our editorial decisions remain fully independent, and advertising partnerships do not influence reviews, rankings, or published opinions.
Since 2023, CoinsProbe has delivered reliable insights on cryptocurrency, blockchain, and digital assets. Our content is created by experienced researchers and analysts who follow strict editorial standards focused on accuracy, transparency, and credibility. Every article is carefully reviewed and verified using trusted sources and current market data. We provide unbiased analysis and timely updates covering everything from emerging crypto projects to major industry developments.