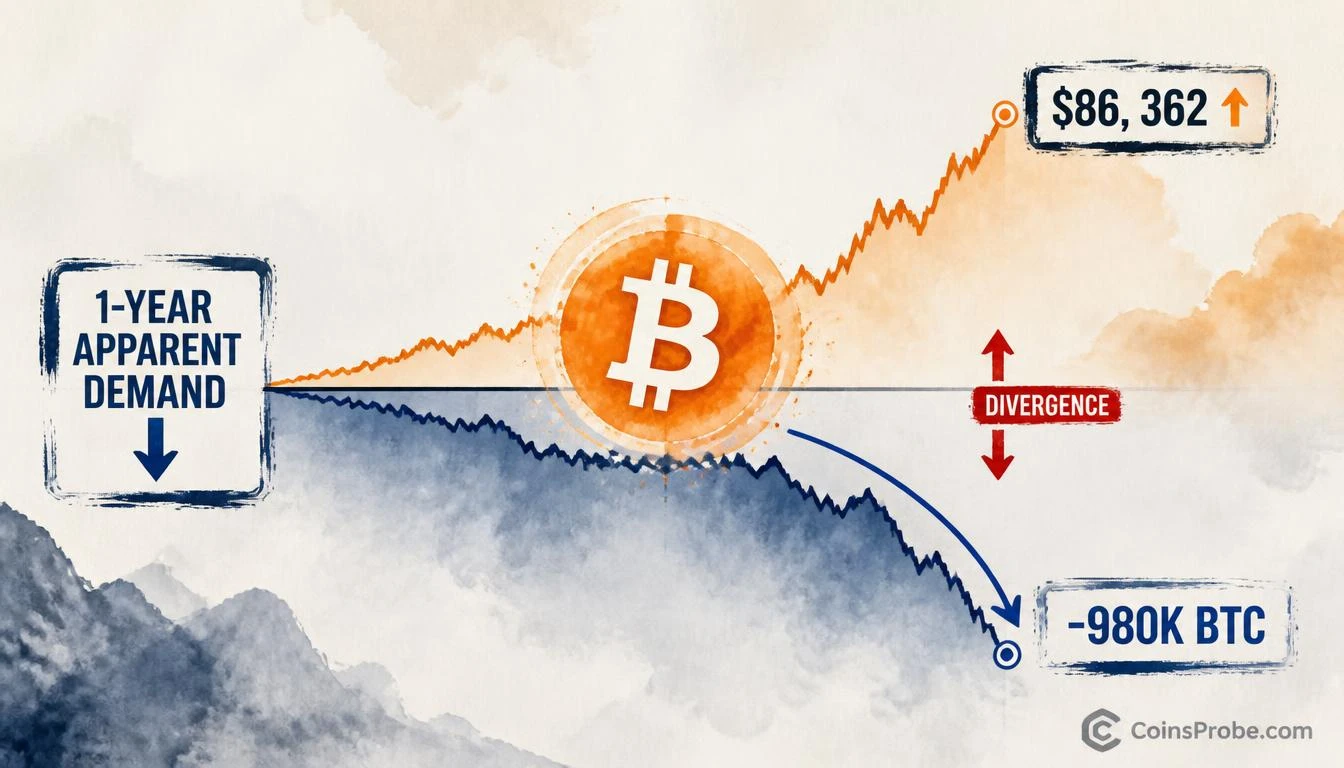

- Bitcoin trades at $86,362 (+3.15% 24h) while 1-year Apparent Demand drops ~980K BTC — CryptoQuant flags bearish divergence
- Same demand-vs-price divergence pattern preceded 84% correction in 2018 and 78% correction in 2021 per CryptoQuant chart
- 30-day negative demand (red indicator) expanding and SMA(90) curling downward — confirming weakening momentum
- Watch $83,000 as the key level where demand-driven bull thesis holds or begins to break
Bitcoin is trading at $86,362 — up 3.15% in the last 24 hours — with a market cap of $1.735 trillion. But one on-chain metric is telling a different story from the price action: the underlying demand that typically fuels sustained rallies is moving in the opposite direction.
That is the observation from CryptoQuant (@cryptoquant_com), one of the most widely cited on-chain data platforms in the industry. Their signal is direct: “Bitcoin’s price is rising, while 1-year Apparent Demand has declined by roughly 980K BTC. Price up, underlying demand trending down. That divergence is worth monitoring.” This is not a bearish declaration — it is a structural caution flag.
What Is 1-Year Apparent Demand — And Why Does It Matter?
Before treating the reading as a sell signal, the metric itself requires a precise definition. 1-Year Apparent Demand is a CryptoQuant indicator that measures the net change in Bitcoin held by entities active within the past year — essentially quantifying how much new BTC is being absorbed by fresh demand versus how much is being released back into circulation. It is not a price indicator. It is a demand-side flow metric. When it rises, more Bitcoin is being accumulated than distributed. When it falls, the reverse is true.
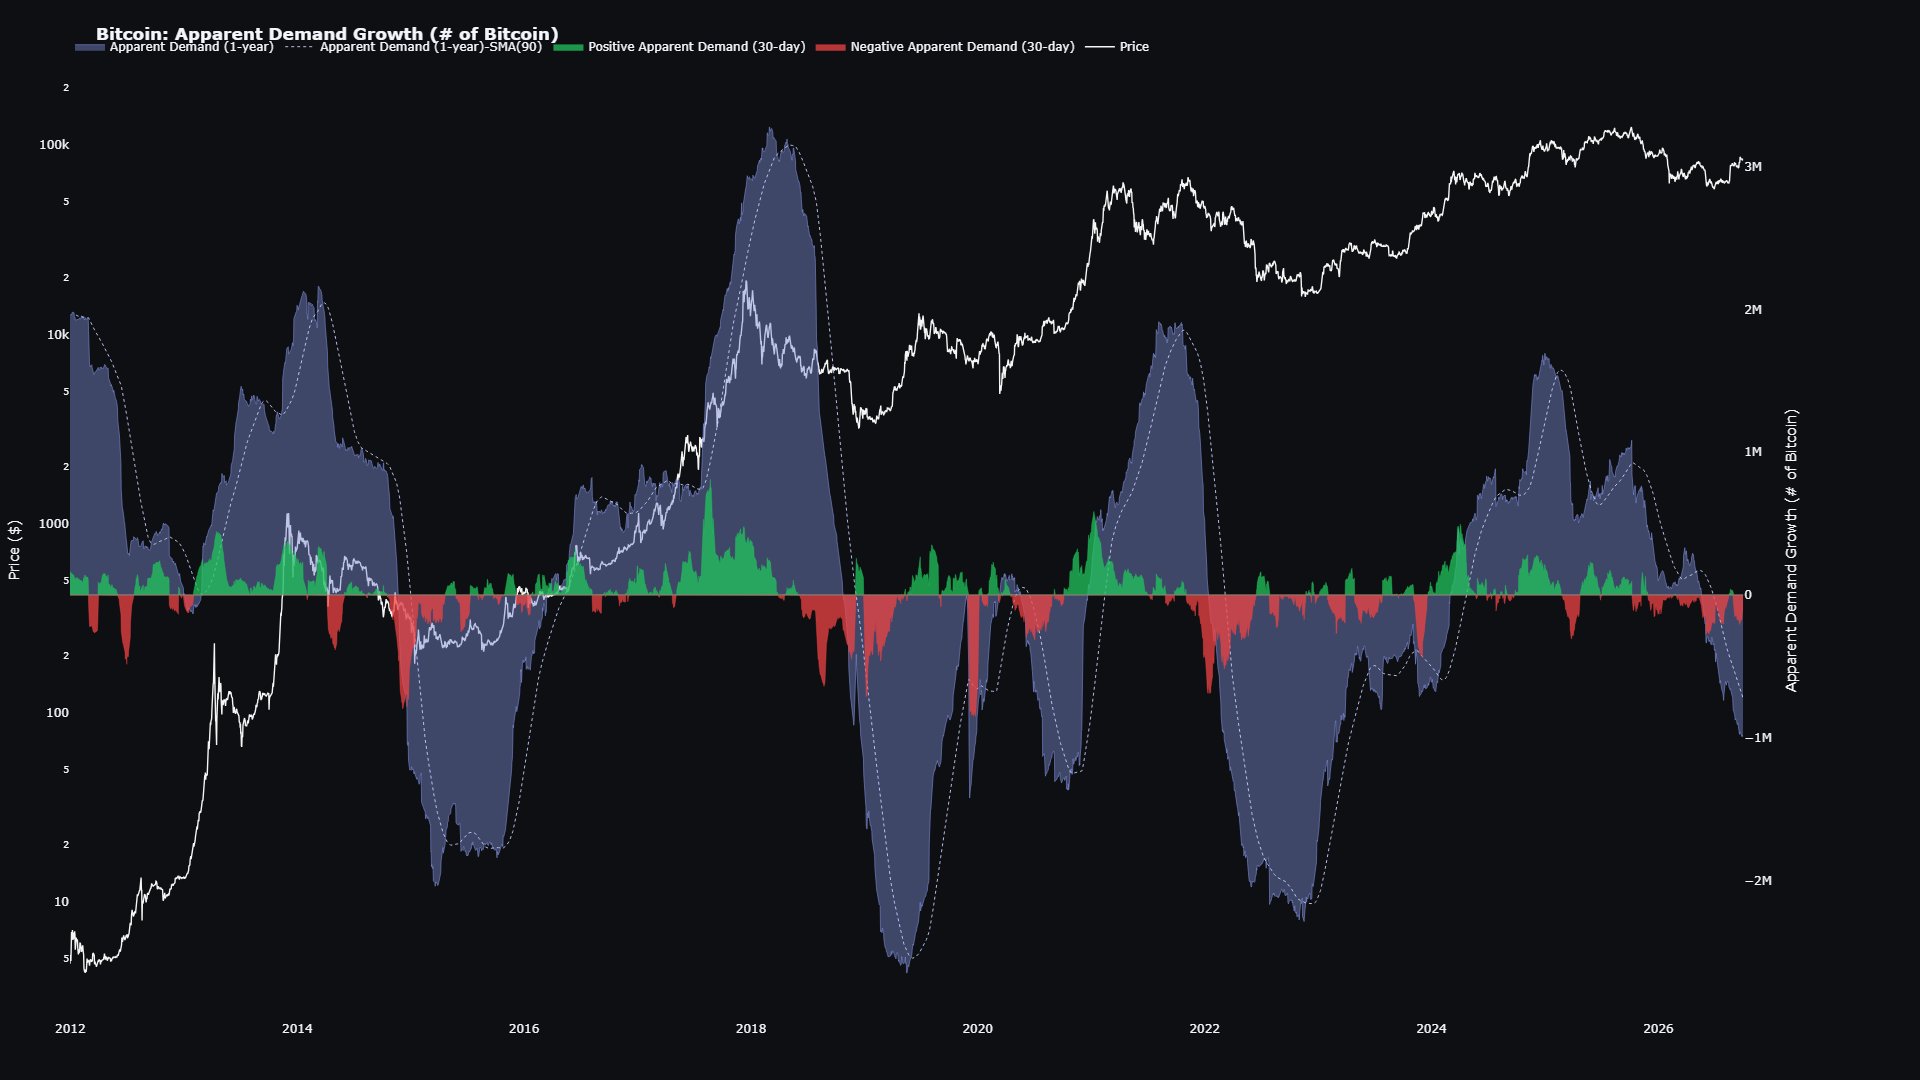
The current reading shows approximately −980,000 BTC of net demand deterioration from its recent peak — a swing of nearly one million Bitcoin in underlying appetite while price has continued pushing toward the $95,000–$100,000 range on a trailing basis and currently holds at $86,362. The blue demand area on CryptoQuant’s chart is visibly contracting. The 30-day negative demand indicator (shown in red on the chart) is simultaneously expanding. The SMA(90) dotted trend line on the demand series has curled downward — confirming the weakening is not a one-week anomaly.
The Historical Pattern — 2018 and 2021 Both Showed This First
CryptoQuant’s own chart, spanning Bitcoin’s full history from 2012 to 2026 on a logarithmic price scale, shows two prior instances where this exact divergence configuration appeared at scale: late 2017 into 2018, and late 2021. In both cases, demand peaked before price peaked. The sequence was identical — demand began contracting while price continued making new highs, before the subsequent correction arrived. In the 2018 cycle, Bitcoin corrected from approximately $20,000 to a low near $3,200 — an 84% drawdown. In 2021, the peak-to-trough move from $69,000 to $15,500 represented a 78% decline. Neither correction began the day demand turned. The divergence led by weeks to months in both cases.
That historical sequence is why CryptoQuant frames this as a signal to monitor — not an immediate exit trigger. Demand divergences in prior cycles flagged elevated risk, not guaranteed outcomes. The current setup mirrors those pre-correction phases structurally. Whether it resolves the same way depends on whether demand stabilizes or continues declining from here.
Price Strength Without Demand Confirmation — The Core Risk
The analytical principle behind this signal is straightforward: price can move on sentiment, leverage, and liquidity. Sustained bull markets require actual net accumulation — new buyers absorbing supply at higher prices. When demand metrics begin declining while price rises, it typically indicates the rally is being driven by thinner participation than the price action implies. Fewer entities are absorbing Bitcoin on a net basis even as the spot price holds elevated levels.
At prior demand peaks in bull cycles, the 1-year Apparent Demand reading reached approximately 2M–3M BTC on the positive side. The current reading, having declined by ~980K BTC from its recent high, is trending toward the −1M BTC territory on the right axis of CryptoQuant’s chart. That is not a marginal decline — it is a meaningful structural shift in the net flow balance. For context on how price momentum can diverge from on-chain fundamentals in broader crypto markets, similar demand-versus-price gaps have appeared across assets; the Monero surge analysis at CoinsProbe documents a comparable case of price action disconnecting from its fundamental driver.
What This Signal Says — And What It Doesn’t
What it confirms: A measurable, data-backed divergence between spot price and 1-year net demand absorption. The divergence is visible on CryptoQuant’s full-cycle chart and consistent with pre-correction setups in 2018 and 2021.
What it does not confirm: A price top, an imminent correction, or a specific downside target. CryptoQuant’s own framing is explicit — this is a signal to monitor, not a reversal confirmation. Demand could stabilize at current levels and recover, particularly if spot ETF inflows or institutional accumulation accelerates to offset the declining on-chain demand reading.
What to watch for: Stabilization or reversal in the 1-year Apparent Demand figure. A flattening of the 30-day negative demand (red) indicator. Recovery in the SMA(90) dotted line above its current downward slope. These would suggest the divergence is resolving rather than deepening.
Bullish Scenario
If 1-year Apparent Demand stabilizes and begins recovering from the ~−980K BTC trough while Bitcoin holds above the $83,000–$85,000 structural support zone, the divergence resolves without a corrective phase — consistent with mid-cycle demand consolidations seen in 2019 and 2023 that preceded renewed advances.
Bearish Scenario
If the demand figure continues declining toward −1M BTC and beyond while price fails to hold the current range, the setup increasingly mirrors the late-2021 pre-correction configuration — where sustained demand deterioration ultimately preceded a multi-month price decline. Loss of the $83,000 level with continued demand weakness would escalate the risk reading materially.
The signal from CryptoQuant is not ambiguous: Bitcoin is showing a 980,000 BTC divergence between price and underlying demand — the same structural pattern that preceded the two largest corrections of the past decade. At $86,362, the price remains elevated. The demand baseline does not. CryptoQuant’s own conclusion frames it correctly: this is worth monitoring. Watch the 1-year Apparent Demand figure on CryptoQuant for stabilization — and watch $83,000 on spot price as the level where a demand-driven thesis either holds or begins to crack.
Source: x.comFrequently Asked Questions
What is Bitcoin’s 1-Year Apparent Demand and why is it dropping?
Has this demand divergence signal appeared before in Bitcoin’s history?
Does this signal mean Bitcoin will correct immediately?
What price level should Bitcoin traders watch given this demand data?
Source: CryptoQuant · Published by CoinsProbe Markets Desk
The opinions and market insights shared on CoinsProbe represent the views of individual authors based on prevailing market conditions at the time of publication. Cryptocurrency investments carry significant risk and volatility. Readers are encouraged to conduct their own research and seek professional financial advice before making investment decisions. CoinsProbe and its contributors do not accept responsibility for financial losses or decisions made based on published content.
CoinsProbe may publish sponsored articles, affiliate links, or promotional collaborations. All sponsored material is clearly labeled to maintain transparency with our audience. Our editorial decisions remain fully independent, and advertising partnerships do not influence reviews, rankings, or published opinions.
Since 2023, CoinsProbe has delivered reliable insights on cryptocurrency, blockchain, and digital assets. Our content is created by experienced researchers and analysts who follow strict editorial standards focused on accuracy, transparency, and credibility. Every article is carefully reviewed and verified using trusted sources and current market data. We provide unbiased analysis and timely updates covering everything from emerging crypto projects to major industry developments.