
- Bitcoin trades at $76,045 (-1.16% 24h), market cap $1.527T, as 4H TD Sequential prints 4th buy signal per @alicharts
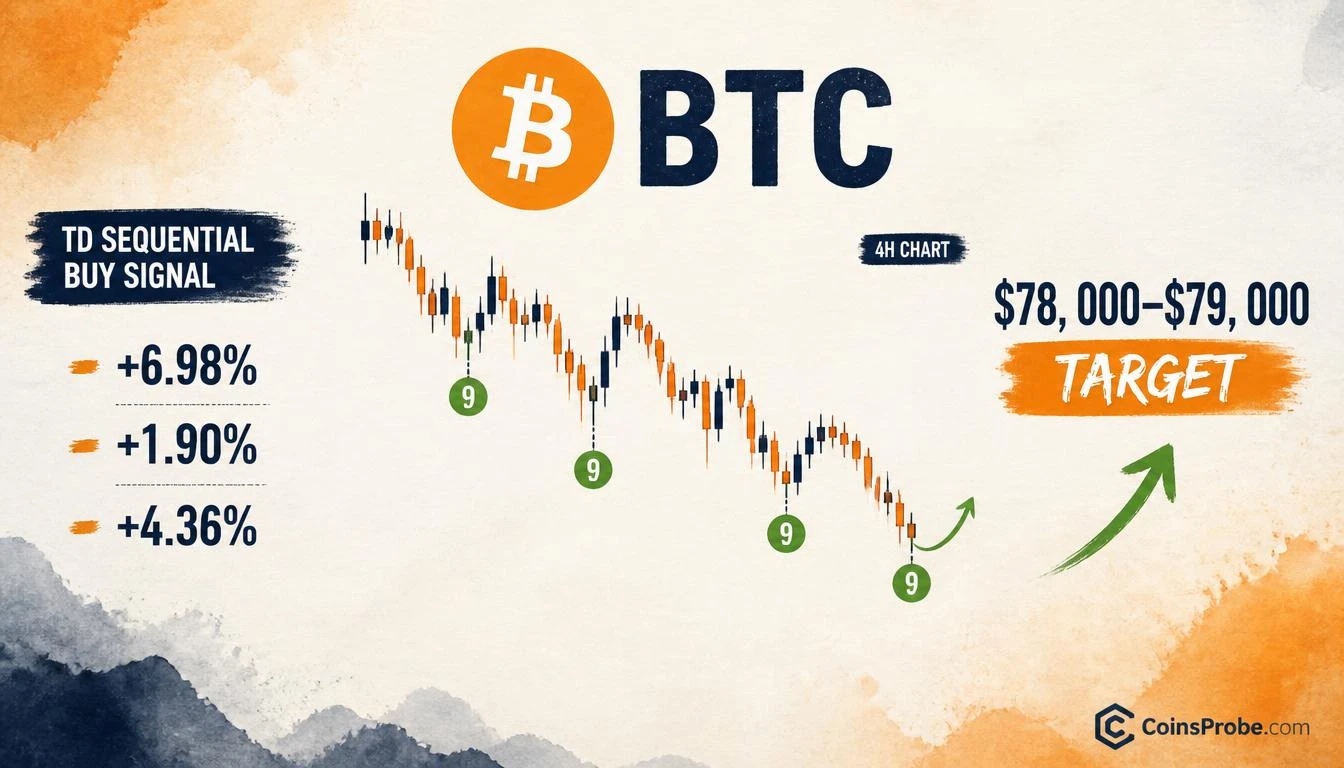
- Last three identical signals produced +6.98%, +1.90%, +4.36% bounces — average +4.41% — on the same 4H timeframe
- Bounce target: $78,000–$79,000; hard invalidation below $75,000 on a 4H close
- FOMC rate decision is live catalyst — a hawkish surprise can override the technical signal entirely
Bitcoin is trading at $76,045 — down 1.16% in the past 24 hours — with a market cap of $1.527 trillion, and its 4-hour chart has just printed a technical signal with a three-for-three track record of producing short-term bounces. The timing is not incidental: the signal fires directly ahead of a Federal Reserve rate decision, placing a known macro catalyst in the same window as a historically reliable exhaustion marker.
The signal was identified by crypto analyst Ali Charts (@alicharts), who noted on September 16, 2026: “The TD Sequential has flashed a buy signal on Bitcoin’s 4-hour chart just ahead of the Fed’s rate decision. What makes this signal interesting is what happened the last three times it appeared: +6.98%, +1.90%, +4.36%.” This is the fourth instance of the signal appearing on the same timeframe — all within the same macro structure.
What the TD Sequential Actually Measures
Before citing the readings, the mechanics matter. The TD Sequential — developed by Tom DeMark — counts nine consecutive candlestick closes each lower than the close four bars prior. When the count reaches nine, it flags that bearish momentum has become statistically exhausted, not that price must reverse. The signal identifies depletion of a directional move, not its replacement. It fires regardless of whether the broader trend is up or down — which is precisely why the current context (a bearish structure with lower highs and lower lows on the 4-hour) does not disqualify it.
The TD Sequential is a non-directional exhaustion indicator. It does not predict how far a bounce will travel. It identifies where selling momentum has historically run out of fuel.
Signal 1, 2, and 3 — The Prior Track Record
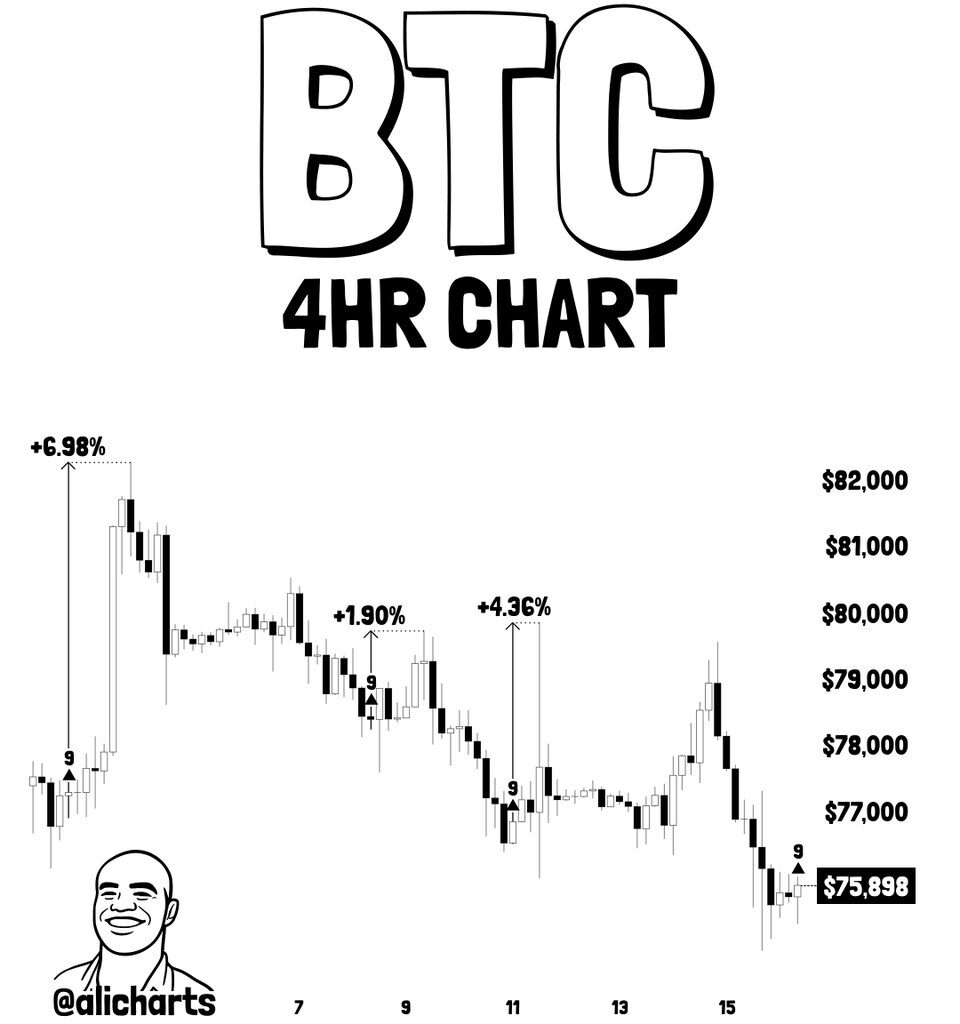
According to the chart shared by @alicharts, the current signal is the fourth TD Sequential “9” buy print on Bitcoin’s 4-hour chart across the March 7–15 window. Each prior instance produced a measurable bounce before the broader downtrend resumed:
| Signal Instance | Signal Type | Rally Produced |
|---|---|---|
| Signal 1 | TD Sequential “9” (4H) | +6.98% |
| Signal 2 | TD Sequential “9” (4H) | +1.90% |
| Signal 3 | TD Sequential “9” (4H) | +4.36% |
| Signal 4 (Current) | TD Sequential “9” (4H) | Firing at $75,898–$76,045 |
Source: @alicharts (X)
Three-for-three is a track record. The average bounce across the three prior signals is approximately +4.41%, with the range spanning from +1.90% to +6.98%. Applied to the current price of $76,045, a comparable bounce would target the $77,490–$81,355 range — consistent with the $78,000–$79,000 zone identified in the chart analysis as the nearest resistance cluster.
The 4-Hour Chart — What @alicharts Is Seeing
The 4-hour BTC/USD chart shared by @alicharts shows Bitcoin trading within a bearish structure — lower highs and lower lows from a recent peak above $82,000. The current TD Sequential “9” signal fires at approximately $75,898, with the $75,000–$76,000 band functioning as the nearest support zone. Each prior “9” marker on this chart appeared at comparable exhaustion points and was followed by a bounce before the broader downtrend resumed.
The chart’s key implication is that while the macro structure remains bearish, the signal is occurring at a point where selling momentum — as measured across nine consecutive 4-hour closes — has depleted. The nearest overhead resistance sits at $78,000–$79,000, which aligns with the prior bounce target range. Stop-loss placement below $75,000 is the critical invalidation zone per the chart structure.
This pattern arrives alongside elevated short-term market stress. The CLARITY Act rejection by the Senate triggered the largest short-term Bitcoin holder capitulation in a month — a fundamental pressure layer sitting beneath the technical setup. Meanwhile, institutional flows remain active: MARA Holdings purchased 1,292 BTC for $98.64M through FalconX, signaling that demand at these levels is not purely retail.
The FOMC Variable — Catalyst or Override?
The TD Sequential signal fires inside a specific macro window: a Federal Reserve rate decision. This adds a variable that technical signals alone cannot price. FOMC outcomes have historically overridden short-term technical setups in both directions — a hawkish surprise can invalidate a buy signal within hours; a dovish outcome or hold can amplify it sharply.
What the FOMC context does is narrow the signal’s behavioral window. Rather than a multi-day exhaust bounce, traders are watching for an immediate directional response in the hours surrounding the rate announcement. The TD Sequential identifies where selling momentum has run out — but the FOMC determines whether buyers step in to replace it or whether macro pressure extends the structure.
Context: Whale 0x4553 recently rotated $65.37M in BTC into 26,924 ETH — a signal that at least one large holder was reducing Bitcoin exposure at current levels, adding supply-side friction to any bounce attempt.
What the Signal Says — And What It Doesn’t
What it says: Bearish momentum on the 4-hour timeframe has reached the exhaustion count — the same count that preceded bounces of +1.90%, +4.36%, and +6.98% across the three prior instances identified by @alicharts.
What it doesn’t say: The overall downtrend has reversed. The 4-hour structure remains bearish. This is a counter-trend bounce signal, not a macro bottom confirmation. Each prior bounce was eventually followed by a resumption of the lower-high, lower-low structure.
What to watch for continuation: A sustained hold above $76,000 post-FOMC with a move toward $78,000 would constitute signal follow-through. A breakdown below $75,000 on a 4-hour close would invalidate the bounce thesis and open the $72,000–$73,000 range.
Bullish Scenario — Hold Above $76,000 Post-FOMC
If Bitcoin sustains above $76,000 following the Fed decision and buying volume enters, the signal-consistent target is $78,000–$79,000 — a +2.6% to +3.9% move from current levels, within the lower bound of prior signal outcomes (+1.90%). A dovish or neutral Fed decision would be the primary catalyst amplifying this outcome toward the +6.98% upper bound, targeting approximately $81,355.
Bearish Scenario — Break Below $75,000
A 4-hour close below $75,000 invalidates the exhaustion thesis. At that level, the TD Sequential count resets and the next meaningful support cluster sits at $72,000–$73,000 — representing an additional 4%–5% decline from current levels. A hawkish Fed surprise is the primary macro scenario that overrides the technical signal.
Bottom Line
The TD Sequential has printed a fourth consecutive “9” buy signal on Bitcoin’s 4-hour chart at $75,898–$76,045, per @alicharts. The three prior instances produced rallies of +6.98%, +1.90%, and +4.36% — an average of +4.41% — before the broader bearish structure resumed. The signal does not confirm a macro bottom; it identifies momentum exhaustion at a specific level, within a specific timeframe, with a specific historical track record. Whether it becomes four-for-four will be determined in the hours following the Fed rate decision: watch $75,000 as the hard invalidation level and $78,000–$79,000 as the immediate bounce target that signal precedent supports.
Frequently Asked Questions
What is the TD Sequential buy signal on Bitcoin’s 4-hour chart?
What did the last three TD Sequential buy signals produce for Bitcoin?
What is the bounce target and invalidation level for this Bitcoin signal?
Does this TD Sequential signal mean Bitcoin’s downtrend is over?
How does the FOMC rate decision affect this Bitcoin buy signal?
Source: Ali Charts · Published by CoinsProbe Markets Desk
The opinions and market insights shared on CoinsProbe represent the views of individual authors based on prevailing market conditions at the time of publication. Cryptocurrency investments carry significant risk and volatility. Readers are encouraged to conduct their own research and seek professional financial advice before making investment decisions. CoinsProbe and its contributors do not accept responsibility for financial losses or decisions made based on published content.
CoinsProbe may publish sponsored articles, affiliate links, or promotional collaborations. All sponsored material is clearly labeled to maintain transparency with our audience. Our editorial decisions remain fully independent, and advertising partnerships do not influence reviews, rankings, or published opinions.
Since 2023, CoinsProbe has delivered reliable insights on cryptocurrency, blockchain, and digital assets. Our content is created by experienced researchers and analysts who follow strict editorial standards focused on accuracy, transparency, and credibility. Every article is carefully reviewed and verified using trusted sources and current market data. We provide unbiased analysis and timely updates covering everything from emerging crypto projects to major industry developments.