
- CryptoQuant founder Ki Young Ju has stated definitively: "The Bitcoin bear cycle is over" — backed by the proprietary Bull-Bear Market Cycle Indicator transitioning out of the Bear zone toward Early Bull territory.
- Bitcoin's Bull Score surged from 30 to 80 in just seven days — the fastest regime flip in a year — with 8 of 10 underlying indicators now flashing bullish and spot demand growing at its fastest monthly pace since December 2025.
- $83,000 — the 365-day moving average — is the sole remaining confirmation threshold. A sustained weekly close above it would fully validate the new bull market signal.
Bitcoin is trading at approximately $79,011 — up 22.87% over 7 days with a market cap of $1.58 trillion — as CryptoQuant’s on-chain framework delivers one of the most direct and data-backed bull market declarations the analytics platform has issued in this cycle. This is not a sentiment call or a price target. It is a specific, indicator-driven assessment from the founder of one of crypto’s most respected on-chain analytics firms: the Bitcoin bear cycle is over.
The declaration is supported by two independent CryptoQuant metrics that are now aligned simultaneously — the Bull-Bear Market Cycle Indicator and the Bull Score Index — in a configuration that last appeared at the start of the previous bull phase in January 2023.

CryptoQuant Founder: “The Bitcoin Bear Cycle Is Over”
The clearest statement came directly from CryptoQuant founder Ki Young Ju: “The Bitcoin bear cycle is over.”
This is not a hedged observation or a probabilistic framework — it is a declarative conclusion from the founder of the platform whose data underpins the call. The assessment is backed by CryptoQuant’s proprietary Bitcoin Bull-Bear Market Cycle Indicator — a composite on-chain metric that classifies Bitcoin’s macro market regime into Bear, Transition, and Early Bull phases based on a defined set of underlying data inputs.
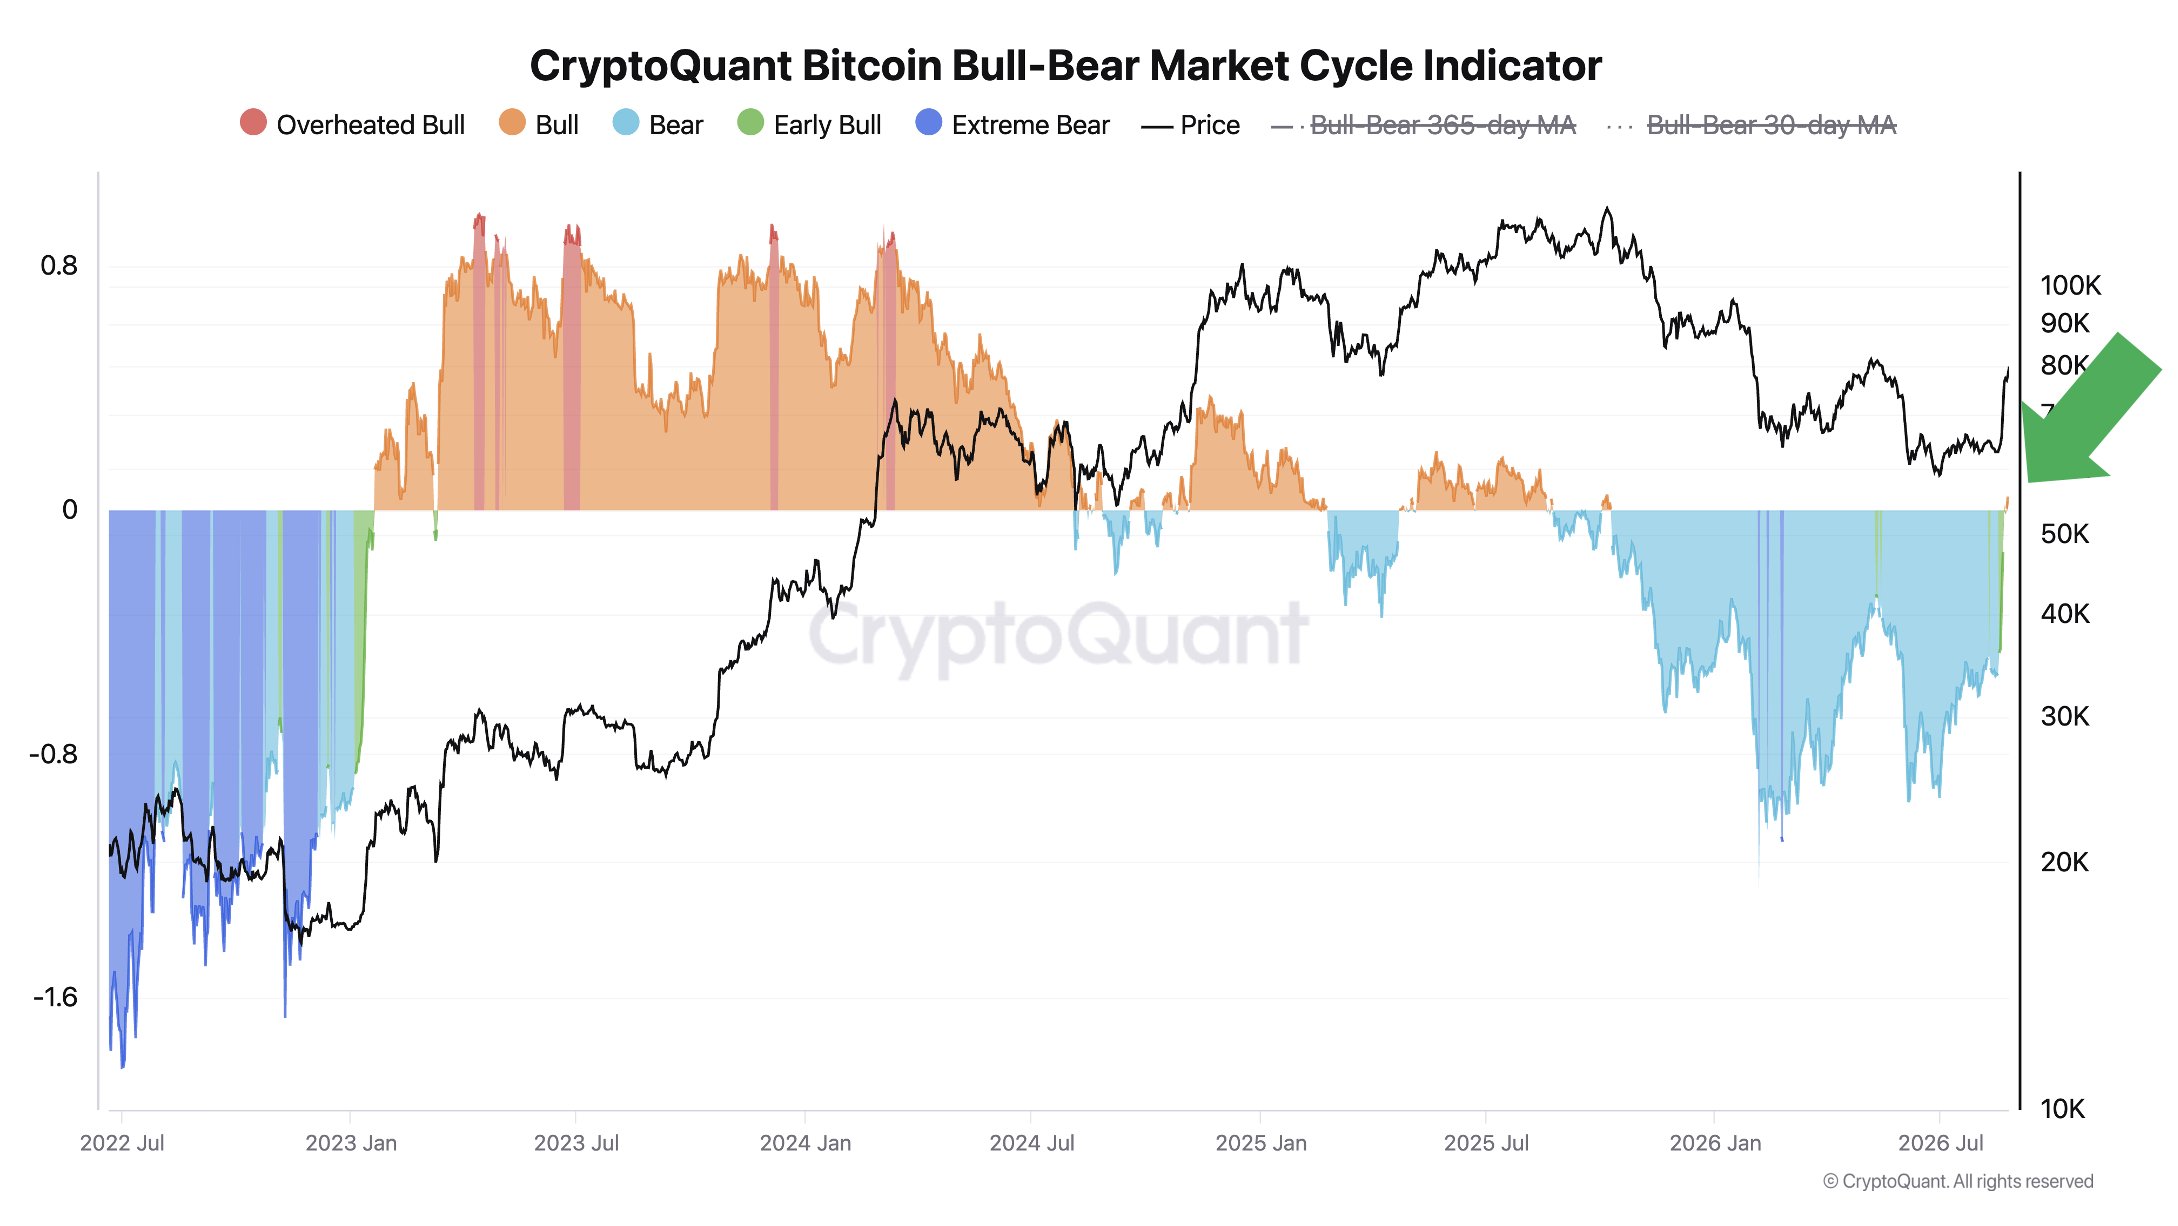
The current chart shows Bitcoin’s regime classification transitioning out of the prolonged blue “Bear” zone and moving toward the green “Early Bull” territory — the same directional shift that, when it occurred in January 2023, correctly identified the beginning of the cycle that eventually carried Bitcoin to its all-time high above $146,000.
The January 2023 precedent is the most directly relevant historical comparison: a market that had been in a deeply negative regime, producing a Bear zone classification, transitioned to Early Bull — and the subsequent bull phase produced one of the largest BTC advances in its history. As covered in our Bitcoin records highest demand of 2026 and 12-month RSI reset analysis and Bitcoin 1,130-day SMA reclaim breakdown, the on-chain and technical signals building through August 2026 have been pointing toward exactly this type of regime transition — and the CryptoQuant Bull-Bear Indicator is now formally confirming it.
Bull Score Surges From 30 to 80
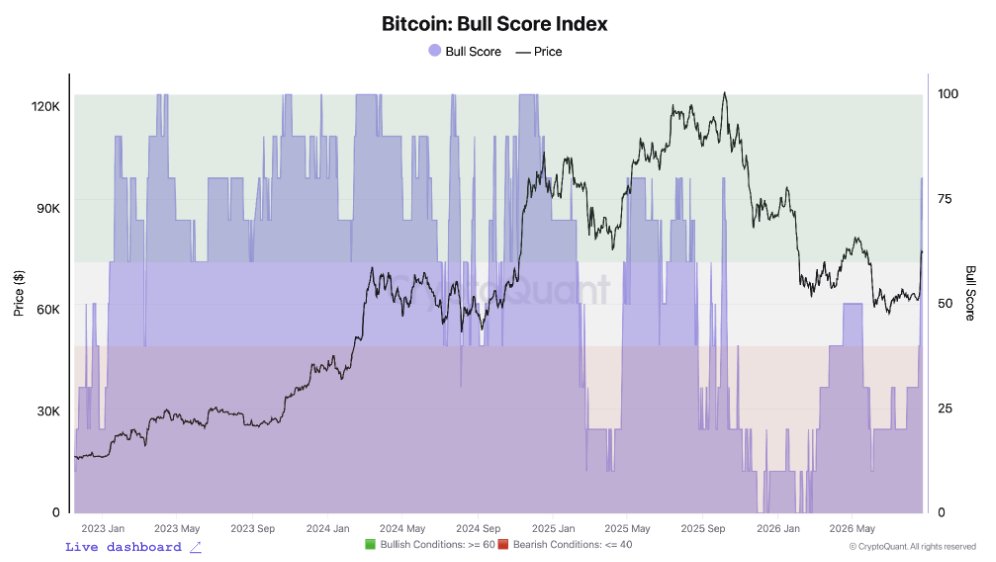
The second and more quantitatively specific signal comes from CryptoQuant’s Bull Score Index — a composite reading that aggregates ten underlying on-chain indicators into a single 0–100 score reflecting Bitcoin’s market regime strength.
CryptoQuant’s official account framed the development directly:
“Bitcoin just entered a new bull market. Bull Score: 30 → 80 in a week, the fastest flip in a year. $83K is the only thing left standing in the way.”
What the Bull Score Measures
The Bull Score Index aggregates ten independent on-chain signals — each measuring a different dimension of Bitcoin’s market condition — into a composite reading. A score of 0–30 is characteristic of bear market conditions. A score of 70–100 is characteristic of bull market conditions. Movement between those zones reflects regime transitions.
A jump from 30 to 80 in seven days means the composite crossed from the lower bear range to the upper bull range in a single week — the most rapid regime reclassification the index has produced in the past year.
The Underlying Signal Breakdown
| Signal Category | Current Status |
|---|---|
| Underlying Indicators Bullish | 8 of 10 |
| Apparent Spot Demand Growth | Fastest monthly pace since December 2025 |
| Spot and Futures Demand | Expanding together for first time since October 2025 |
| Highest Bull Score Since | October 2025 (BTC ~$124,000) |
8 of 10 underlying indicators now flashing bullish is the most critical data point within the Bull Score. A composite score can be elevated by a few strong signals — but 8-of-10 indicator agreement represents a near-consensus across the full measurement framework, with only two indicators still registering non-bullish conditions.
Apparent spot demand growing at its fastest monthly pace since late December confirms that the demand improvement flagged in our Bitcoin spot demand flashing bullish reversal analysis has now accelerated beyond the initial positive flip into the strongest monthly growth pace in approximately eight months.
Spot and futures demand expanding together for the first time since October 2025 is the most structurally significant of the underlying signals. As documented in our Bitcoin futures demand vs spot demand CryptoQuant heatmap analysis, the persistent absence of aligned spot and futures demand expansion was the primary structural weakness in Bitcoin’s demand framework throughout the corrective phase. Its resolution — both expanding together — removes the most significant demand-side objection to the bull market thesis.
Highest Bull Score since October 2025 — when Bitcoin was trading near $124,000 — provides the calibration for what this reading means in absolute terms. The Bull Score of 80 is not a weakly bullish reading sitting marginally above neutral — it is a strongly bullish reading that matches the level last seen when Bitcoin was at a price approximately 57% above the current level. The implication is not that Bitcoin will immediately return to $124,000 — it is that the demand structure and on-chain regime are as constructive now as they were at that price level.
$83,000 — The One Level That Remains
Despite the strength and clarity of both CryptoQuant signals, the firm is explicit about the single remaining confirmation threshold: a sustained weekly close above the 365-day moving average, currently near $83,000.
This is not a hedging caveat — it is a specific and testable condition that distinguishes a confirmed bull market from an early bull transition that requires further validation. The 365-day MA is one of the most widely watched long-term trend indicators in Bitcoin analysis — it represents the average price across a full calendar year of trading, and its relationship to spot price has historically been among the most reliable regime indicators.
At the current price of $79,011, Bitcoin sits approximately $4,000 — or roughly +5% — below the $83,000 confirmation threshold. The weekly surge from $62,700 has brought the price within striking distance of this level. Whether the current momentum is sufficient to produce a sustained weekly close above $83,000 — rather than a brief touch followed by rejection — is the specific question the next weekly candle will begin to answer.
As covered in our Bitcoin reclaims 1,130-day SMA after 80 days below analysis, the technical structure is now aligned with the on-chain regime signals — the 1,130-day SMA reclaim and the CryptoQuant Bull Score flip are independently confirming the same macro conclusion from different analytical frameworks.
Why This Is Different From Previous False Bull Starts
Bitcoin has produced brief periods of bullish sentiment during the 2026 corrective phase that ultimately did not sustain — making it reasonable to ask what distinguishes the current signal from those prior episodes.
Genuine demand, not just short-covering: The August 19 short squeeze ($2.74 billion in liquidations) contributed to the initial price surge — but the CryptoQuant Bull Score reflects on-chain spot demand data, not derivatives positioning. Spot demand growing at its fastest monthly pace since December independently confirms that real Bitcoin accumulation is occurring, not just leveraged short covering.
Multi-indicator alignment: The Bull Score reached 80 with 8-of-10 underlying indicators bullish. Prior episodes of temporary bullish sentiment in 2026 did not produce this level of broad indicator agreement — they typically reflected 4-5 bullish signals with significant structural weaknesses remaining in the broader framework.
Both spot and futures expanding together: The previous pattern in 2026 was futures expansion without spot support — a fragile structure that repeatedly failed to sustain rallies. The current environment has both expanding simultaneously for the first time since October 2025 — the structural condition that prior failed rallies lacked.
Institutional demand confirmed: As covered in our Bitcoin nears major accumulation levels analysis, the broader institutional demand framework has been building through August — ETF inflows, whale accumulation, and now the fastest spot demand growth in eight months are all aligned simultaneously.
Bullish vs. Bearish Scenarios
Bullish Scenario
Bitcoin sustains its momentum and posts a weekly close above $83,000 — the 365-day moving average — fully confirming the bull market transition that the CryptoQuant indicators are signaling. The Bull Score continues to hold above 70 as the 2 remaining non-bullish underlying indicators rotate positive. Spot demand sustains at elevated monthly growth rates, providing the organic buying pressure that distinguishes a genuine bull market from a technical bounce. In this scenario, the January 2023 precedent — where the same regime transition preceded Bitcoin’s most powerful bull cycle — becomes the primary historical template for the trajectory ahead.
Bearish Scenario
Bitcoin fails to sustain above $83,000 on a weekly close basis — encountering significant selling pressure at the 365-day MA and producing a rejection that sends price back toward the $74,000–$76,000 range. The Bull Score pulls back from 80 as some of the 8 bullish indicators revert — reducing the composite reading toward the 50–60 transition zone. In this scenario, the regime transition signal remains valid but the confirmation threshold is not cleared, requiring a further consolidation period before the $83,000 level can be decisively breached.
Bottom Line
CryptoQuant has delivered the most direct and data-backed bull market declaration of the current cycle: Ki Young Ju stating “The Bitcoin bear cycle is over” backed by the Bull-Bear Market Cycle Indicator transitioning to Early Bull, and the Bull Score jumping 30 to 80 in a single week — the fastest regime flip in a year — with 8-of-10 underlying indicators bullish and spot demand at its highest monthly growth pace since December 2025.
Bitcoin at $79,011 is +5% away from the sole remaining confirmation threshold — a sustained weekly close above the 365-day moving average at $83,000. The on-chain regime has already transitioned. The technical confirmation is the next step. The combination of both would represent the most comprehensively validated bull market signal Bitcoin has produced in this cycle.
Frequently Asked Questions
Has Bitcoin entered a new bull market in 2026?
According to CryptoQuant, Bitcoin has entered the early phase of a new bull market after its Bull Score jumped from 30 to 80 in one week.
What is CryptoQuant’s Bitcoin Bull Score?
The Bull Score is a composite on-chain indicator that measures market conditions. A reading of 60 or higher signals bullish conditions, while below 40 indicates bearish conditions.
Why did CryptoQuant say the Bitcoin bear cycle is over?
CryptoQuant founder Ki Young Ju stated the bear cycle is over after the Bull-Bear Market Cycle Indicator flipped and the Bull Score surged to 80 — the fastest flip in a year.
What is the key level Bitcoin needs to confirm a new bull market?
CryptoQuant says a sustained weekly close above the 365-day moving average near $83,000 is required for full confirmation of the new bull market.
The opinions and market insights shared on CoinsProbe represent the views of individual authors based on prevailing market conditions at the time of publication. Cryptocurrency investments carry significant risk and volatility. Readers are encouraged to conduct their own research and seek professional financial advice before making investment decisions. CoinsProbe and its contributors do not accept responsibility for financial losses or decisions made based on published content.
CoinsProbe may publish sponsored articles, affiliate links, or promotional collaborations. All sponsored material is clearly labeled to maintain transparency with our audience. Our editorial decisions remain fully independent, and advertising partnerships do not influence reviews, rankings, or published opinions.
Since 2023, CoinsProbe has delivered reliable insights on cryptocurrency, blockchain, and digital assets. Our content is created by experienced researchers and analysts who follow strict editorial standards focused on accuracy, transparency, and credibility. Every article is carefully reviewed and verified using trusted sources and current market data. We provide unbiased analysis and timely updates covering everything from emerging crypto projects to major industry developments.