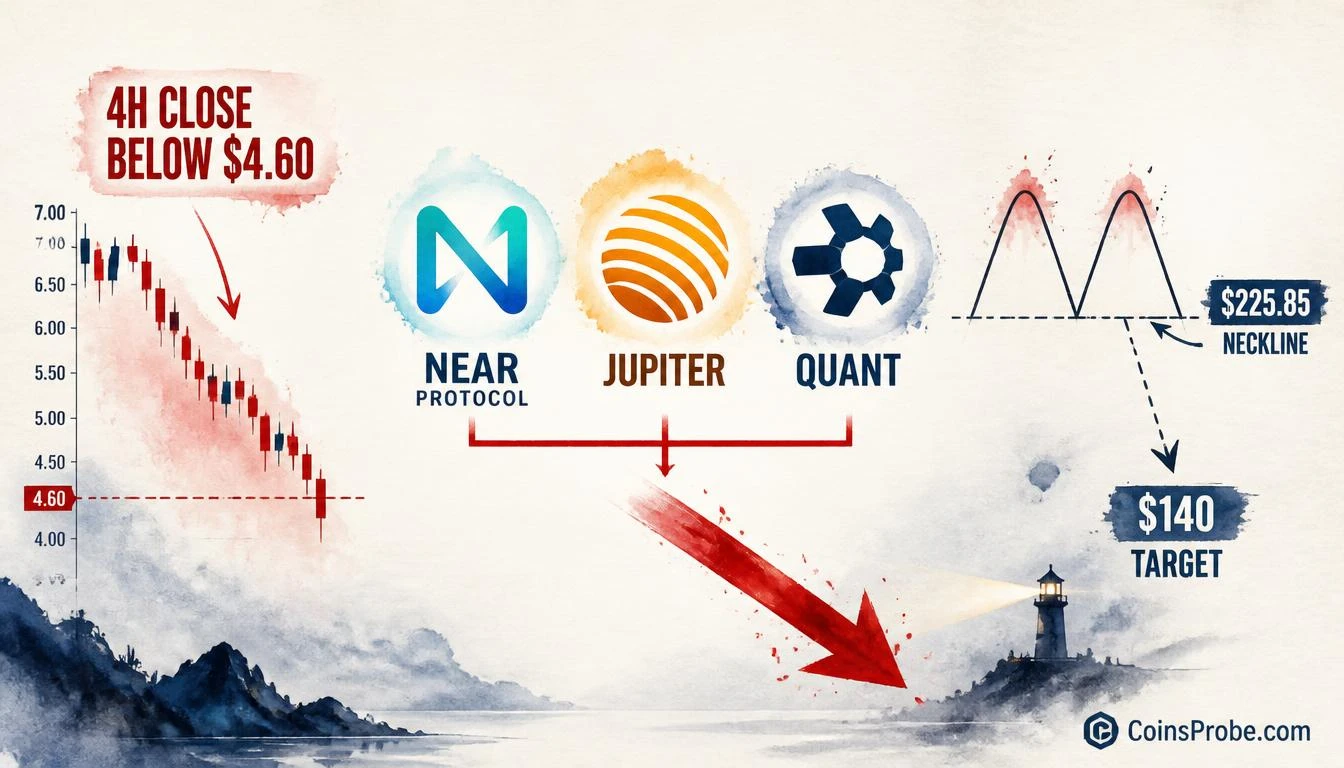
- NEAR is trading at $4.70 — down 12.52% in 24h — with analyst @alicharts flagging $4.60 as the 4-hour breakdown trigger
- Crypto market cap fell from $2.93T to $2.69T in four days — an 8% decline creating breakdown pressure across altcoins
- JUP breakdown trigger: 4-hour close below $0.31 targets $0.28 then $0.25; QNT neckline at $225.85 targets $140 on confirmed break
NEAR Protocol is trading at $4.70 — down 12.52% in the past 24 hours and 5.23% over the past week, even as it sits on a stunning 104.77% 30-day gain. The broader crypto market has provided the context: total market capitalization fell from $2.93 trillion to $2.69 trillion in just four days — an 8% drawdown that is now testing the structural integrity of several altcoin positions.
Crypto analyst Ali Martinez (@alicharts) published a five-part thread on October 9 identifying three specific assets — NEAR Protocol ($NEAR), Jupiter ($JUP), and Quant ($QNT) — as sitting at critical 4-hour breakdown thresholds. The framework is precise: each asset has a defined level, and a 4-hour close below it shifts the structure from consolidation to confirmed breakdown. All three levels, the targets below them, and the current price action are detailed below.
Signal 1 — NEAR Protocol: $4.60 Is the Line
Despite its extraordinary 30-day performance, NEAR has entered a sharp correction. At $4.70, it is sitting less than 2% above the boundary Martinez identifies as the critical structural floor. According to the analyst’s thread, NEAR has held inside its channel during the broader market selloff — but that containment is now being tested. A 4-hour candle closing below $4.60 is the trigger. The chart shared by @alicharts shows a defined ranging channel with price oscillating between clear upper and lower boundaries across late September into early October. The most recent candles reflect a sharp vertical drop toward the lower boundary, with a downward wick extending significantly below the range floor. An upward arrow is placed near $3.70 on the chart — the level Martinez flags as the next logical destination if $4.60 fails to hold.
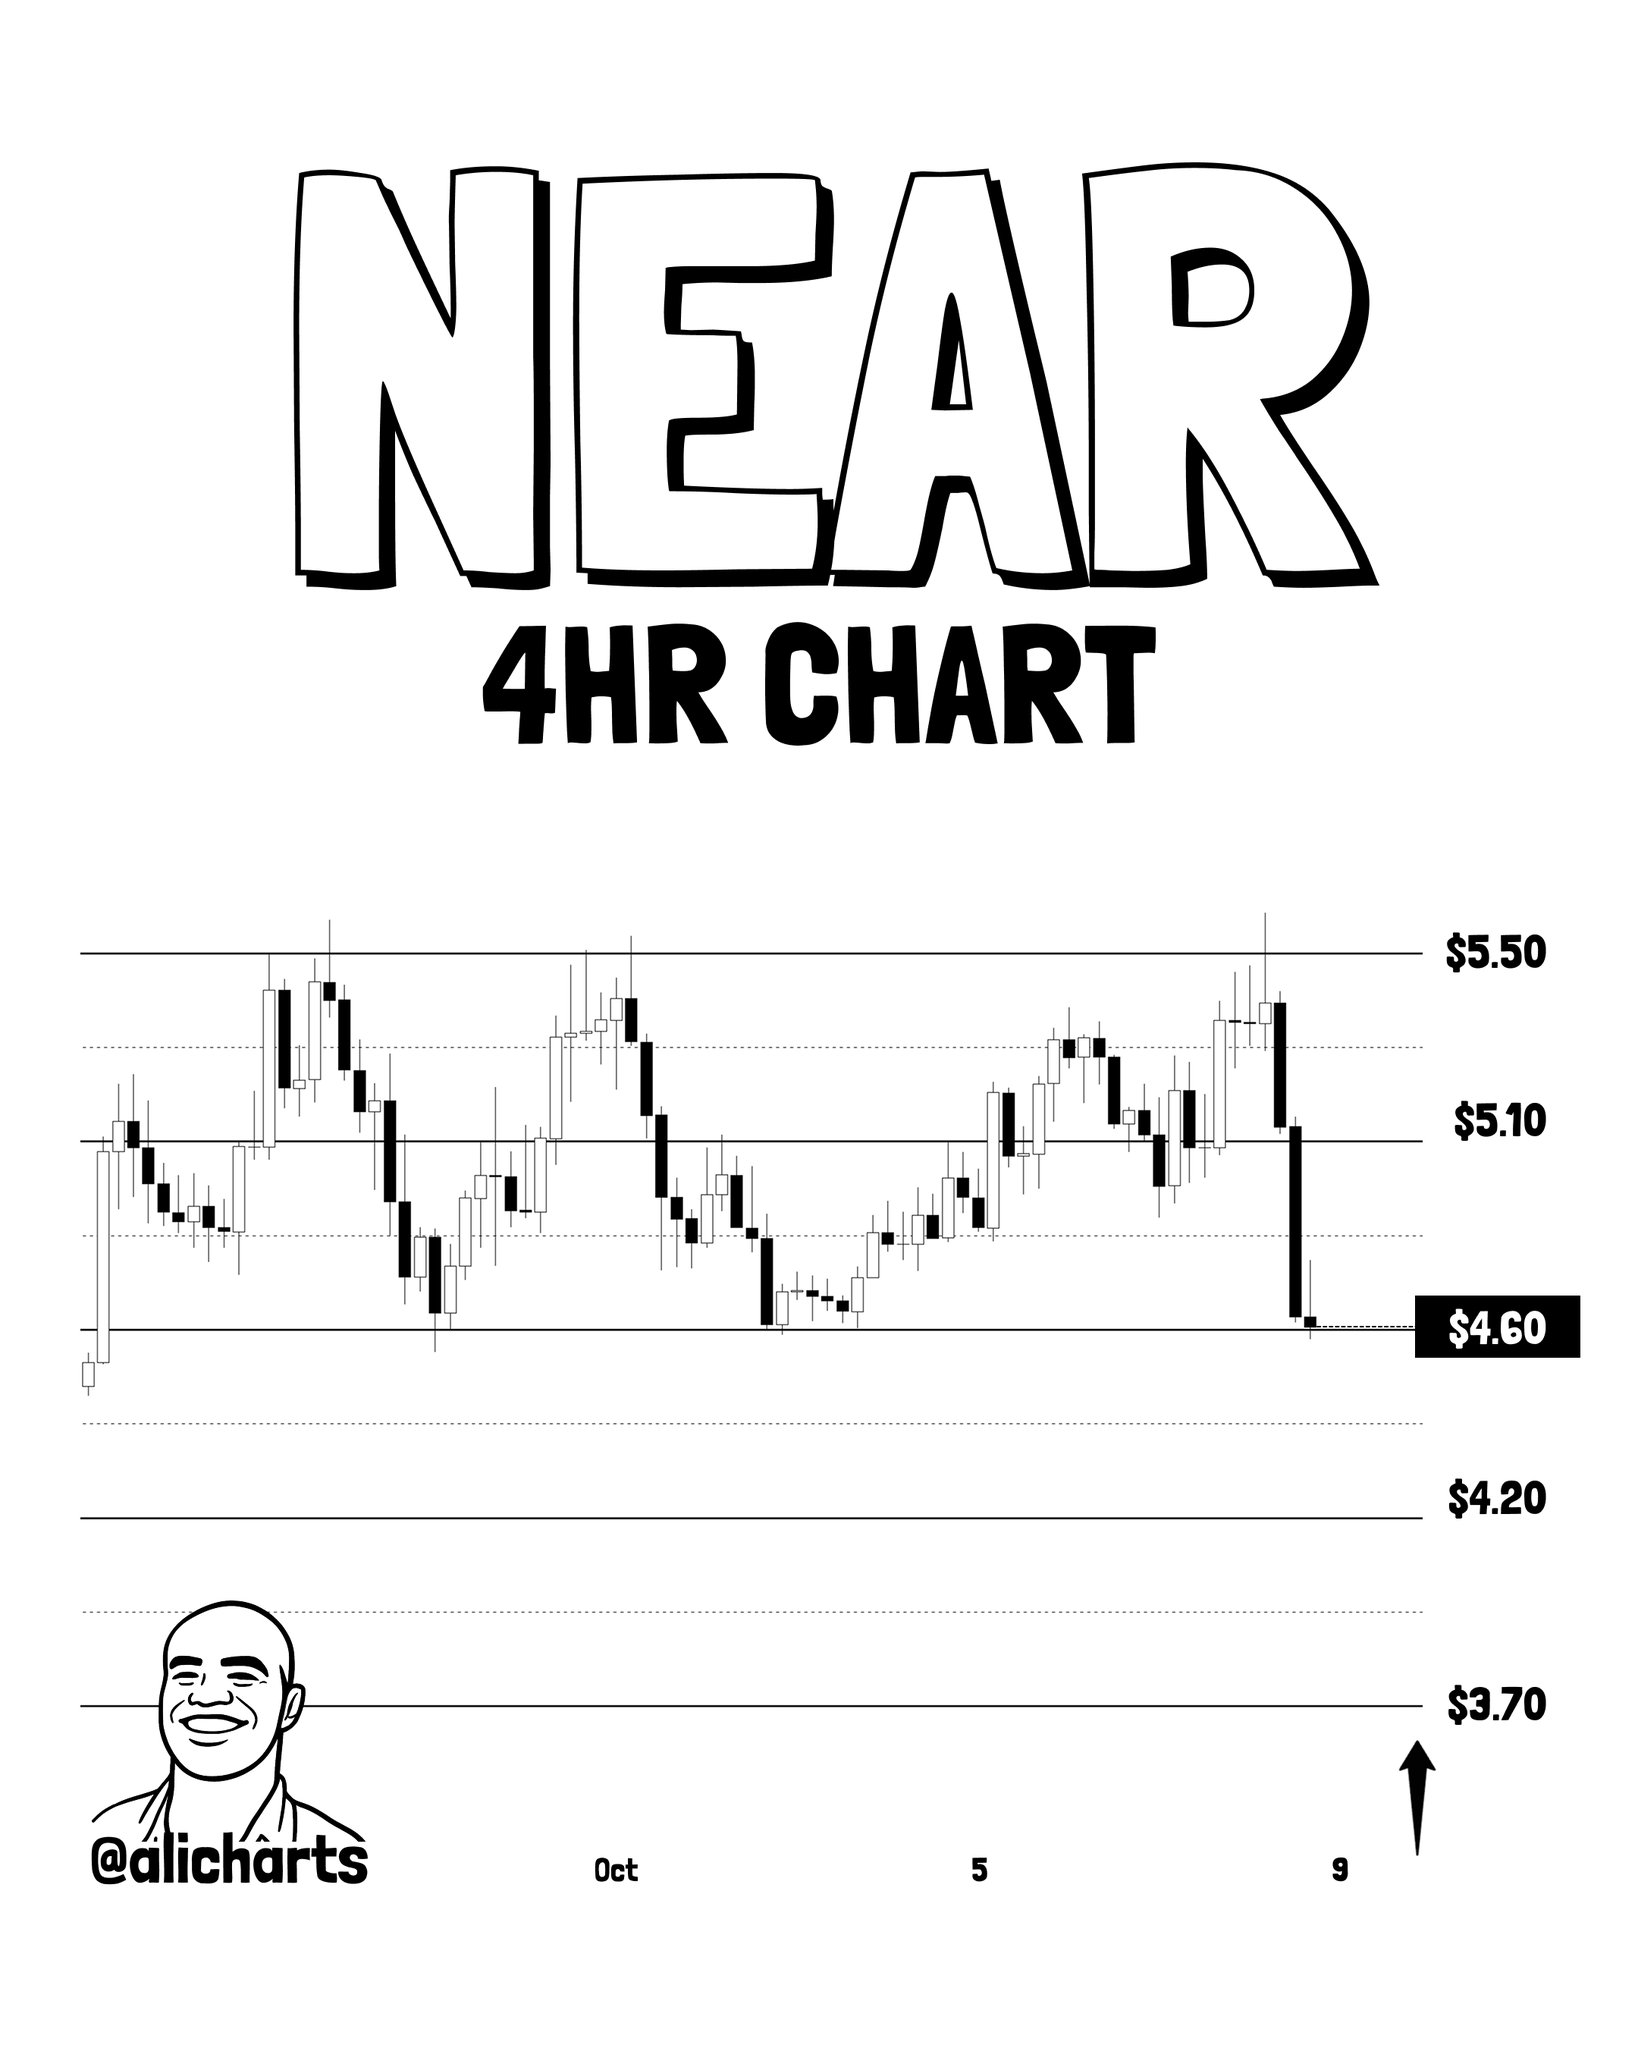
The cascade from the analyst’s note is sequential: a confirmed 4-hour close below $4.60 brings $4.20 into focus first, with $3.70 as the deeper target if $4.20 also fails to provide support. Given that NEAR is currently at $4.70, the distance to the trigger is narrow. The market cap stands at $6.15 billion — making any breakdown at this level a structurally significant event for the NEAR ecosystem, which has been one of the stronger performers over the past month. For context on how concentrated supply dynamics can amplify moves at critical levels, Bitcoin’s Effective Supply Is Far Smaller Than Markets Assume explores how supply mechanics interact with price floors.
Signal 2 — Jupiter ($JUP): $0.31 Support Under Pressure
Jupiter rallied sharply toward $0.39 before momentum reversed. Martinez is now watching $0.31 as the critical 4-hour support level. The 4-hour chart shows a sharp rally to the upper horizontal resistance area near $0.38, followed by a steep rejection and reversal. Price has fallen into a mid-range zone, with the structure now sitting above $0.31 but with visible selling pressure. The analyst notes that JUP is “losing momentum” after its run toward $0.39 — the chart’s horizontal line system marks $0.38 as resistance, $0.35 as an intermediate level, $0.31 as the key support, $0.28 as the next tier, and $0.25 as the lower boundary where an upward arrow suggests a potential stabilization zone.
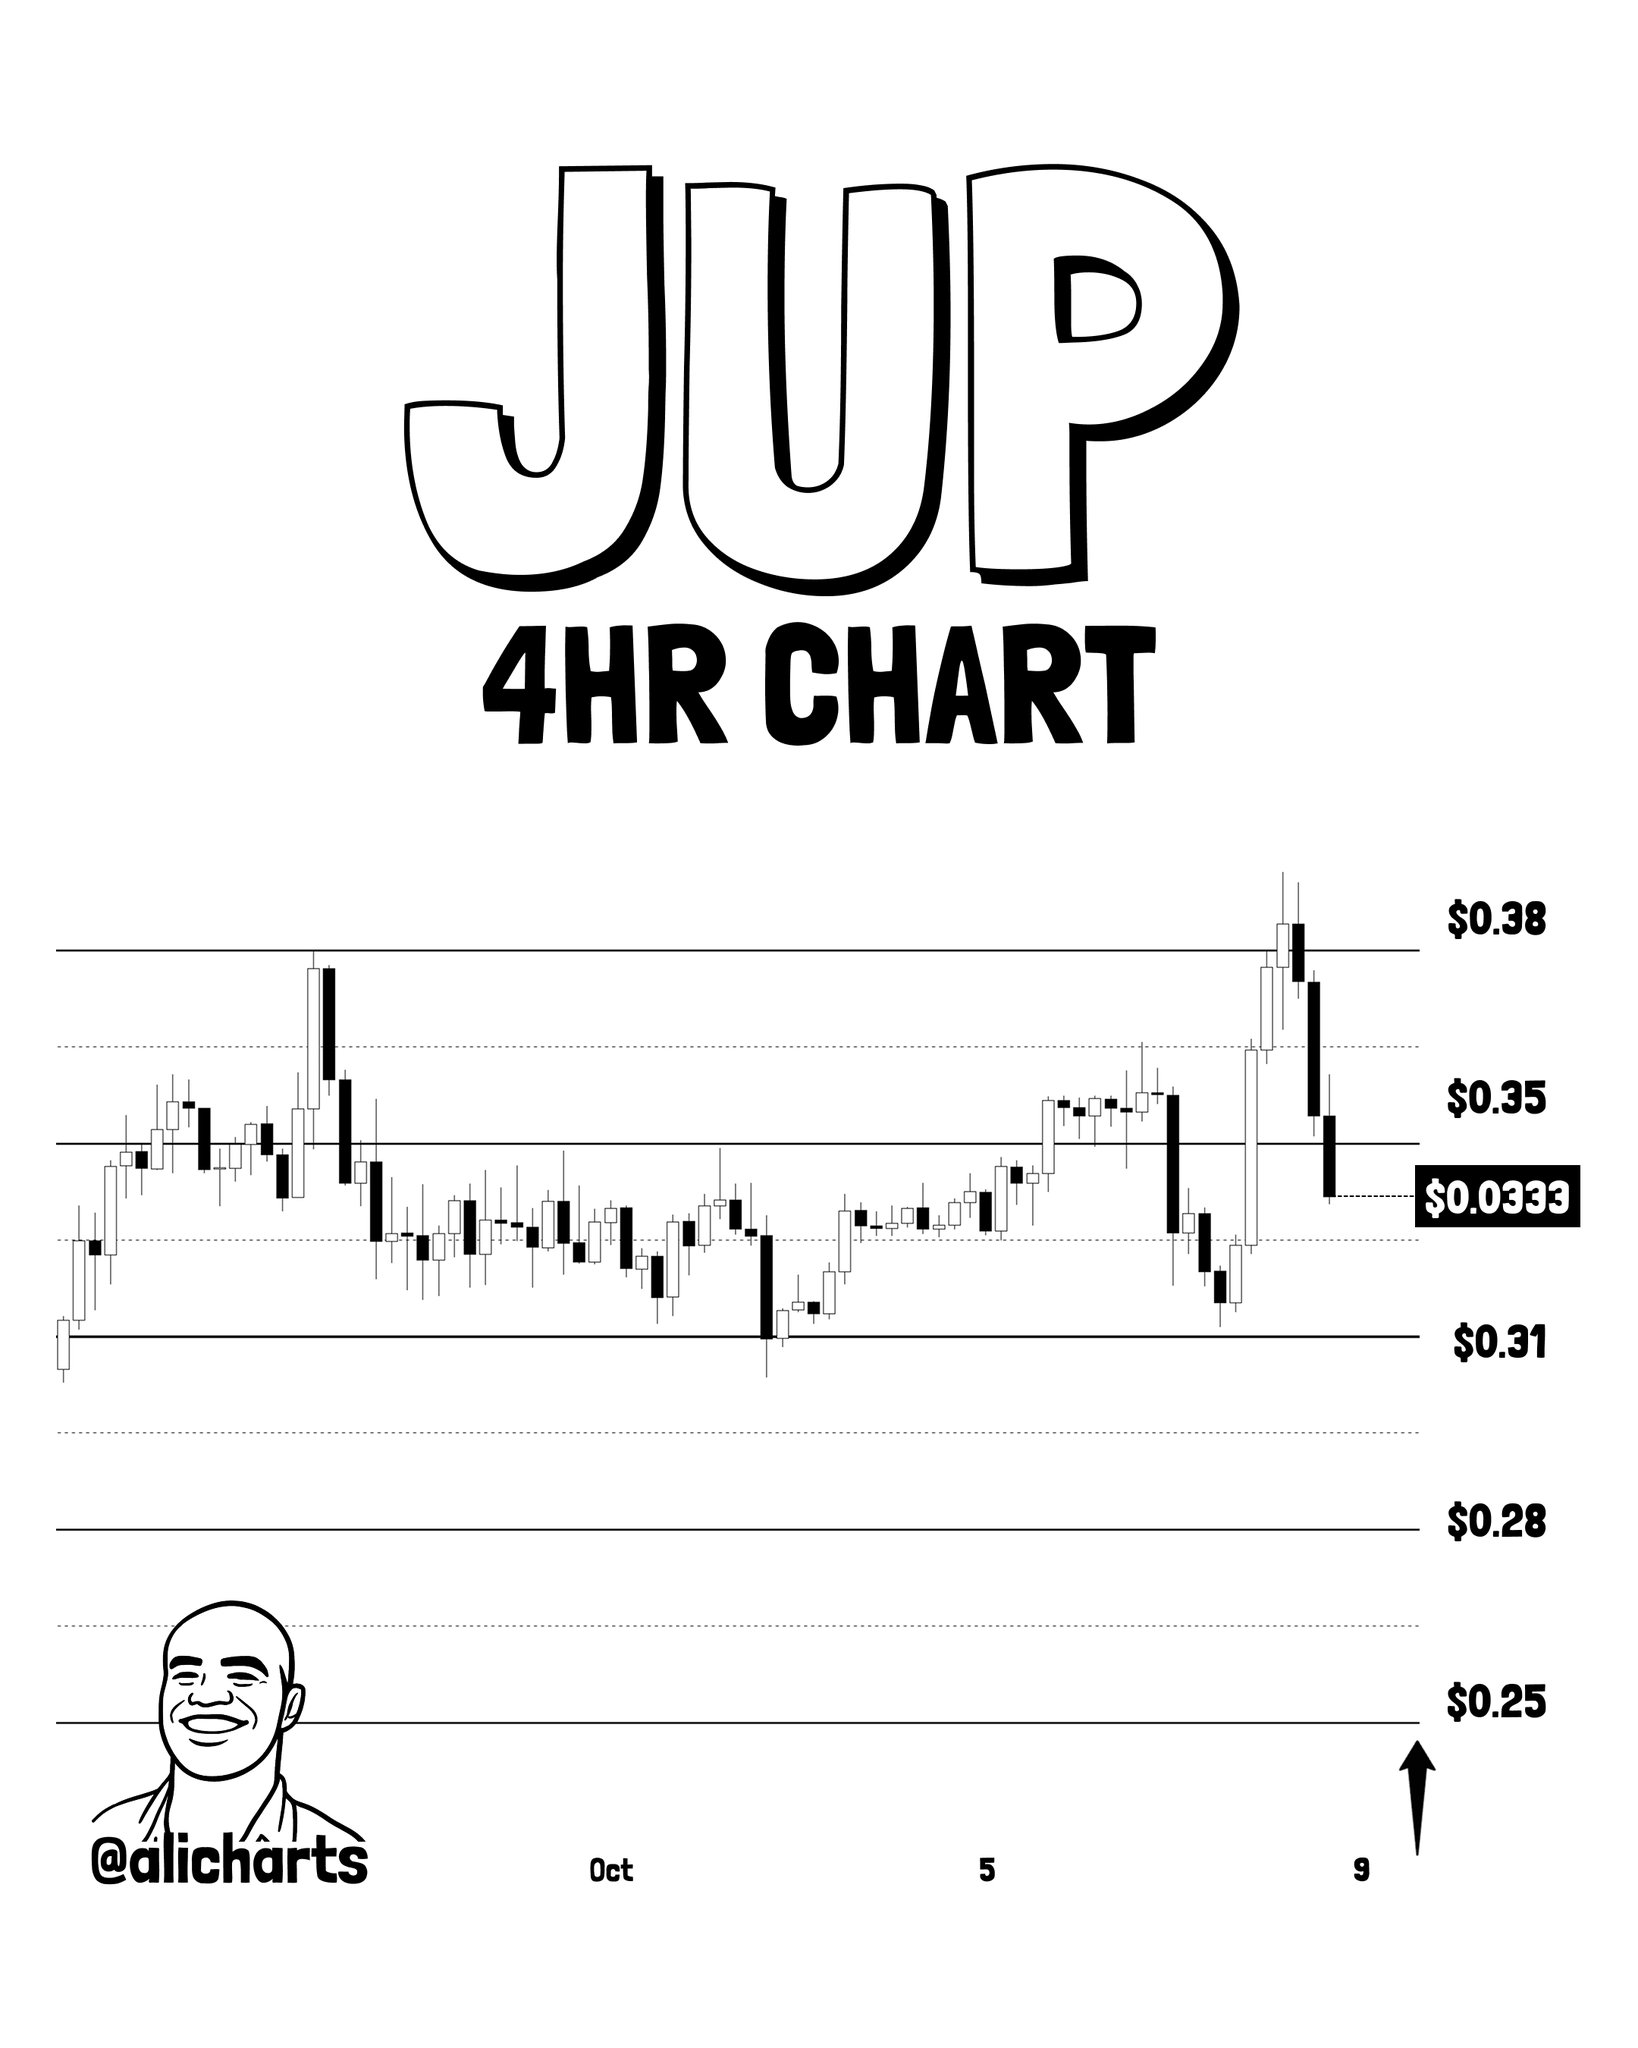
A 4-hour close below $0.31 is Martinez’s stated trigger for deeper downside on JUP. The sequence implied by the chart levels — $0.31 breaks → $0.28 in view → $0.25 as extended target — mirrors the cascading structure he identified for NEAR. The current price of JUP per the chart context places it in a precarious mid-range position where the next directional close will determine whether the $0.31 level holds or becomes resistance on any recovery attempt.
Signal 3 — Quant ($QNT): Adam-and-Eve Double Top at $225.85
The third setup Martinez flags is the most structurally defined. Quant’s 4-hour chart shows a pattern the analyst identifies as an inverse Adam-and-Eve formation — a sharp peak (Adam) followed by a rounder, lower dome (Eve) — consistent with a double-top distribution structure. The neckline of this formation sits at $225.85, the horizontal level currently acting as the key price boundary. The chart prints price labels at $320, $280, $240, $225.85, $180, and $140, providing a full map of the relevant zones.
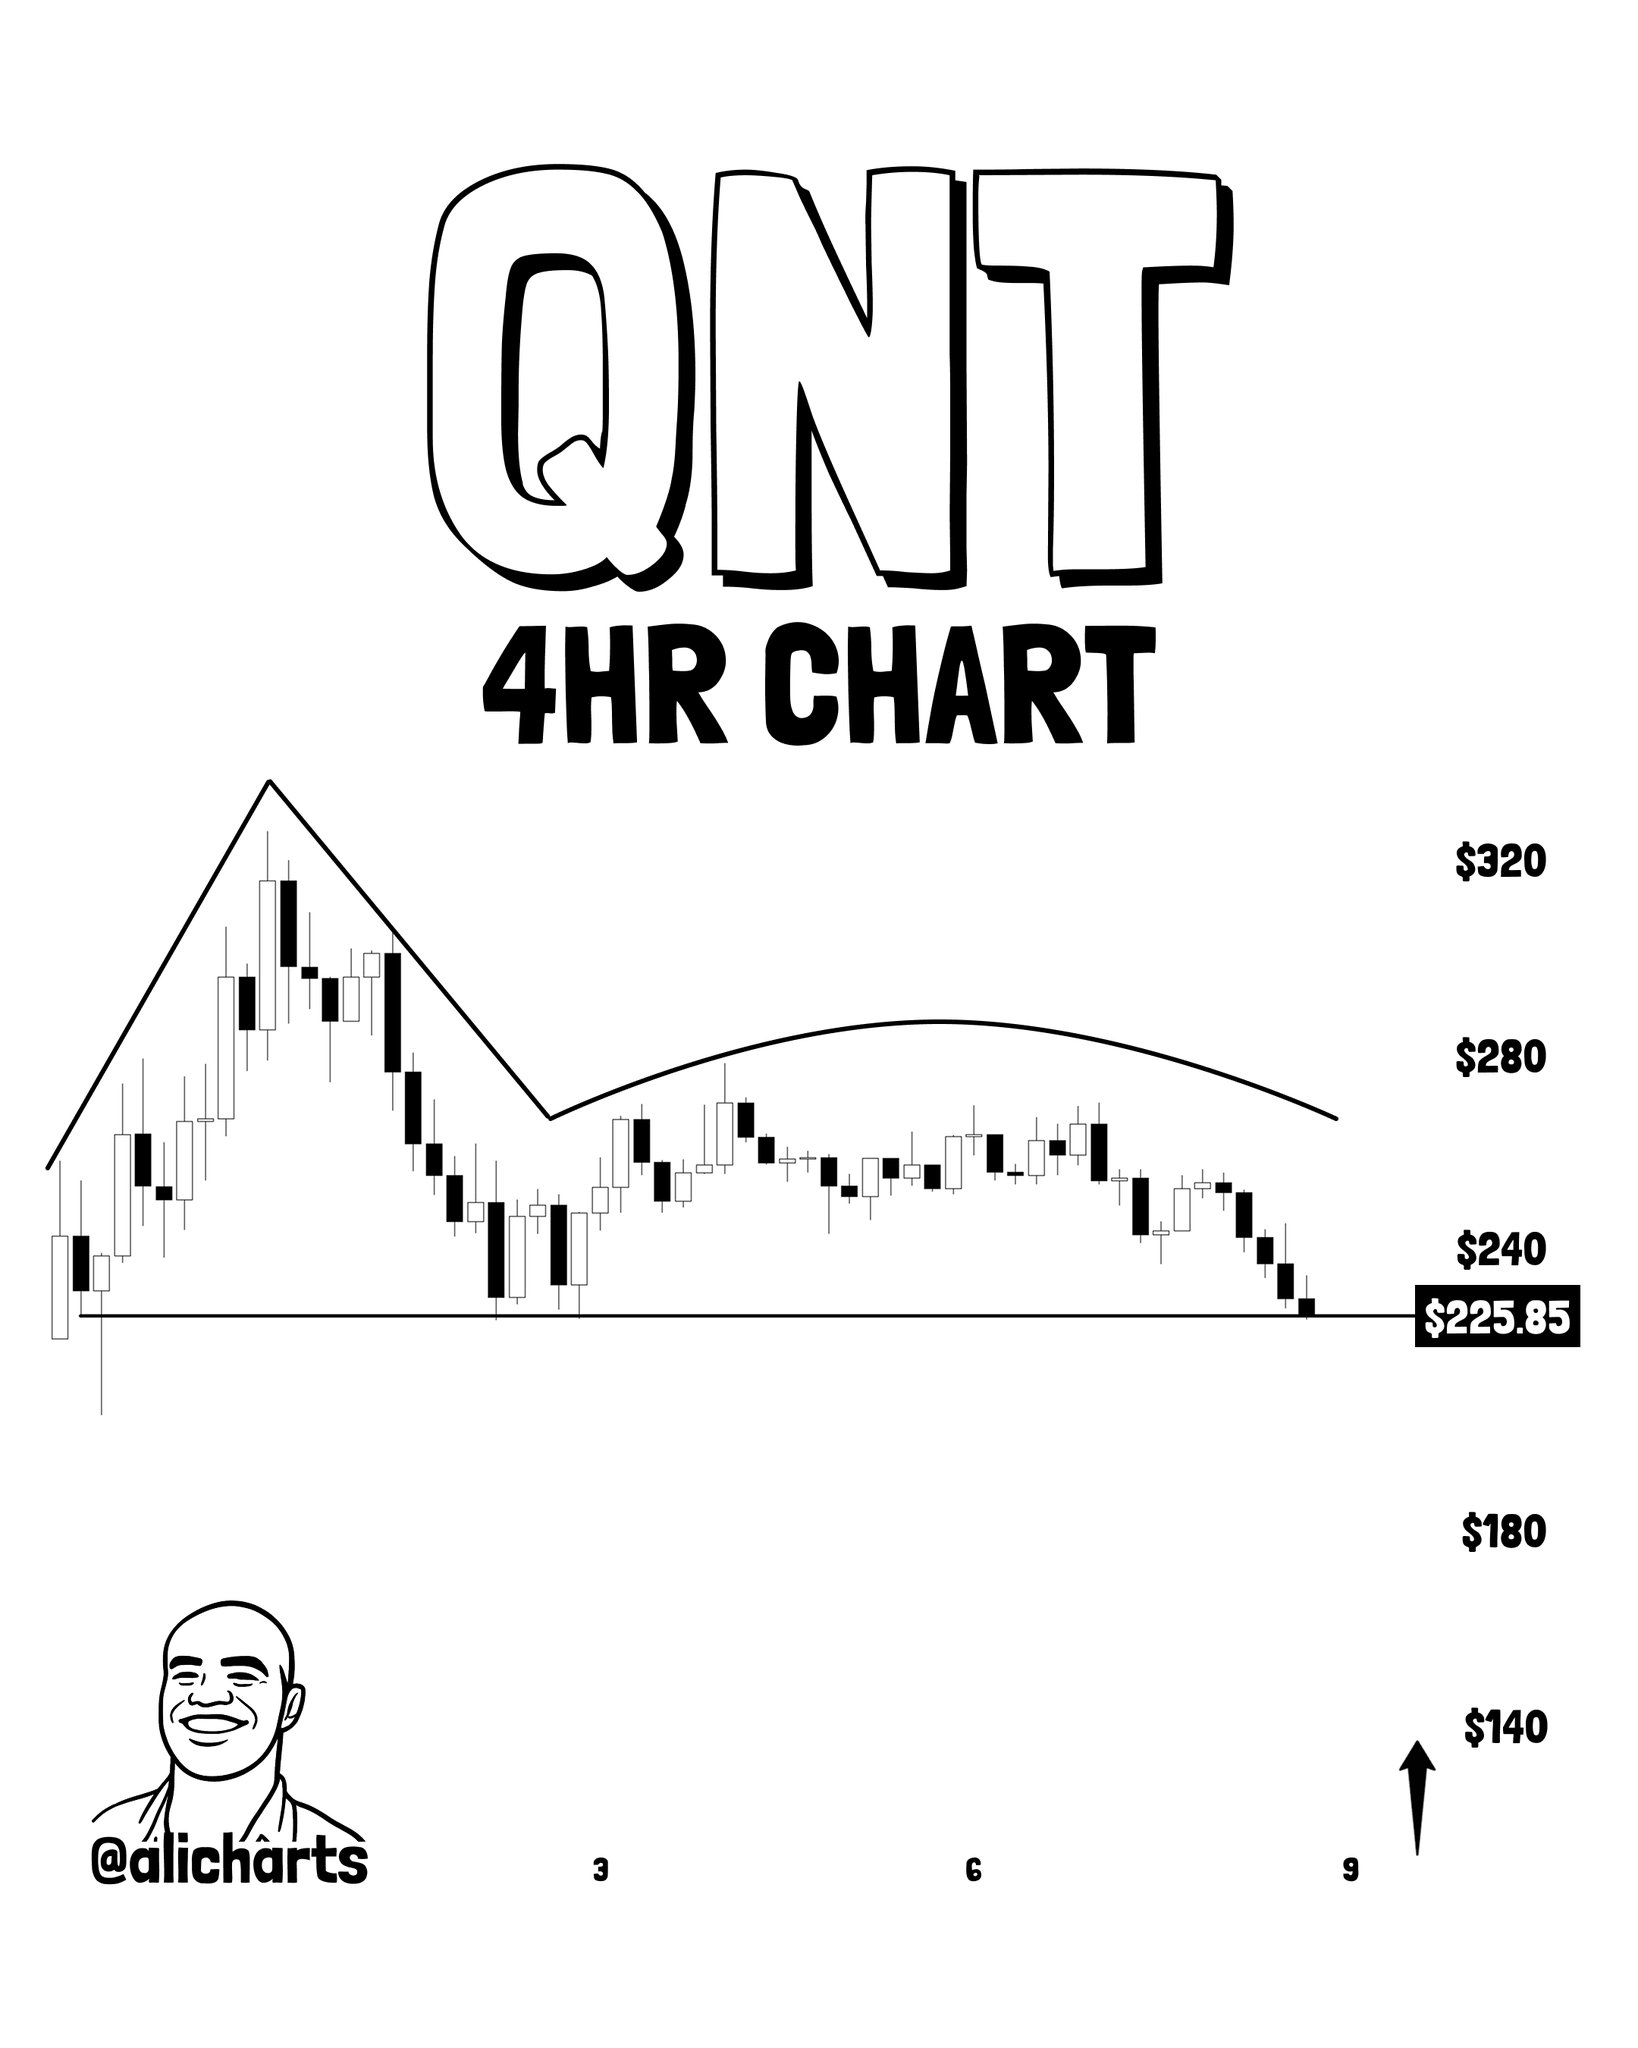
Martinez places a downward arrow beyond the current price on the timeline pointing toward $140 — identifying it explicitly as a forward target, not a historical reference level. The signal is unambiguous: a 4-hour close below $225.85 would confirm the Adam-and-Eve breakdown and open the path toward $140. That represents a move of approximately 38% below the neckline. The $225.85 level is where the thesis either holds or breaks — it is not a soft zone but the exact neckline the pattern requires to complete. Broader market dynamics, including Bitcoin spot demand weakening, are adding macro pressure to altcoin structures like QNT’s at precisely this juncture.
The Market Context Behind All Three Signals
These three setups are not isolated. Martinez frames them within a four-day, 8% decline in total crypto market cap — from $2.93 trillion to $2.69 trillion. That scale of market-wide selling creates the conditions where assets holding near support levels are most vulnerable to a final confirmation break. When broad liquidity contracts, the assets sitting closest to their structural thresholds are the ones that break first and fastest.
All three assets — NEAR, JUP, and QNT — share the same structural vulnerability at this moment: they each have a defined 4-hour level, a named analyst watching it, and a specific cascading target sequence if that level fails. The setups are not predictions of breakdown — they are pre-defined conditions. The market close, not the analyst, will confirm or deny each one. For an understanding of how miner behavior during broad market drawdowns can signal macro inflection points, Bitcoin Miners Have Stopped Selling provides relevant structural context.
Bullish Scenario
NEAR holds $4.60 on a 4-hour closing basis and recovers above $5.10, invalidating the breakdown signal and keeping the 30-day uptrend structure intact. JUP reclaims $0.35 and closes above $0.38 resistance on the 4-hour chart. QNT defends $225.85 and prints a confirmed reversal candle at the neckline, negating the Adam-and-Eve pattern.
Bearish Scenario
A 4-hour close below $4.60 on NEAR opens $4.20 then $3.70. JUP losing $0.31 on a 4-hour close targets $0.28 then $0.25. QNT breaking $225.85 on a confirmed 4-hour close activates the measured move toward $140 — a 38% downside from the neckline per Martinez’s chart annotation.
Three assets, three thresholds, one four-day market selloff providing the pressure. Martinez’s framework gives traders a clear binary at each level: $4.60 for NEAR, $0.31 for JUP, and $225.85 for QNT. A 4-hour close is the confirmation method in each case — not an intraday touch, not a wick, a close. Watch $4.60 on NEAR as the most immediate trigger given that NEAR is currently trading at $4.70 with a 12.52% single-day decline already in progress.
Frequently Asked Questions
What happens to NEAR if it closes below $4.60 on the 4-hour chart?
What is the Adam-and-Eve pattern Martinez flagged on QNT, and what does it project?
Why are NEAR, JUP, and QNT being flagged at the same time?
What is the key level for Jupiter (JUP) that traders should watch?
Source: Ali Charts · Published by CoinsProbe Markets Desk
The opinions and market insights shared on CoinsProbe represent the views of individual authors based on prevailing market conditions at the time of publication. Cryptocurrency investments carry significant risk and volatility. Readers are encouraged to conduct their own research and seek professional financial advice before making investment decisions. CoinsProbe and its contributors do not accept responsibility for financial losses or decisions made based on published content.
CoinsProbe may publish sponsored articles, affiliate links, or promotional collaborations. All sponsored material is clearly labeled to maintain transparency with our audience. Our editorial decisions remain fully independent, and advertising partnerships do not influence reviews, rankings, or published opinions.
Since 2023, CoinsProbe has delivered reliable insights on cryptocurrency, blockchain, and digital assets. Our content is created by experienced researchers and analysts who follow strict editorial standards focused on accuracy, transparency, and credibility. Every article is carefully reviewed and verified using trusted sources and current market data. We provide unbiased analysis and timely updates covering everything from emerging crypto projects to major industry developments.