
- Bitcoin trades at $82,981 (−1.08% 24h) as apparent spot demand registers net negative across the 30-day rolling window
- CryptoQuant analyst @MAC_D46035 identifies $69K Trader Realized Price band as key conditional support if the bullish cycle remains intact
- Bitcoin ETF holdings rose from 1.2366M BTC to 1.3176M BTC between July and October — the structural counterpoint keeping the cycle thesis credible
- Open interest across all exchanges peaked alongside price near $82.5K–$85K then declined in tandem — signaling leveraged long de-risking, not a short squeeze
Bitcoin is trading at $82,981 — down 1.08% in the past 24 hours — and carrying a market capitalization of approximately $1.67 trillion. Beneath that headline number, two specific on-chain and derivatives metrics have deteriorated in a way that CryptoQuant analyst @MAC_D46035 characterizes as a meaningful corrective signal, not a structural breakdown.
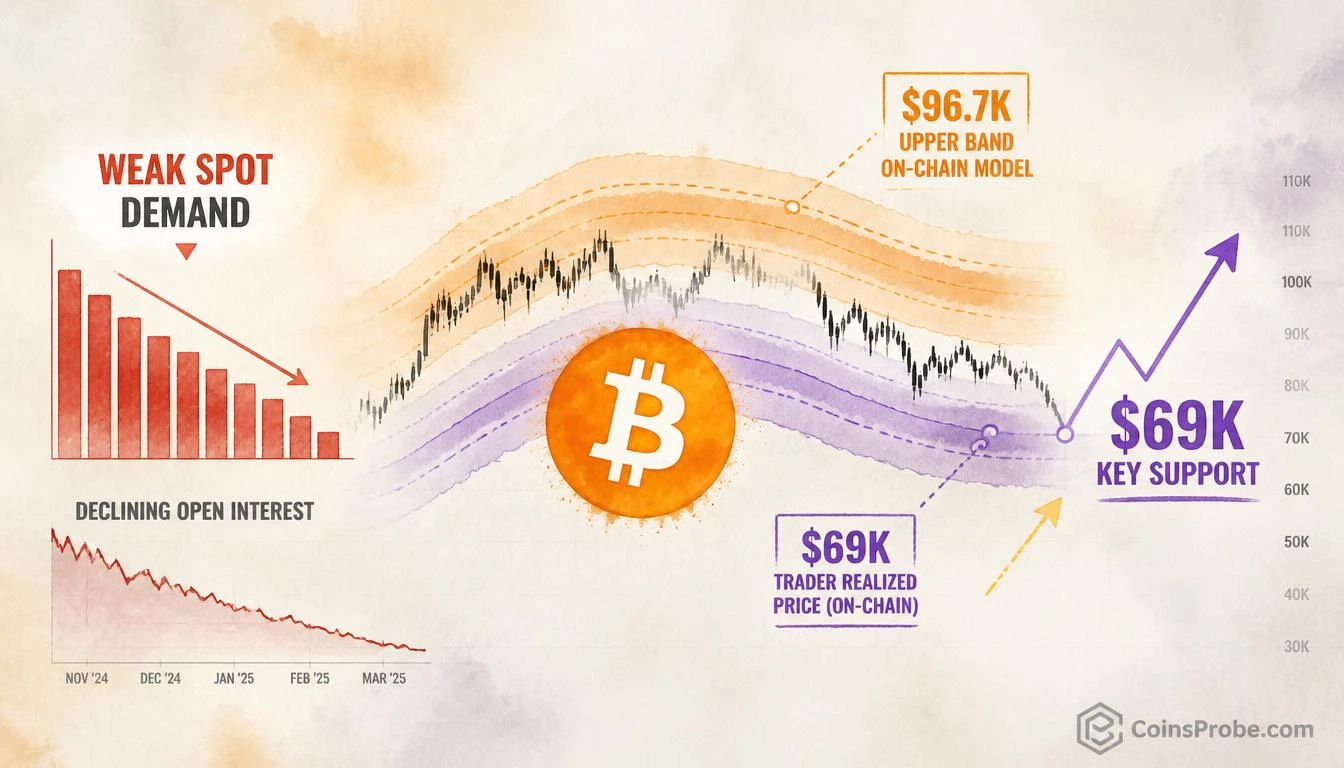
The analyst’s note, published via @cryptoquant_com, identifies two concurrent readings — weakening spot demand and declining open interest — and frames them together with a conditional conclusion: “If the bullish cycle remains intact, this correction could provide a medium- to long-term buying opportunity, while the $69K area is likely to serve as a key support level.” Both conditions and the qualifier must be read together. The $69K level is the target only if the cycle thesis holds — not an unconditional floor.
Signal 1 — Weak Spot Demand: Persistent Negative Apparent Demand
The first metric @MAC_D46035 flags is Bitcoin’s apparent demand, measured on a 30-day rolling window. On the chart covering approximately February through October 2026, the dominant reading is a sustained cluster of red (negative) bars — meaning the market has been in a net demand deficit for the majority of the observed period. A brief cluster of green (positive) bars appeared around late August to early September, coinciding with a partial price recovery, but that positive demand spike failed to sustain. By October, the bars have reverted to negative territory.
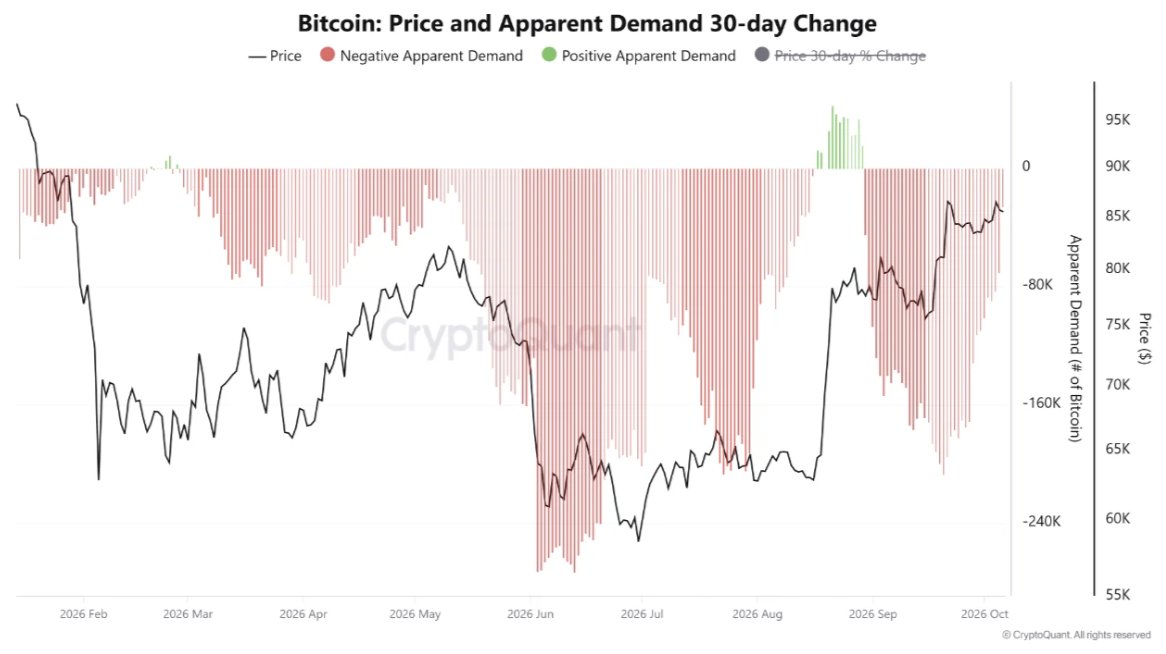
This is a structurally important distinction: price recovered during that window, but the underlying demand reading did not follow. When price rises while apparent demand stays negative or reverts quickly, it signals that the rally lacked the absorption of fresh spot supply needed to confirm genuine accumulation. The analyst’s framing — “weak spot demand” — is precise. This is not a crash signal; it is a conviction signal, or rather, the absence of one. This connects to an earlier structural concern flagged in our piece on Bitcoin Fails to Hold the Active Realized Price, where demand erosion preceded a loss of a critical on-chain cost basis.
Signal 2 — Declining Open Interest Across All Exchanges
The second chart in @MAC_D46035’s note shows aggregated Bitcoin open interest across all exchanges from early August through early October 2024. The pattern is a correlated reversal: both price and open interest climbed sharply through mid-August into late September — with open interest reaching levels between 28B and 30B on the left axis, and price reaching approximately $82.5K–$85K on the right axis. Both then declined together.
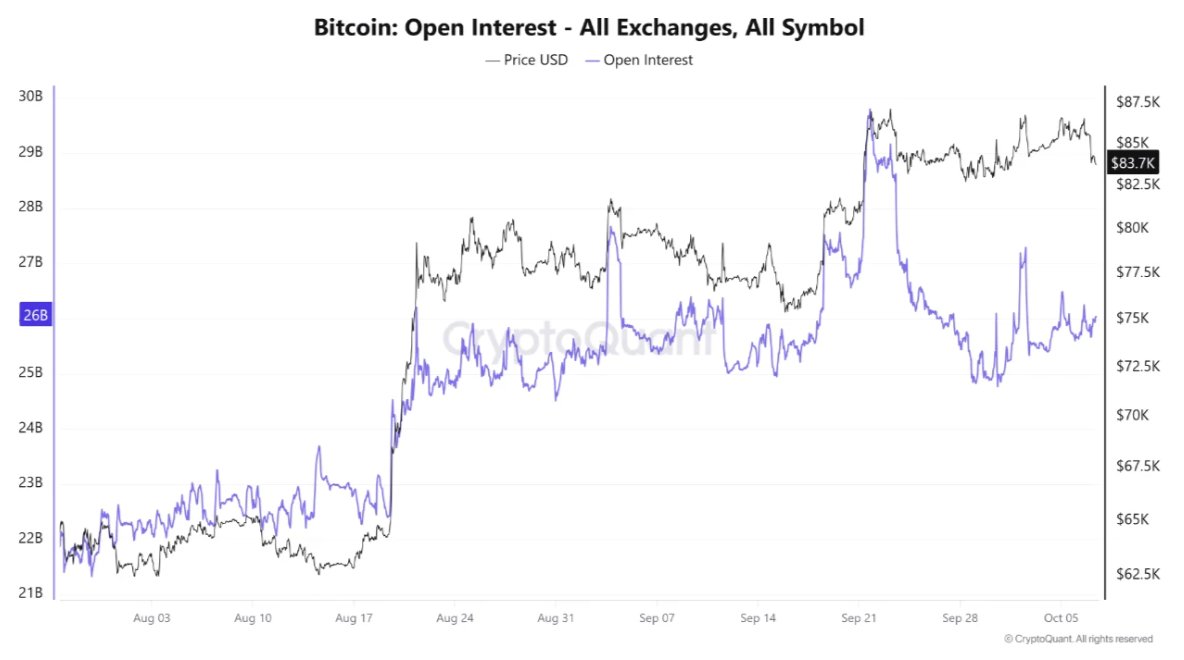
Declining open interest alongside price weakness is a specific signal. It indicates that leveraged long positions are being closed rather than hedged or flipped short — a form of de-risking rather than active directional repositioning. When combined with weak spot demand, the picture is one of reduced participation from both directional futures traders and spot buyers. That dual withdrawal is what makes @MAC_D46035’s note materially different from a standard overbought reading.
ETF Holdings: The Counterpoint That Keeps the Cycle Thesis Alive
The third chart in the note covers Bitcoin ETF aggregated holdings by week, from July 6 through October 5, 2024. The data tells a structurally different story. Holdings moved in a gradual ascending staircase — from approximately 1.2366M BTC in early July to 1.3176M BTC by the final week of the chart. That is a net increase of roughly 81,000 BTC in holdings over the period, with the final bar being the largest in the series.
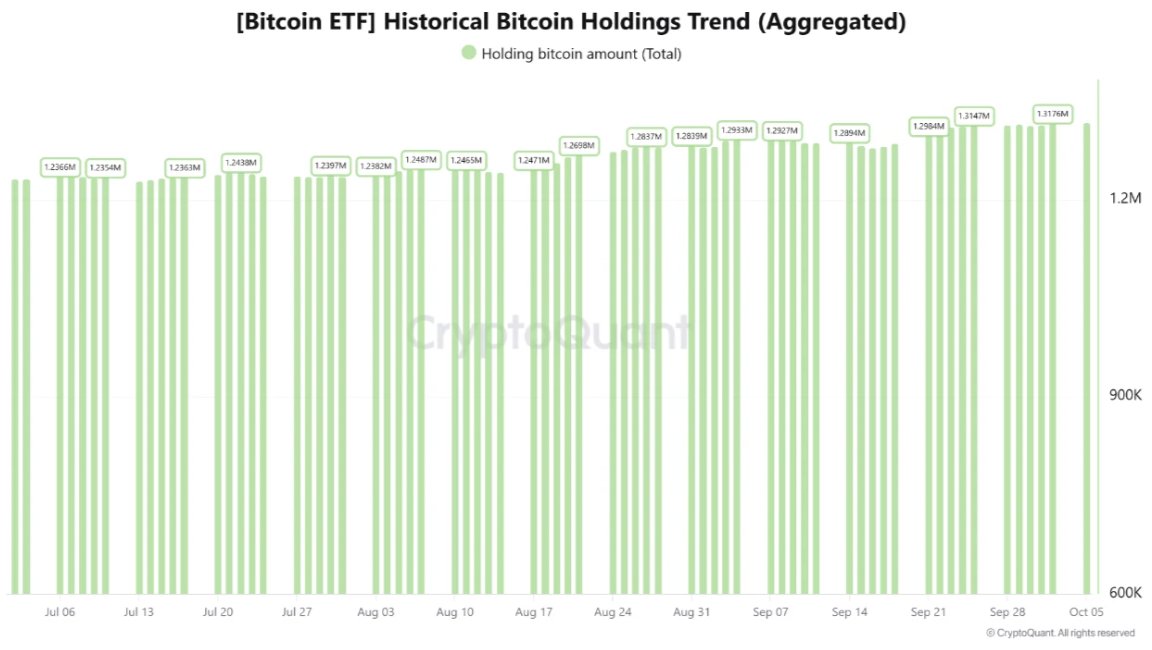
This is the tension @MAC_D46035’s note is navigating: spot apparent demand is negative, open interest is declining, but ETF structural accumulation continues to grind higher. The ETF trend is what keeps the “bullish cycle remains intact” condition credible. It is the basis for framing the current weakness as a corrective phase rather than a cycle top. However, the analyst is careful not to resolve this tension with certainty — the $69K support thesis is explicitly conditional on the cycle holding, not declared as already confirmed.
The $69K Trader Realized Price — What the On-Chain Model Shows
The fourth chart in the note displays Bitcoin’s price against a multi-band on-chain model from approximately March through October 2026. The bands carry explicit labels: a maximum band at $117.4K, an upper band at $96.7K, a Trader Realized Price at $69.1K, a lower band at $60.8K, and a minimum band at $43.5K.
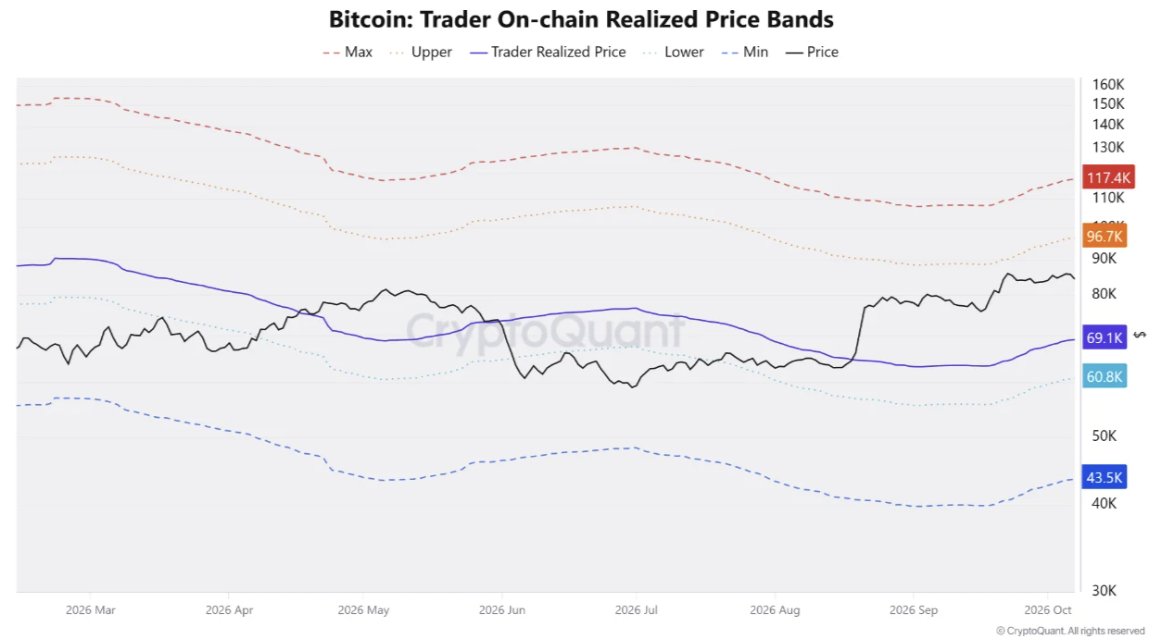
The price action shown on that chart is a V-shaped recovery. The black price line dipped below the purple Trader Realized Price band (labeled $69.1K) mid-chart — approximately June — then recovered sharply, and is now trading between the purple and orange bands, meaning between $69.1K and $96.7K. The analyst identifies the $69K area as “likely to serve as a key support level” — a characterization grounded in the fact that this band represents the average cost basis for active traders. When price breached it previously, the market found a bottom at that zone and reversed. That historical behavior is what makes $69K the designated support reference, not an arbitrary round number.
At the time of writing, Bitcoin at $82,981 sits approximately 20.3% above the $69.1K Trader Realized Price band. For readers tracking developments across assets, it is worth noting that similar technical exhaustion signals have appeared on shorter timeframes — as covered in our analysis of BTC, ETH, and XRP TD Sequential Buy Signals on 4-Hour Charts.
What the Data Confirms — and What It Doesn’t
@MAC_D46035’s note is a conditional framework, not a purchase order. The analyst does not state that the cycle is confirmed intact — the word “if” carries the full analytical weight of the note. What the data does confirm: spot demand has been net negative for the majority of the rolling 30-day period; open interest peaked alongside price and is now declining in tandem; and ETF holdings have continued to accumulate structurally. What the data does not confirm: that $69K will be reached, that a bounce from $69K is guaranteed, or that the current price ($82,981) represents a near-term bottom. The $69K level is a medium-to-long-term reference point, not an immediate trading trigger.
Bullish Scenario
If spot apparent demand returns to sustained positive readings while ETF accumulation continues its staircase pattern, the corrective phase would be characterized as complete. In that scenario, @MAC_D46035’s cycle thesis remains intact and $69K would function as historical confirmation support — a level that was tested and held — rather than a zone requiring a retest. The upper on-chain band at $96.7K represents the next structurally labeled reference above current price.
Bearish Scenario
If open interest continues declining alongside accelerating spot demand deterioration, a deeper corrective move toward the $69.1K Trader Realized Price band becomes the analyst’s stated scenario. A sustained close below $69K would invalidate the cycle-intact thesis and shift the next on-chain reference to the lower band at $60.8K.
Two signals are deteriorating simultaneously — apparent demand and open interest — while one structural counter-signal, ETF holdings, continues grinding higher. @MAC_D46035’s framing is precise: this is a conditional buying opportunity, not a confirmed one. The $69K Trader Realized Price band is the level the analyst identifies as the defining test. Bitcoin at $82,981 is 20.3% above it. Watch $69K as the level that determines whether this correction is a cycle reset or the beginning of something more structurally damaging.
Source: x.comFrequently Asked Questions
What is Bitcoin’s Trader Realized Price and why does $69K matter?
Does declining open interest mean Bitcoin is about to crash?
Why are Bitcoin ETF holdings rising if spot demand is weak?
Is $69K a guaranteed buying level for Bitcoin?
Source: CryptoQuant · Published by CoinsProbe Markets Desk
The opinions and market insights shared on CoinsProbe represent the views of individual authors based on prevailing market conditions at the time of publication. Cryptocurrency investments carry significant risk and volatility. Readers are encouraged to conduct their own research and seek professional financial advice before making investment decisions. CoinsProbe and its contributors do not accept responsibility for financial losses or decisions made based on published content.
CoinsProbe may publish sponsored articles, affiliate links, or promotional collaborations. All sponsored material is clearly labeled to maintain transparency with our audience. Our editorial decisions remain fully independent, and advertising partnerships do not influence reviews, rankings, or published opinions.
Since 2023, CoinsProbe has delivered reliable insights on cryptocurrency, blockchain, and digital assets. Our content is created by experienced researchers and analysts who follow strict editorial standards focused on accuracy, transparency, and credibility. Every article is carefully reviewed and verified using trusted sources and current market data. We provide unbiased analysis and timely updates covering everything from emerging crypto projects to major industry developments.