- AVAX is trading at $8.85 (+0.13% 24h) — retesting long-term horizontal support after a liquidity grab below the zone
- @CryptoBullet1 flags the retest on the weekly chart with three bullish targets: Target 2 at $65 (+634%) and Target 3 at $147 (+1,560%)
- Avalanche TVL holds at $555.69M with $1.96M in weekly fees per DeFiLlama — network activity has not deteriorated alongside price
- Pattern is still forming — descending resistance trendline from 2022 highs remains intact; weekly close above support is first confirmation
Avalanche (AVAX) is trading at $8.85 — up a marginal 0.13% in the past 24 hours — with a market cap of approximately $3.93 billion. After weeks of steady deterioration, the asset has returned to a long-term horizontal support zone that has defined AVAX’s structural floor across multiple cycles. The significance of this retest is not the price level alone — it is the sequence: a liquidity grab below support followed by a recovery back to that level, a pattern that technical analysts associate with institutional accumulation before directional moves.
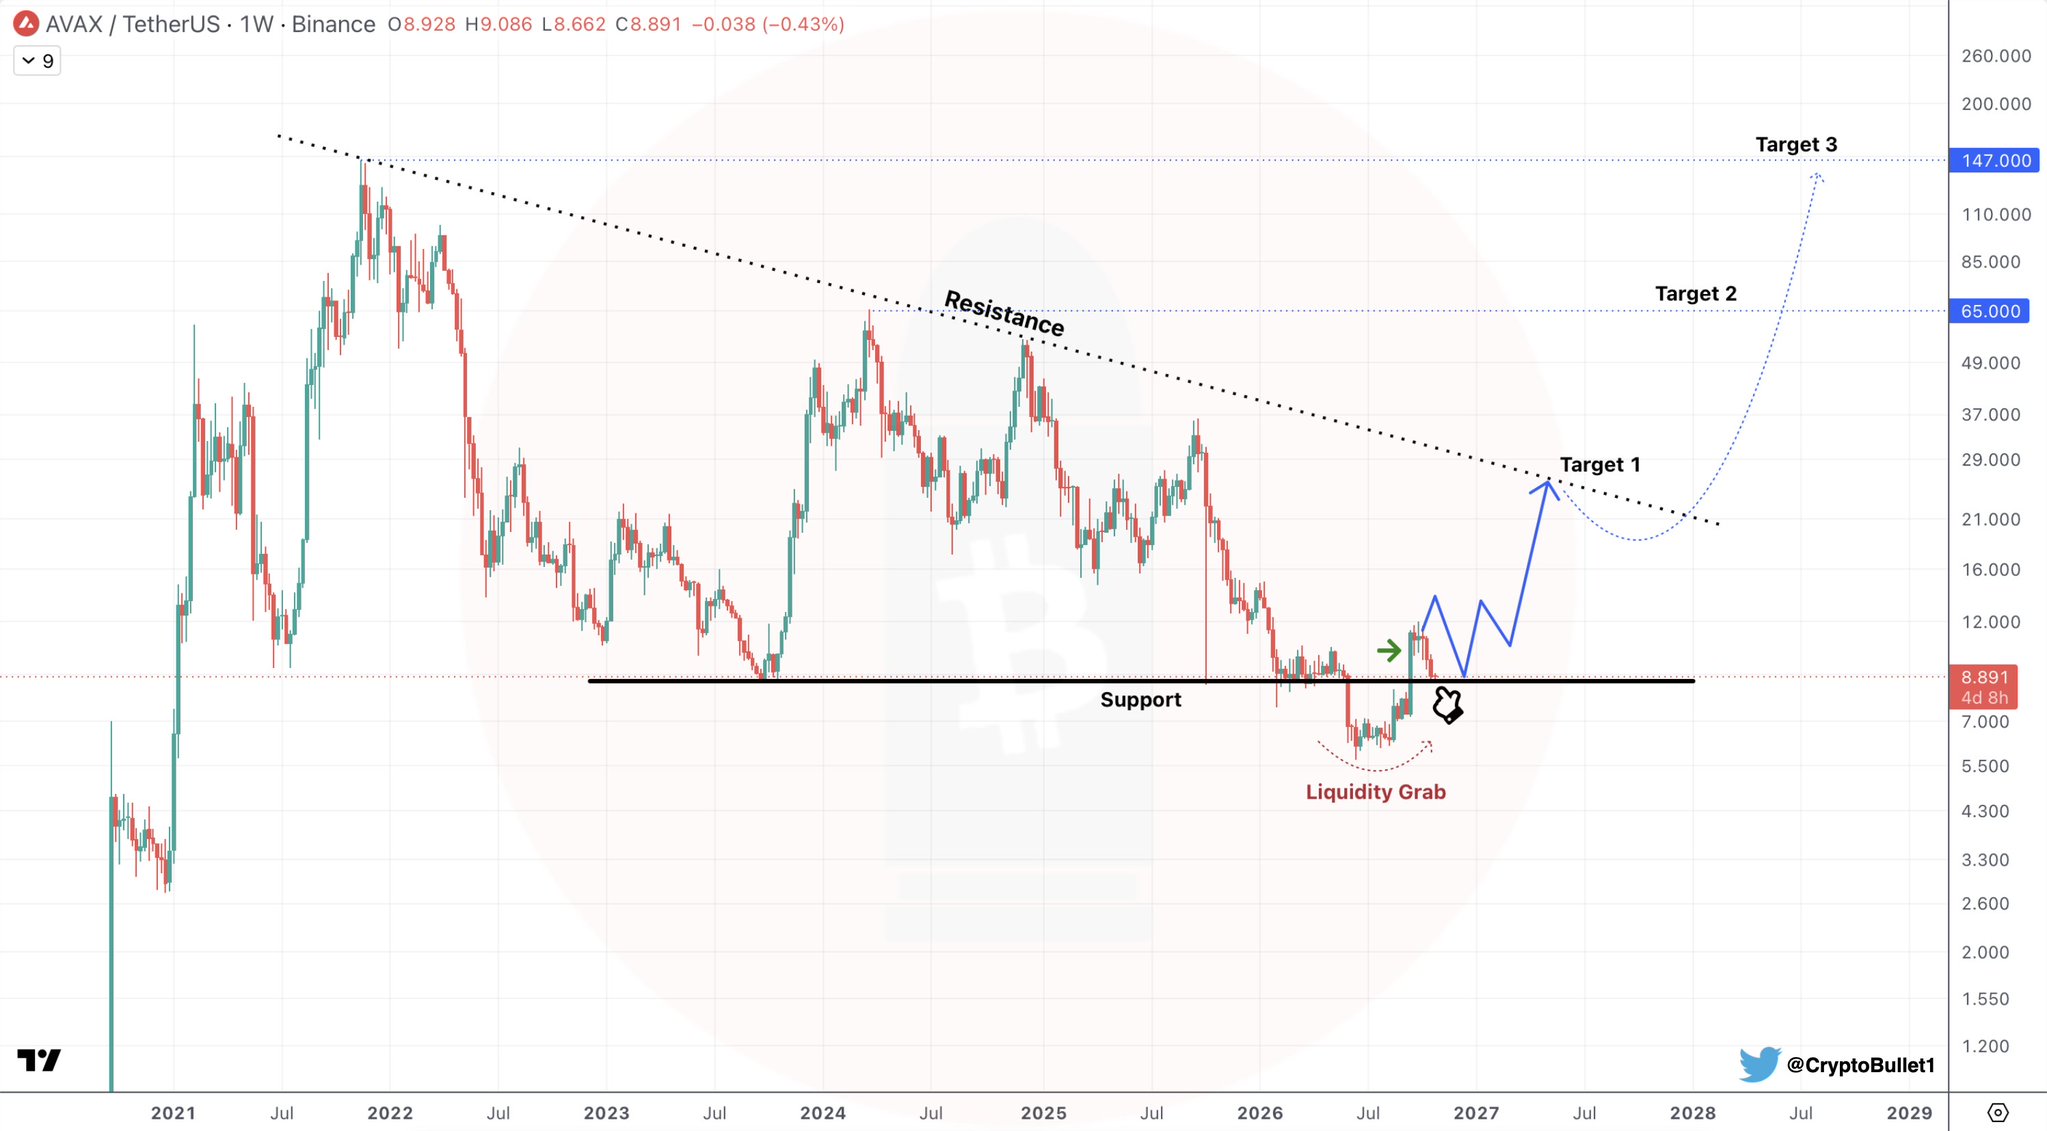
Analyst @CryptoBullet1 flagged the development directly: “$AVAX is retesting the Support as expected.” The chart accompanying the note — drawn on the weekly timeframe on Binance — shows a descending resistance trendline from AVAX’s 2022 highs converging with a horizontal support zone. Price dipped below support in a stop-sweep before recovering to the level. Three bullish price targets are annotated in blue: an unlabeled Target 1, Target 2 at $65, and Target 3 at $147. The pattern is still forming — no breakout above the descending resistance has been confirmed yet.
The Liquidity Grab — What the Weekly Chart Is Showing
A liquidity grab occurs when price pierces below a well-established support level — triggering stop-loss orders and liquidating retail long positions — before reversing sharply back above that level. The structure is common at major turning points because stop orders clustered below visible support represent available liquidity for large buyers to fill positions against. On the AVAX weekly chart, this sequence is visible: a wick below the horizontal support zone followed by a recovery back to the level, which is now being retested.
The current price of $8.85 sits precisely at this support zone. The weekly candle is printing a close of approximately $8.891 per the chart, with an open of $8.928, high of $9.086, and low of $8.662. The low represents the extent of the liquidity grab — a dip that briefly broke below the long-term floor before buyers absorbed the sweep. That the weekly candle closed back above the support level is the foundational observation @CryptoBullet1 is tracking.
It is important to be precise about what the pattern currently is and is not. The descending resistance trendline from the 2022 highs remains intact — AVAX has not broken above it. The liquidity grab has occurred and the retest of support is underway, but the bullish thesis requires price to ultimately clear that descending resistance to confirm a structural trend reversal. The pattern is still forming.
Three Targets — and the Distance That Separates Them
The three annotated targets on @CryptoBullet1’s weekly chart represent a cascading projection based on the measured move potential of the overall structure. Target 2 at $65 would represent a +634% move from the current price of $8.85. Target 3 at $147 would represent a +1,560% move from current levels — a figure consistent with AVAX’s prior all-time high of approximately $147 reached in November 2021.
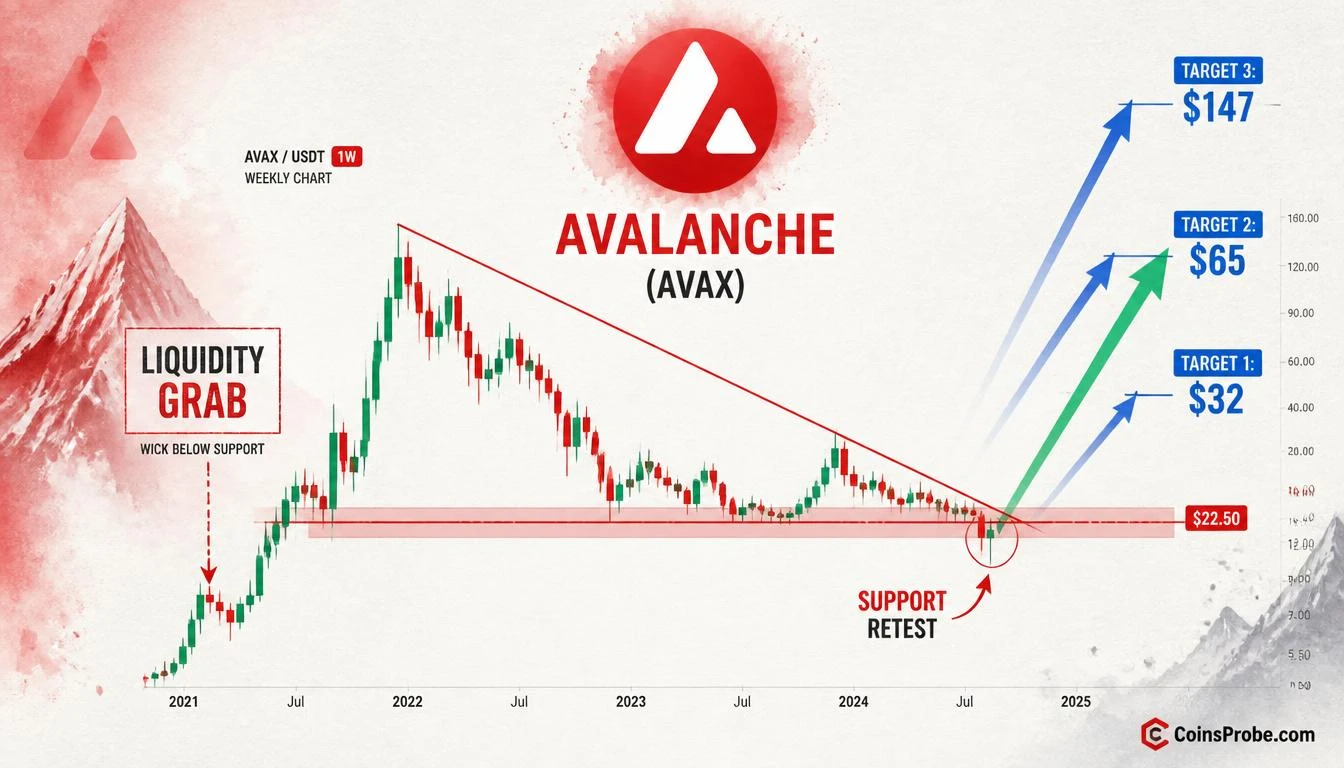
These are long-cycle targets drawn on the weekly chart, not near-term projections. The path between support and $147 passes through multiple resistance clusters visible on the axis: $12, $16, $21, $29, $37, $49, $85, $110, and beyond. A prior CoinsProbe analysis noted that AVAX reclaimed a key horizontal level with analyst targets at $25, $65, and $147, which aligns with the broader structural framework @CryptoBullet1 is tracking.
On-Chain Fundamentals at the Support Level
DeFiLlama data provides the on-chain context at this support retest. Avalanche’s total value locked stands at $555.69 million, with 24-hour DEX volume of $59.89 million and seven-day DEX volume of $498.75 million. Daily fees generated by the network total $286,400, with weekly fees of $1.96 million. These figures indicate that network activity has not collapsed alongside price — a relevant distinction when evaluating whether a support retest reflects fundamental deterioration or a market-driven technical flush.
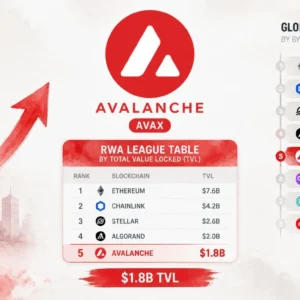
Avalanche’s institutional footprint also remains intact. The chain ranks fifth globally in real-world asset tokenization with 807 assets on-chain, a metric that speaks to structural adoption independent of short-term price volatility. AVAX spot ETF data via SoSoValue shows total ETF net assets of $50.1 million with cumulative net inflows of $31.6 million since launch, though daily volume has been thin at approximately $227,000.
Macro Context — Core PCE and GDP Drop Today
The timing of this support retest coincides with significant macro data releases. Core PCE Price Index (MoM and YoY) and GDP (QoQ) figures are due today, October 28, 2026, per SoSoValue’s macro calendar. These releases carry direct implications for risk asset positioning — a hotter-than-expected Core PCE reading could pressure crypto markets broadly, while a softer print may provide the macro backdrop for a support hold. ISM Manufacturing PMI follows on November 1, with CPI data due November 9. The next several sessions carry elevated macro sensitivity.
Bullish Scenario
AVAX holds the horizontal support zone at current levels and absorbs the retest with weekly candle closes above the floor. This opens a path toward the descending resistance trendline from 2022 highs, with a confirmed break above that trendline required to validate Target 2 at $65 and ultimately Target 3 at $147. The liquidity grab structure would be confirmed as a successful stop-sweep and reversal.
Bearish Scenario
A weekly close below the horizontal support zone — without recovery — would invalidate the liquidity-grab thesis and signal that the sweep was not absorption but continuation. In that case, the next reference levels on the chart axis stand at $7.00 and below. The pattern would shift from a potential reversal structure to a continuation of the broader downtrend.
AVAX is at a structural decision point that @CryptoBullet1 identified in advance. The support retest is unfolding as expected — the question the weekly chart will answer in coming sessions is whether this level holds with conviction or gives way. At $8.85, traders are watching for a weekly close above support as the first confirmation requirement. The descending resistance trendline from 2022 remains the key ceiling — a break above it, combined with a support hold, is what separates a retest from a reversal.
Frequently Asked Questions
What is a liquidity grab and why does it matter for AVAX right now?
What price levels must AVAX hold and break to confirm the bullish targets of $65 and $147?
How does Avalanche’s on-chain data compare to the current price weakness?
What macro events could impact AVAX’s support retest this week?
Source: Cryptobullet1 · Published by CoinsProbe Markets Desk
The opinions and market insights shared on CoinsProbe represent the views of individual authors based on prevailing market conditions at the time of publication. Cryptocurrency investments carry significant risk and volatility. Readers are encouraged to conduct their own research and seek professional financial advice before making investment decisions. CoinsProbe and its contributors do not accept responsibility for financial losses or decisions made based on published content.
CoinsProbe may publish sponsored articles, affiliate links, or promotional collaborations. All sponsored material is clearly labeled to maintain transparency with our audience. Our editorial decisions remain fully independent, and advertising partnerships do not influence reviews, rankings, or published opinions.
Since 2023, CoinsProbe has delivered reliable insights on cryptocurrency, blockchain, and digital assets. Our content is created by experienced researchers and analysts who follow strict editorial standards focused on accuracy, transparency, and credibility. Every article is carefully reviewed and verified using trusted sources and current market data. We provide unbiased analysis and timely updates covering everything from emerging crypto projects to major industry developments.