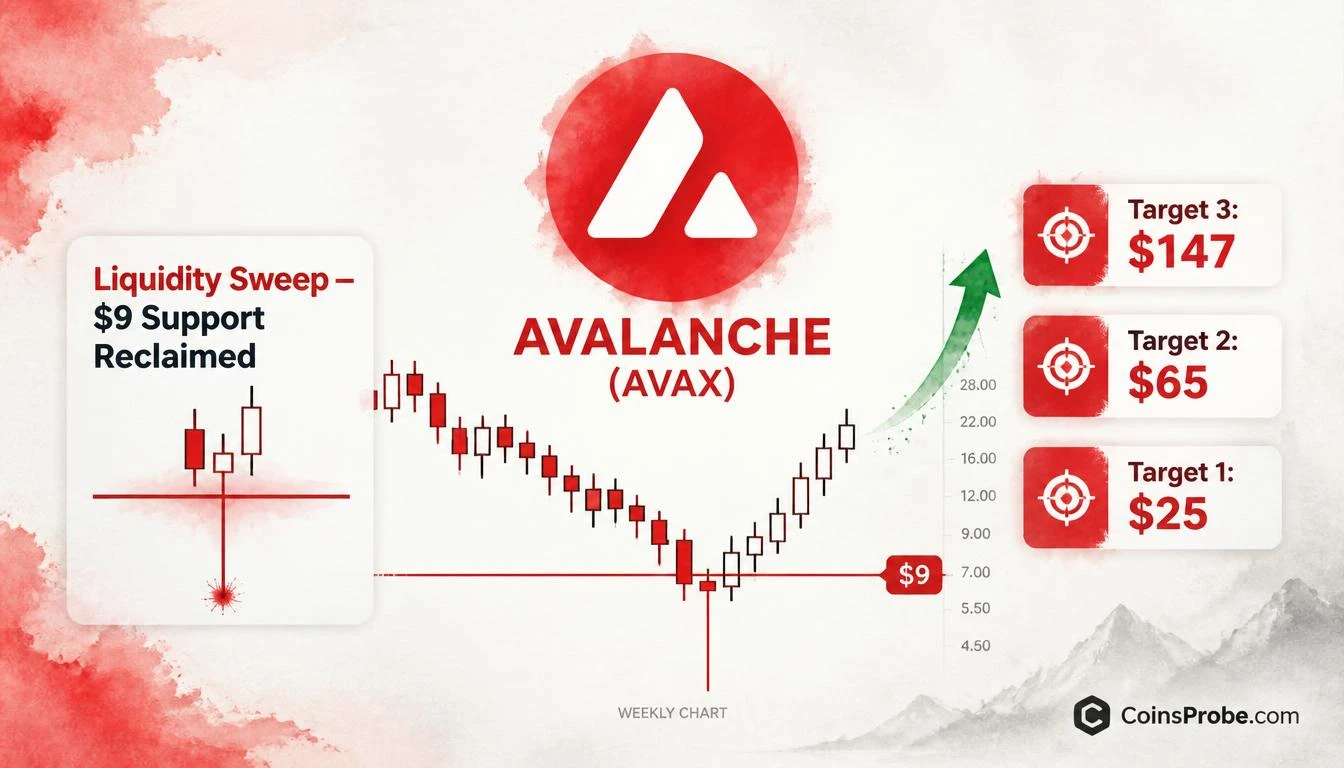
- AVAX trades at $11.56 after reclaiming $9 horizontal support — the Summer 2026 cycle low
- Analyst CryptoBullet1 sets three targets: $25 (+116%), $65 (+462%), $147 (+1,171%) from current price
- $9 is the thesis anchor — a weekly close below invalidates the entire bullish structure
- Descending trendline from 2022 sits at $22–$25 — a weekly close above is the first confirmation trigger
Avalanche (AVAX) is trading at approximately $11.56 — holding above the $9 horizontal support level that defined the Summer 2026 cycle low. The reclaim of that level is not a minor technical development: it is the structural reset that one analyst argues marks the end of AVAX’s worst drawdown in this cycle.
That analyst is CryptoBullet1 (@CryptoBullet1), who flagged the move on September 29, 2026. His exact words: “I doubt that $AVAX will return to those Summer 2026 prices. IMO the worst is over for $AVAX holders.” He set three sequential price targets: $25, $65, and $147 — implying upside of +116%, +462%, and +1,171% from current levels respectively.
The Signal — A Liquidity Sweep Below $9, Then a Reclaim
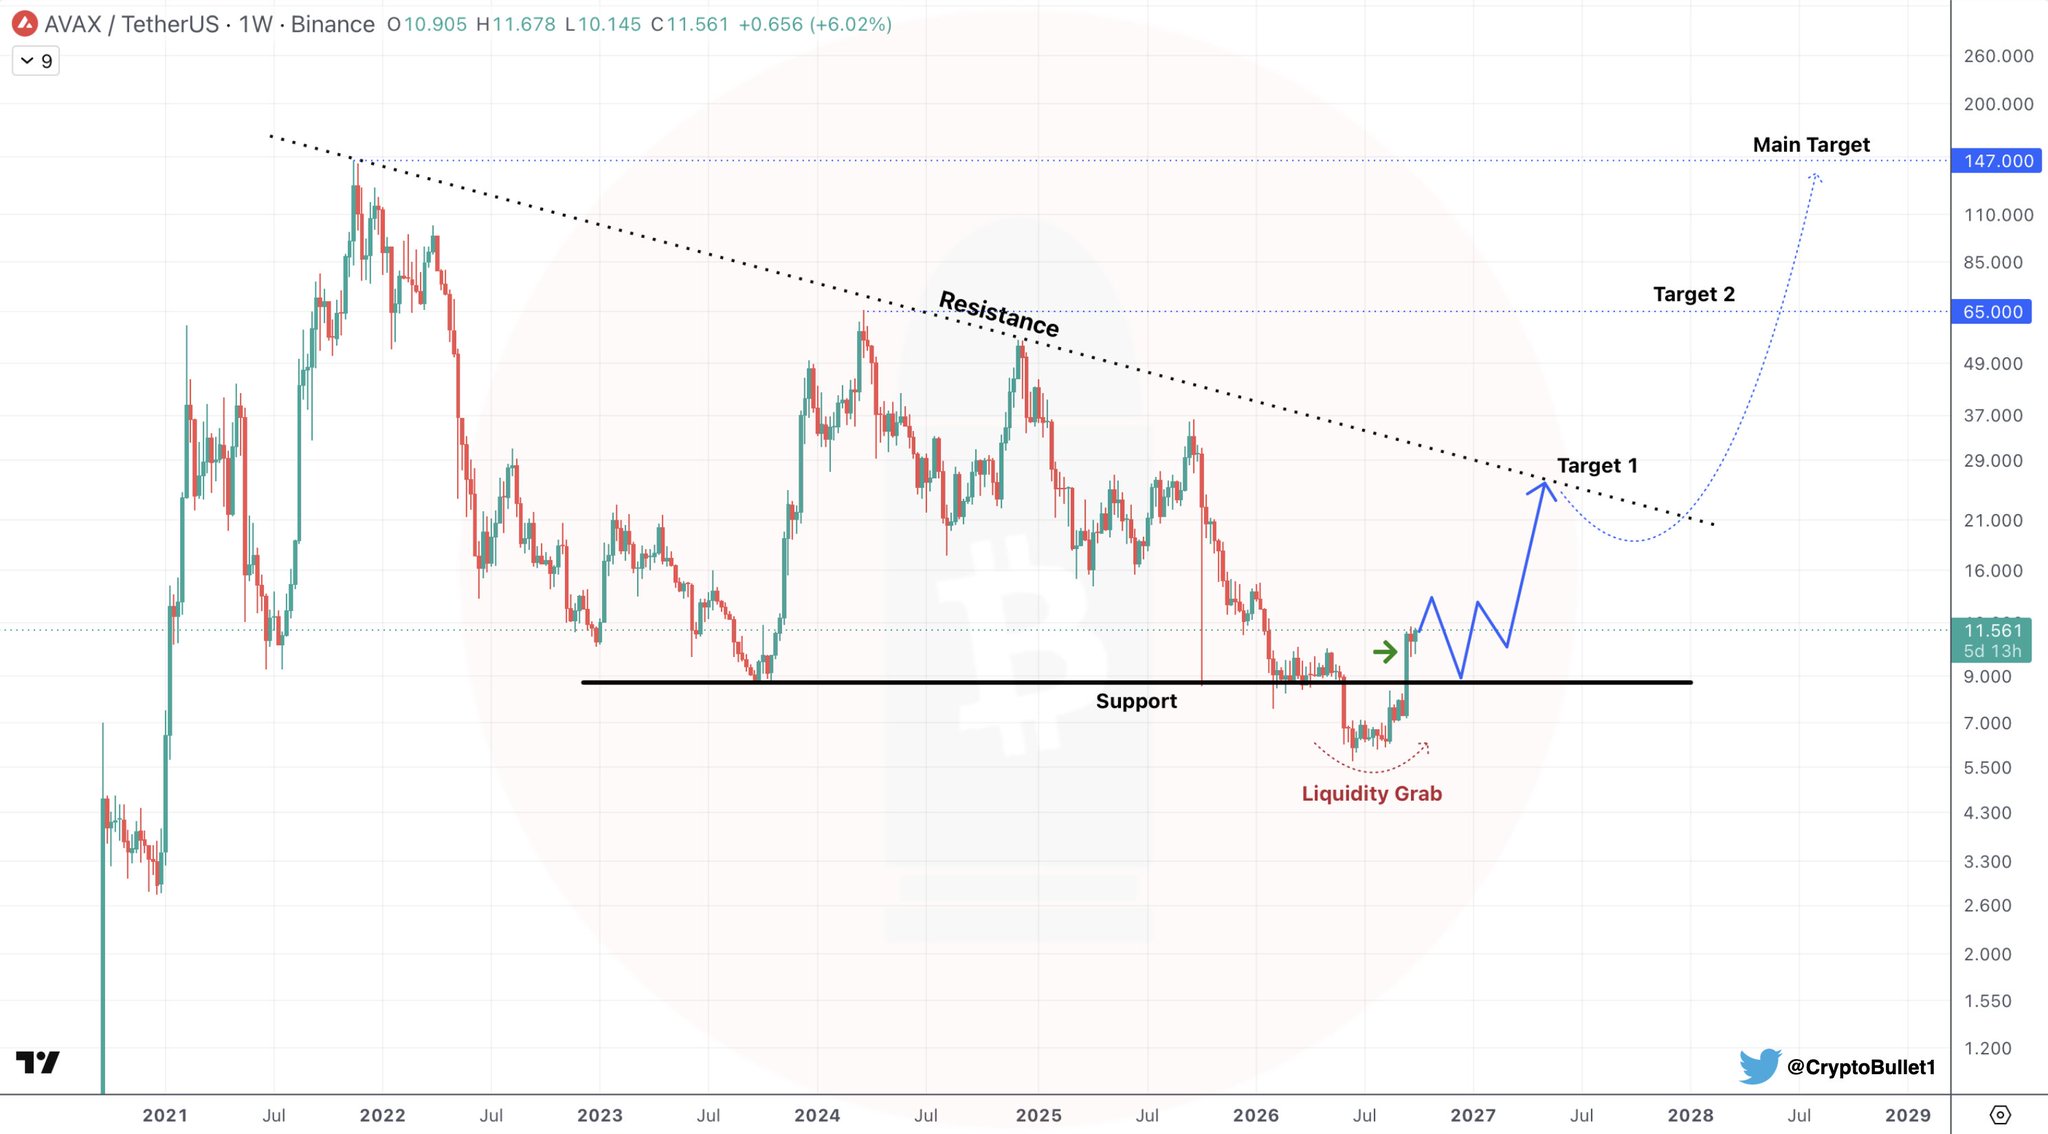
The weekly AVAX/USDT chart on Binance tells a specific structural story. During the summer of 2026, price wicked below the $9 horizontal support — a classic liquidity grab that swept stop-losses and retail exits accumulated beneath that level. The candle closed back above $9, and AVAX has since been consolidating above it.
This is not a breakout. It is a reclaim. The distinction matters. A reclaim confirms that the prior support held on a closing basis after being tested — it is a stronger signal than a simple bounce, because it demonstrates sustained buying interest at that zone rather than a momentary reaction.
CryptoBullet1’s weekly chart shows the $9 horizontal as a thick black support line, with a visible wick extending below it during the Summer 2026 low. Price is now consolidating above that line, facing a descending dotted resistance trendline that originates from AVAX’s 2022 highs and currently sits in the $22–$25 zone.
The Three Targets — What Each One Represents
The three targets are not arbitrary. They map to specific structural levels on the weekly chart, with each representing a distinct phase of the recovery thesis.
| Target | Price | Upside from $11.56 | Significance |
|---|---|---|---|
| Target 1 | $25 | +116% | Descending resistance trendline breakout zone |
| Target 2 | $65 | +462% | Mid-cycle resistance from 2023–2024 consolidation |
| Target 3 | $147 | +1,171% | Macro cycle target — near prior all-time high zone |
Source: @CryptoBullet1 (X) — AVAX/USDT Weekly, Binance
Target 1 at $25 is the most structurally significant near-term level. The descending trendline from 2022 currently intersects in the $22–$25 range on the weekly timeframe. A sustained weekly close above $25 would confirm a trendline breakout — the structural precondition for the larger moves toward $65 and $147. Without that close, the descending resistance remains intact and the recovery thesis stays untested at its first major hurdle.
Why the $9 Level Is the Thesis Anchor
Every part of this analysis depends on $9 holding. CryptoBullet1’s argument that “the worst is over” is predicated entirely on the liquidity sweep being a one-time event — a terminal flush that cleared weak hands and established a cycle low. If AVAX returns below $9 on a weekly closing basis, that interpretation is invalidated.
The mechanism behind the liquidity grab matters here. When price briefly traded below $9, it triggered stop-losses placed by traders who had bought the $9 support zone across previous months. That cascade of selling — representing genuine exits, not just paper losses — is what CryptoBullet1 identifies as the capitulation event. The wick-and-recover pattern on the weekly chart is the visual evidence that buyers stepped in at exactly those prices, absorbing the stop-loss cascade and pushing price back above the level within the same weekly candle.
The Descending Trendline — The One Obstacle
The bullish thesis from $11.56 to $147 is not a straight line. The descending resistance trendline — drawn from the 2022 highs through subsequent lower highs — currently intersects the $22–$25 zone on the weekly chart. This is the structural barrier that separates Target 1 from the current price.
Until AVAX closes a weekly candle above $25, the trendline remains unbroken. A rejection at that trendline without a weekly close above it would mean the recovery from the Summer 2026 low has stalled at its first major test. That is not a thesis-killer — it would simply mean a longer consolidation period before the eventual breakout — but it would delay the timeline for Targets 2 and 3 significantly.
AVAX’s longer-term narrative has evolved considerably over the past year. For context on what has changed in the ecosystem, read our piece on what has replaced the Avalanche hype among top altcoins.
Bullish Scenario — Weekly Close Above $25
A sustained weekly close above $25 confirms the descending trendline breakout that has capped AVAX since 2022. That opens the measured move toward $65 as the next structural target — a level representing the 2023–2024 mid-cycle resistance zone. From $65, a continuation toward the $147 macro target becomes technically viable, consistent with CryptoBullet1’s full three-stage recovery thesis.
Bearish Scenario — Weekly Close Below $9
A confirmed weekly close below $9 invalidates the liquidity-sweep-as-bottom interpretation entirely. It would mean the Summer 2026 wick was not a terminal flush but a temporary pause before further downside. In that scenario, the next meaningful support would need to be identified from lower timeframe structure, and the three targets outlined above would require reassessment from a lower base.
The Recovery Thesis in Summary
CryptoBullet1’s analysis presents a staged recovery structure: the Summer 2026 liquidity sweep at $9 marks the cycle low → price reclaims $9 support on a closing basis → consolidation builds above support → price tests and breaks the descending trendline at $25 → staged moves toward $65 and then $147 follow. Each stage requires the prior stage to complete before it becomes active. The thesis is linear and binary: $9 holds or it doesn’t.
At $11.56, AVAX sits 116% below Target 1, 462% below Target 2, and 1,171% below the main target of $147. The reclaim of $9 has occurred. The next confirmation event is a weekly close above $25 — the descending trendline breakout that would validate the full recovery structure. Until that close is printed, the thesis is intact but unconfirmed at its first major test. Watch $9 as the invalidation level and $25 as the first confirmation that the worst is structurally behind AVAX holders.
Frequently Asked Questions
What is the $9 level and why does it matter for AVAX?
What must AVAX do to confirm the move toward $65 and $147?
How long has the descending trendline been capping AVAX?
What does a liquidity sweep mean in this context?
Source: Cryptobullet1 · Published by CoinsProbe Markets Desk
The opinions and market insights shared on CoinsProbe represent the views of individual authors based on prevailing market conditions at the time of publication. Cryptocurrency investments carry significant risk and volatility. Readers are encouraged to conduct their own research and seek professional financial advice before making investment decisions. CoinsProbe and its contributors do not accept responsibility for financial losses or decisions made based on published content.
CoinsProbe may publish sponsored articles, affiliate links, or promotional collaborations. All sponsored material is clearly labeled to maintain transparency with our audience. Our editorial decisions remain fully independent, and advertising partnerships do not influence reviews, rankings, or published opinions.
Since 2023, CoinsProbe has delivered reliable insights on cryptocurrency, blockchain, and digital assets. Our content is created by experienced researchers and analysts who follow strict editorial standards focused on accuracy, transparency, and credibility. Every article is carefully reviewed and verified using trusted sources and current market data. We provide unbiased analysis and timely updates covering everything from emerging crypto projects to major industry developments.