- AVAX is trading at $11.35, up +1.99% on the daily candle per Binance chart data
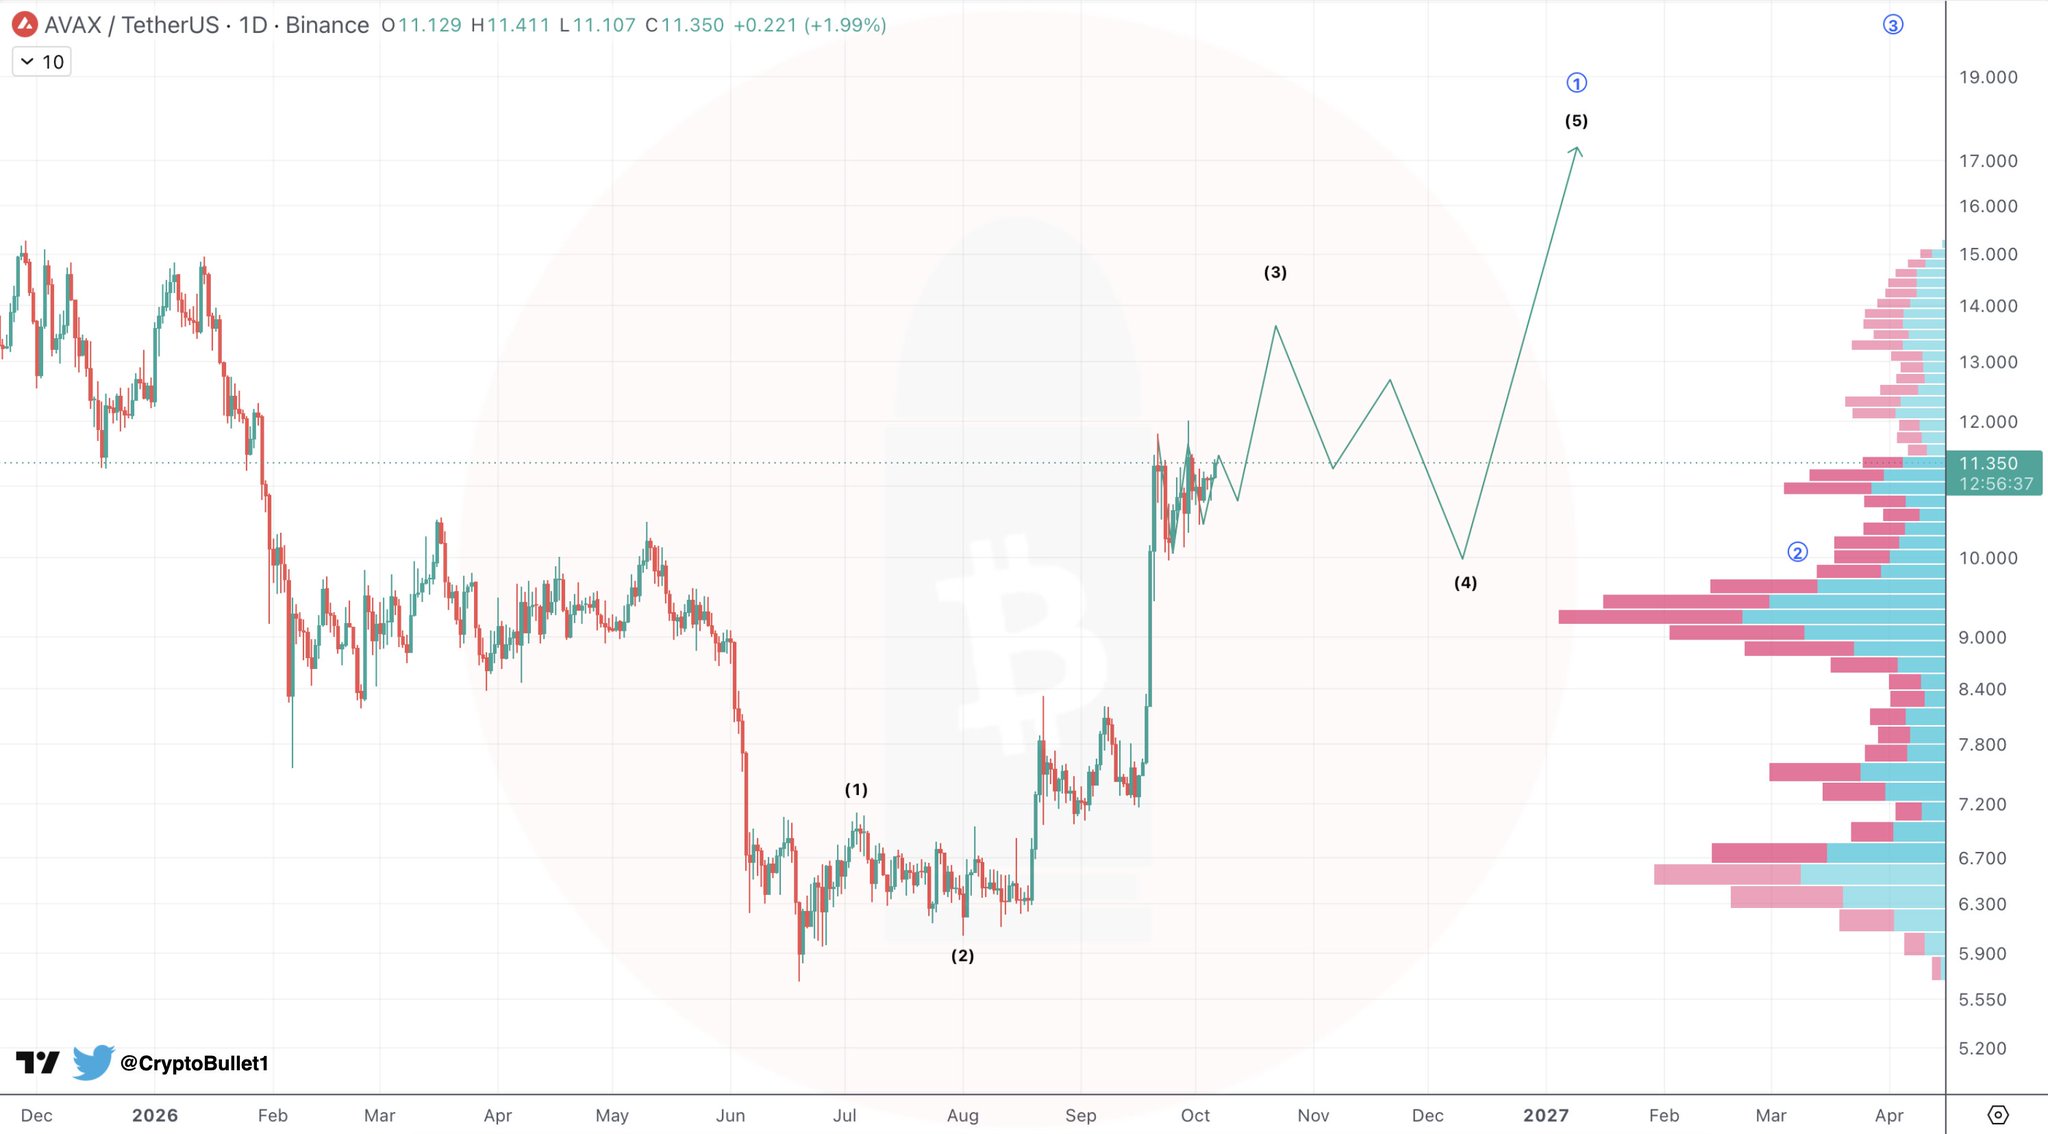
- @CryptoBullet1 flags a completed 4-wave Elliott Wave structure on the AVAX/USDT daily chart
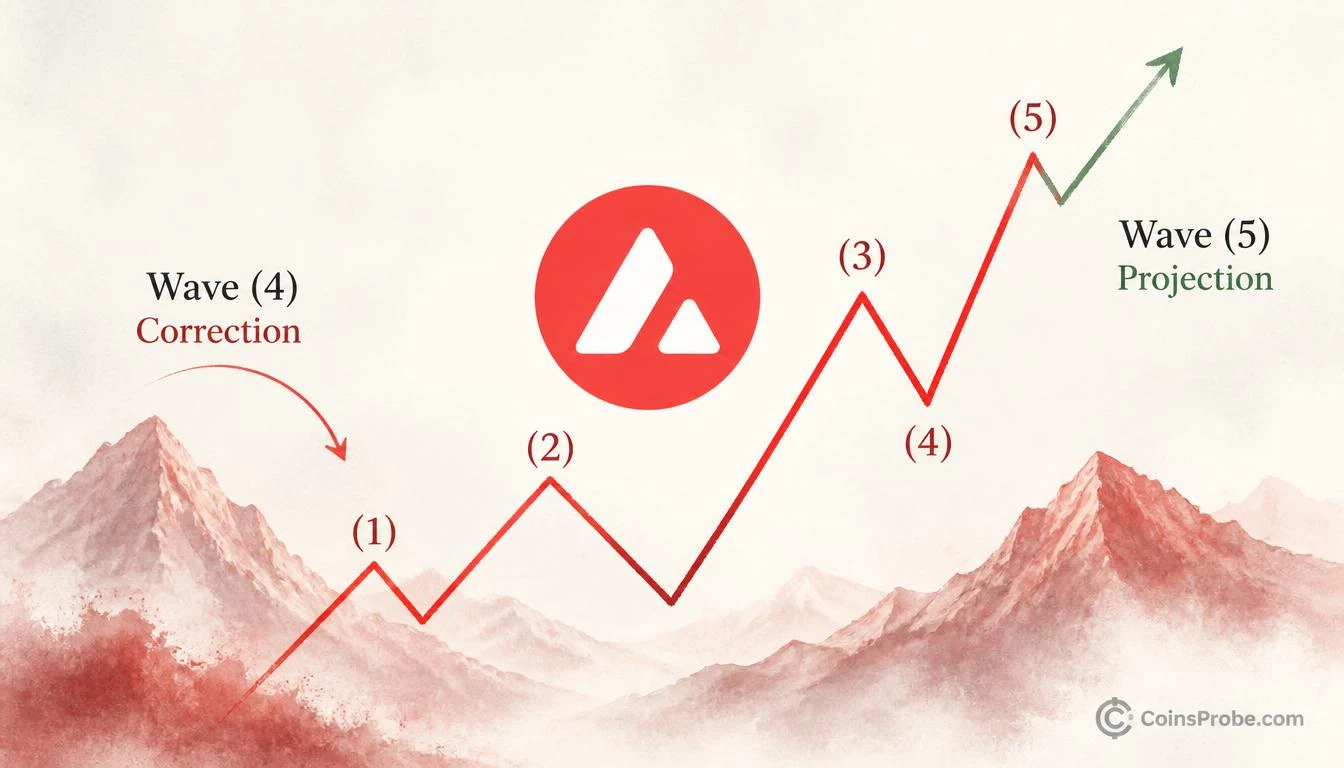
- Waves (1)–(4) are complete; Wave (5) impulse leg is the projected next move
- Wave (4) low is the critical invalidation line — a daily close below it voids the bullish count
Avalanche (AVAX) is holding at $11.35 on the daily chart — and analyst @CryptoBullet1 has published a one-day Elliott Wave count that places the token at a critical inflection point between a Wave 4 corrective pullback and the beginning of a projected Wave 5 impulse move to the upside.
The chart, posted to X on October 6, 2026, shows a completed five-wave Elliott Wave sequence in progress on the AVAX/USDT pair on Binance. According to the structure shared by @CryptoBullet1, Waves (1) through (3) have already formed, with the current price action representing Wave (4) — a corrective dip that precedes the final impulsive leg. The analyst’s projection plots Wave (5) extending toward the upper right of the chart, well above current price levels, though no explicit numerical target is labeled in the note.
The Elliott Wave Structure — What the Daily Chart Shows
The Elliott Wave principle divides trending market moves into five waves: three impulse waves (1, 3, 5) that move in the direction of the primary trend, alternating with two corrective waves (2 and 4) that retrace a portion of the prior advance. The model does not predict exact price targets by default — it identifies where in the sequence price is likely to be, and what type of move typically follows.
On the AVAX daily chart published by @CryptoBullet1, the wave labels are printed directly on the chart as (1), (2), (3), (4), and (5), with the timeline placing the projected Wave (5) top beyond the current price point — meaning it has not yet occurred. The chart’s right-axis scale runs from approximately $5.20 at the lower boundary to $19.00 at the upper boundary, with the current price pinned at $11.35 per the chart’s own live ticker (O: 11.129, H: 11.411, L: 11.107, C: 11.350, +0.221, +1.99%). These axis values are display boundaries, not analyst-stated price targets.
The corrective dip at Wave (4) — visible as a pullback in the chart’s zigzag structure — is the current zone. In classical Elliott Wave theory, Wave 4 corrections tend to find support above the top of Wave 1, and once complete, set the stage for Wave 5 to match or exceed the length of Wave 3. The analyst’s projection line shows Wave (5) resuming the uptrend from the Wave (4) low, extending the impulse sequence toward the upper portion of the chart.
Where AVAX Stands — Price Context
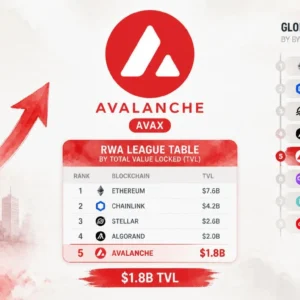
At the time of writing, AVAX is trading at approximately $11.35, with a 24-hour gain of +1.99% on the daily candle shown in the chart. The session range printed on the chart runs from a low of $11.107 to a high of $11.411. Avalanche has been building momentum at the protocol level as well — the network ranks fifth globally in real-world asset tokenization with 807 assets on-chain, a structural development that distinguishes this cycle’s AVAX from prior ones driven purely by DeFi speculation.
The Elliott Wave setup flagged by @CryptoBullet1 arrives after a period of significant price suppression. A prior analysis noted that AVAX reclaimed a key horizontal with analyst eyes on $25, $65, and $147 as successive targets — levels that align with the kind of multi-leg recovery that a Wave 5 impulse from this base would theoretically need to reach.
What the Wave Count Means — And What It Doesn’t
The Elliott Wave model is a pattern-recognition framework, not a deterministic price engine. What the @CryptoBullet1 count says is precise: Waves (1) through (4) appear complete on the daily timeframe, and the structure is positioned for Wave (5) — the final impulse leg — to initiate from current levels or from the Wave (4) low.
What the count does not say: it does not provide a numeric price target for Wave (5). The analyst’s chart projects the wave shape and direction, but no explicit dollar level is labeled at the Wave (5) peak. Any specific numeric projection beyond the chart’s annotated structure would go beyond what @CryptoBullet1 has stated.
What to watch for confirmation: In Elliott Wave analysis, the wave count is invalidated if Wave (4) closes below the top of Wave (1). A breakdown below the Wave (4) corrective low on a daily closing basis would call the bullish count into question.
Bullish Scenario
If Wave (4) holds and AVAX begins printing higher highs and higher lows from current levels, the five-wave impulse sequence is intact. Wave (5) would be expected to extend into the upper half of the chart’s projected range, consistent with the rising projection shown in @CryptoBullet1’s analysis.
Bearish Scenario
A daily close below the Wave (4) corrective low would invalidate the current wave count as labeled. Under that scenario, the structure would need to be re-labeled, and the bullish impulse thesis would be suspended until a new pattern emerges.
AVAX’s five-wave structure on the daily chart, as identified by @CryptoBullet1, places the token at one of the most structurally significant junctures in the current sequence. Waves (1) through (4) are complete. The question traders are watching is whether the Wave (4) low holds — because if it does, Wave (5) is what comes next.
Frequently Asked Questions
What does a Wave 4 correction mean for AVAX price?
At what price level is the @CryptoBullet1 AVAX Elliott Wave count invalidated?
Does @CryptoBullet1 give a specific price target for Wave 5 in AVAX?
How does AVAX’s RWA tokenization ranking relate to the Elliott Wave setup?
Source: Cryptobullet1 · Published by CoinsProbe Markets Desk
The opinions and market insights shared on CoinsProbe represent the views of individual authors based on prevailing market conditions at the time of publication. Cryptocurrency investments carry significant risk and volatility. Readers are encouraged to conduct their own research and seek professional financial advice before making investment decisions. CoinsProbe and its contributors do not accept responsibility for financial losses or decisions made based on published content.
CoinsProbe may publish sponsored articles, affiliate links, or promotional collaborations. All sponsored material is clearly labeled to maintain transparency with our audience. Our editorial decisions remain fully independent, and advertising partnerships do not influence reviews, rankings, or published opinions.
Since 2023, CoinsProbe has delivered reliable insights on cryptocurrency, blockchain, and digital assets. Our content is created by experienced researchers and analysts who follow strict editorial standards focused on accuracy, transparency, and credibility. Every article is carefully reviewed and verified using trusted sources and current market data. We provide unbiased analysis and timely updates covering everything from emerging crypto projects to major industry developments.