Date: Sat, Dec 27, 2025 | 05:59 AM GMT
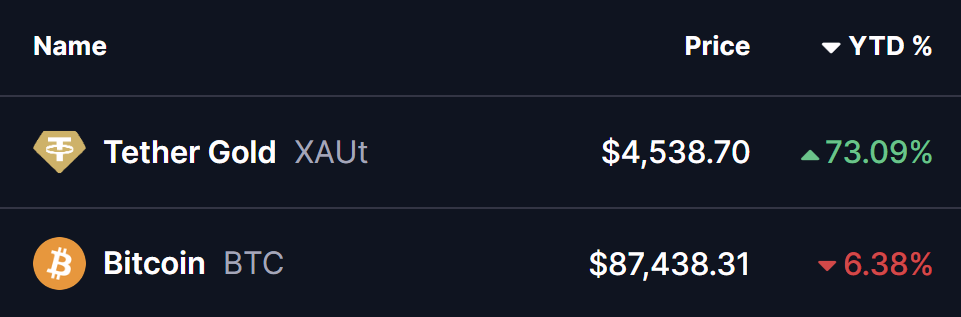
Gold prices have officially surged to fresh all-time highs, breaking above the $4,550 mark and printing a peak near $4,553 on December 26, 2025. This historic move caps off an exceptional year for the yellow metal, which is now up more than 73% in 2025 and currently trading around $4,538.
In contrast, Bitcoin (BTC), often referred to as “digital gold,” continues to lag behind. Despite several recovery attempts, BTC remains down more than 6% on the year, significantly underperforming gold and leaving many investors questioning whether Bitcoin’s next major move is still ahead.
While gold’s explosive rally dominates headlines, a growing number of market participants are paying attention to a quieter but potentially more important development: Bitcoin’s price structure is beginning to resemble gold’s historical setup before its own breakout. Historically, Bitcoin has rarely moved in perfect sync with gold. Instead, it has often followed with a delay, reacting only after gold establishes a clear directional trend.
Historical Gold Fractal Hints at Bullish Potential
The latest chart comparison shared by analyst Crypto Tice highlights a striking fractal between Bitcoin’s current structure and gold’s price behavior during its 2023 bottoming phase.
Back then, gold spent an extended period trapped between rising support and overhead resistance. The market endured repeated rejections from a descending trendline, while buyers consistently stepped in at higher lows. This prolonged consolidation tested investor patience and created widespread uncertainty about whether gold could ever escape its range.
That phase ultimately turned out to be accumulation rather than distribution. Once gold successfully broke above its resistance trendline, the move triggered a powerful upside expansion, setting the stage for the historic rally that followed.
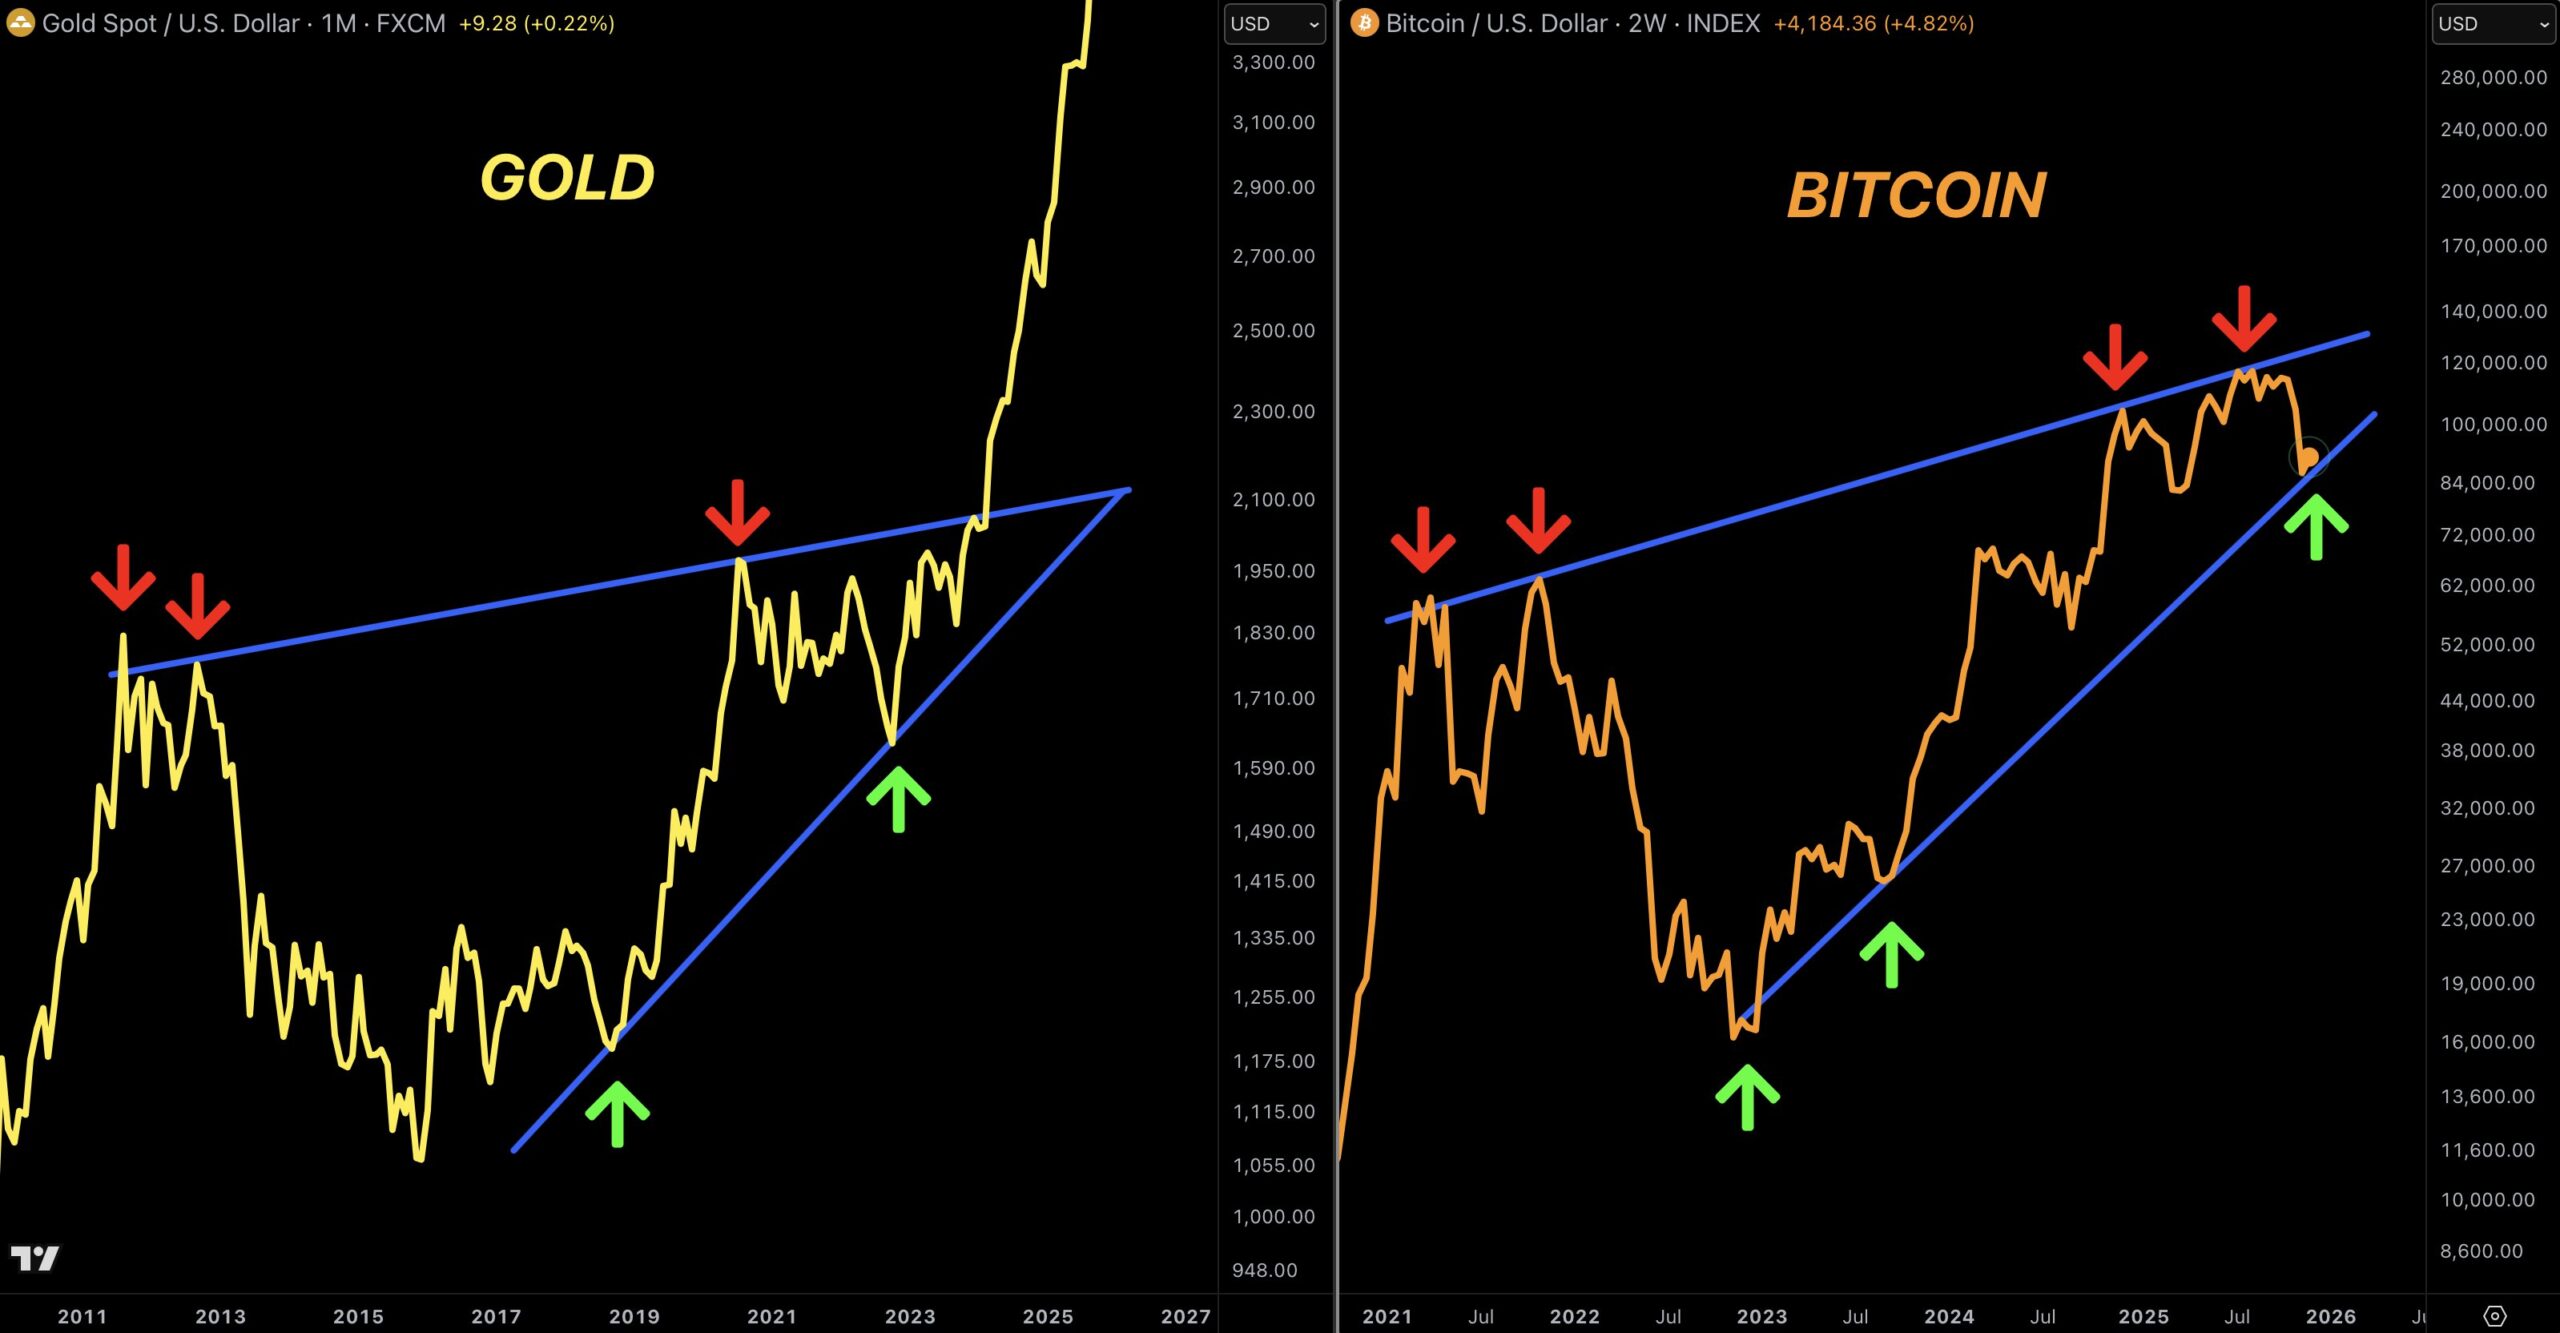
Bitcoin’s current chart shows a remarkably similar structure. The rejection from the $120,000–$126,000 region mirrors gold’s earlier failed breakout attempts, while BTC’s ongoing consolidation between roughly $80,000 and $90,000 reflects the same grinding base-building behavior gold displayed before its surge. In both cases, price action has been defined by compressed volatility, repeated support tests, and pressure from a rising resistance line that has not yet been convincingly cleared.
What’s Next for BTC?
If this gold-to-Bitcoin fractal continues to play out, Bitcoin’s current sideways movement may represent the final phase of accumulation before a renewed bullish leg. A decisive breakout above the ascending resistance trendline could act as a major sentiment shift, potentially opening the door for a powerful trend continuation toward much higher levels, with long-term targets above $200,000 coming back into focus.
That said, fractals are not guarantees. They provide historical context, not certainty. For the bullish scenario to remain valid, Bitcoin must continue to defend the critical $80,000–$85,000 support zone. A sustained breakdown below this region would weaken the fractal comparison and suggest that BTC needs more time before any meaningful upside can unfold.
For now, gold’s record-breaking rally serves as a reminder that long consolidations often resolve sharply once conditions align. If Bitcoin continues to echo gold’s historical path, the current period of calm could be setting the stage for its next major move.
Disclaimer: The views and analysis presented in this article are for informational purposes only and reflect the author’s perspective, not financial advice. Technical patterns and indicators discussed are subject to market volatility and may or may not yield the anticipated results. Investors are advised to exercise caution, conduct independent research, and make decisions aligned with their individual risk tolerance.
The opinions and market insights shared on CoinsProbe represent the views of individual authors based on prevailing market conditions at the time of publication. Cryptocurrency investments carry significant risk and volatility. Readers are encouraged to conduct their own research and seek professional financial advice before making investment decisions. CoinsProbe and its contributors do not accept responsibility for financial losses or decisions made based on published content.
CoinsProbe may publish sponsored articles, affiliate links, or promotional collaborations. All sponsored material is clearly labeled to maintain transparency with our audience. Our editorial decisions remain fully independent, and advertising partnerships do not influence reviews, rankings, or published opinions.
Since 2023, CoinsProbe has delivered reliable insights on cryptocurrency, blockchain, and digital assets. Our content is created by experienced researchers and analysts who follow strict editorial standards focused on accuracy, transparency, and credibility. Every article is carefully reviewed and verified using trusted sources and current market data. We provide unbiased analysis and timely updates covering everything from emerging crypto projects to major industry developments.