Date: Sun, April 20, 2025 | 04:52 PM GMT
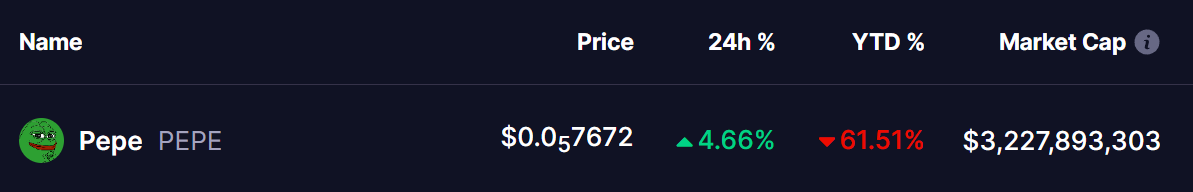
The cryptocurrency market has been under intense selling pressure recently, with Ethereum (ETH) posting its worst Q1 since 2018, sliding more than 45%. That bearish wave swept across the major memecoins— and the Pepe (PEPE) wasn’t spared either as it declined by 61% this year.
A classic harmonic pattern has emerged on the chart, hinting that PEPE could be gearing up for more upside in the near term.
Harmonic Pattern Suggests Continuation of the Rebound
The daily chart for PEPE shows the formation of a Bearish Gartley pattern, a structure that typically indicates a strong bullish move toward completion before any major reversal risk.
PEPE’s sharp decline began around February 14, after it failed to hold above the $0.00001075 resistance level (marked as point X). Since then, the memecoin lost nearly 50% of its value, eventually bottoming out near $0.0000052 on March 10 (point A).
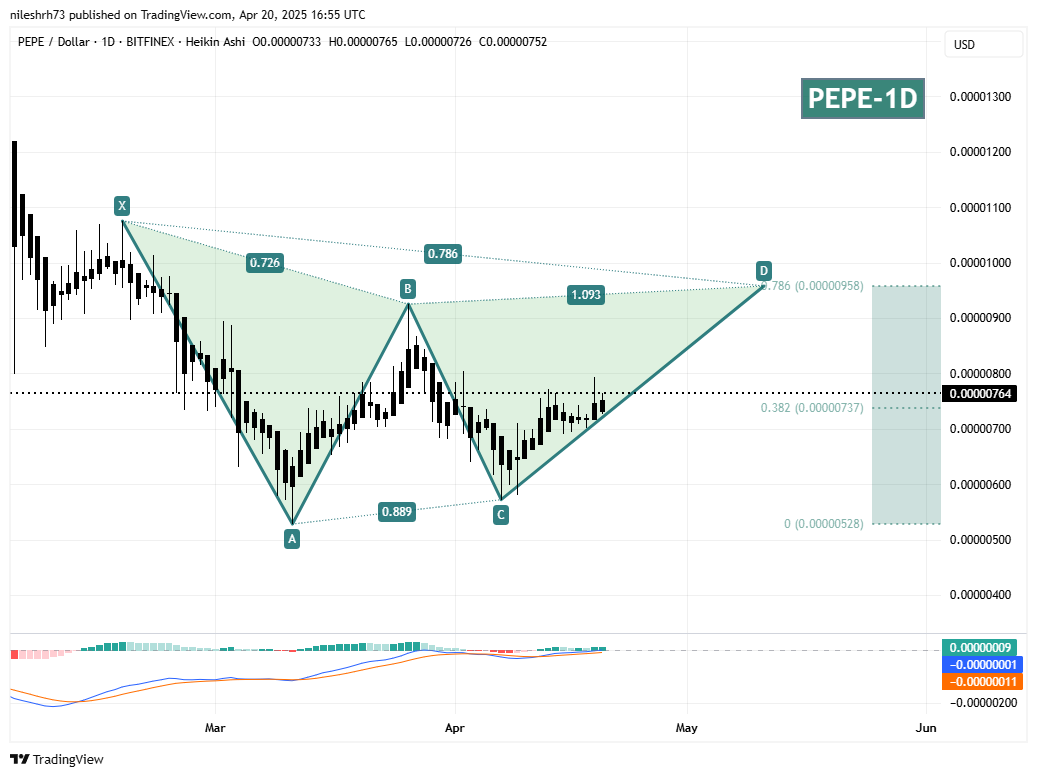
The recent price action suggests the token is now in the CD leg of the pattern, having made a strong bounce from $0.000005722 (point C), and is currently trading at $0.0000076 — the final wave that often precedes a significant short-term rally.
The next major target sits around 0.00000958, where point D completes the Gartley structure. If PEPE reaches this level from its current price near 0.00000764, it would mark a gain of approximately 25%.
What’s Next for PEPE?
If bullish momentum continues to gather strength, PEPE could climb toward the 0.00000958 zone in the coming days. This level not only completes the harmonic pattern but also lines up with the key 78.6% Fibonacci retracement of the X-A move — making it a critical resistance area to watch.
However, traders should stay cautious once PEPE nears this level. In harmonic trading, bearish reactions typically happen after reaching the D point, so profit-taking or a pullback could easily follow.
In the short term, the 0.00000737 area (38.2% Fib retracement) is acting as a minor support level .

Disclaimer: This article is for informational purposes only and does not constitute financial advice. Always do your own research before investing in cryptocurrencies.
The opinions and market insights shared on CoinsProbe represent the views of individual authors based on prevailing market conditions at the time of publication. Cryptocurrency investments carry significant risk and volatility. Readers are encouraged to conduct their own research and seek professional financial advice before making investment decisions. CoinsProbe and its contributors do not accept responsibility for financial losses or decisions made based on published content.
CoinsProbe may publish sponsored articles, affiliate links, or promotional collaborations. All sponsored material is clearly labeled to maintain transparency with our audience. Our editorial decisions remain fully independent, and advertising partnerships do not influence reviews, rankings, or published opinions.
Since 2023, CoinsProbe has delivered reliable insights on cryptocurrency, blockchain, and digital assets. Our content is created by experienced researchers and analysts who follow strict editorial standards focused on accuracy, transparency, and credibility. Every article is carefully reviewed and verified using trusted sources and current market data. We provide unbiased analysis and timely updates covering everything from emerging crypto projects to major industry developments.