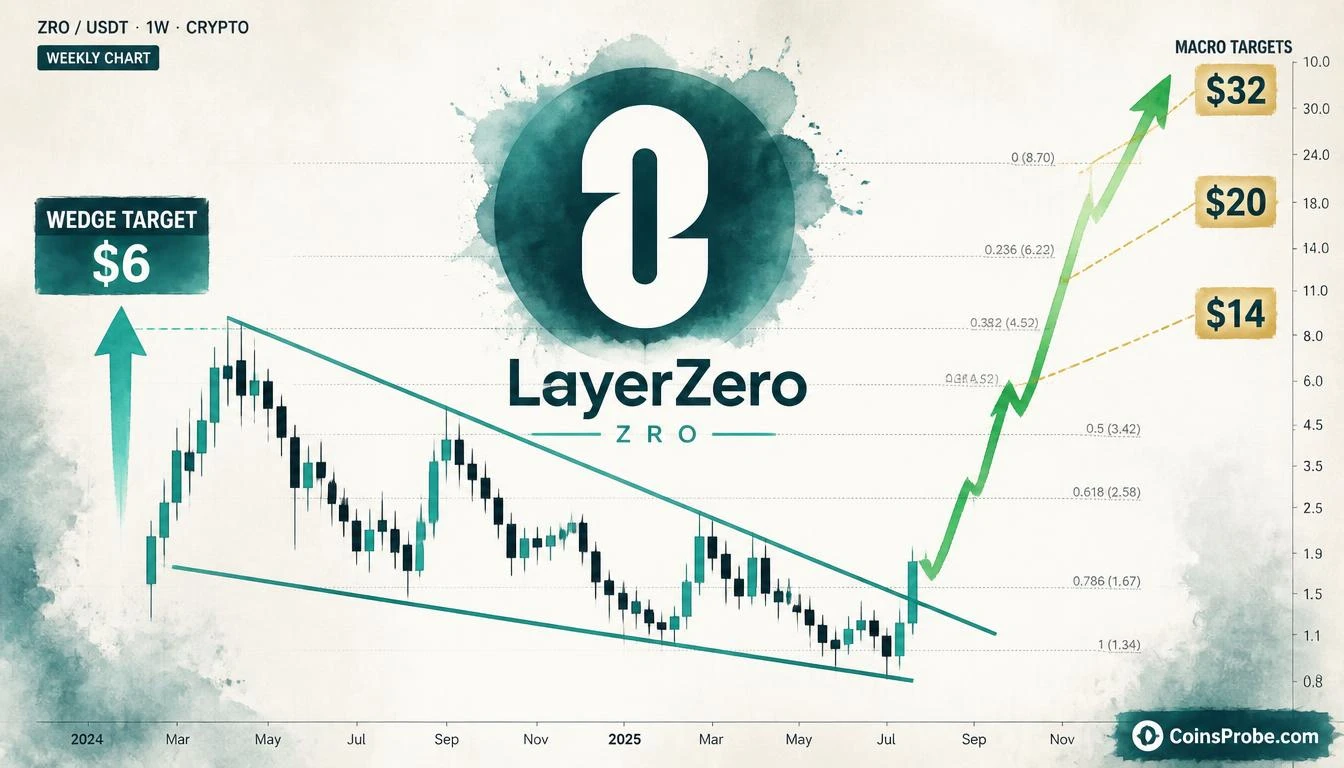

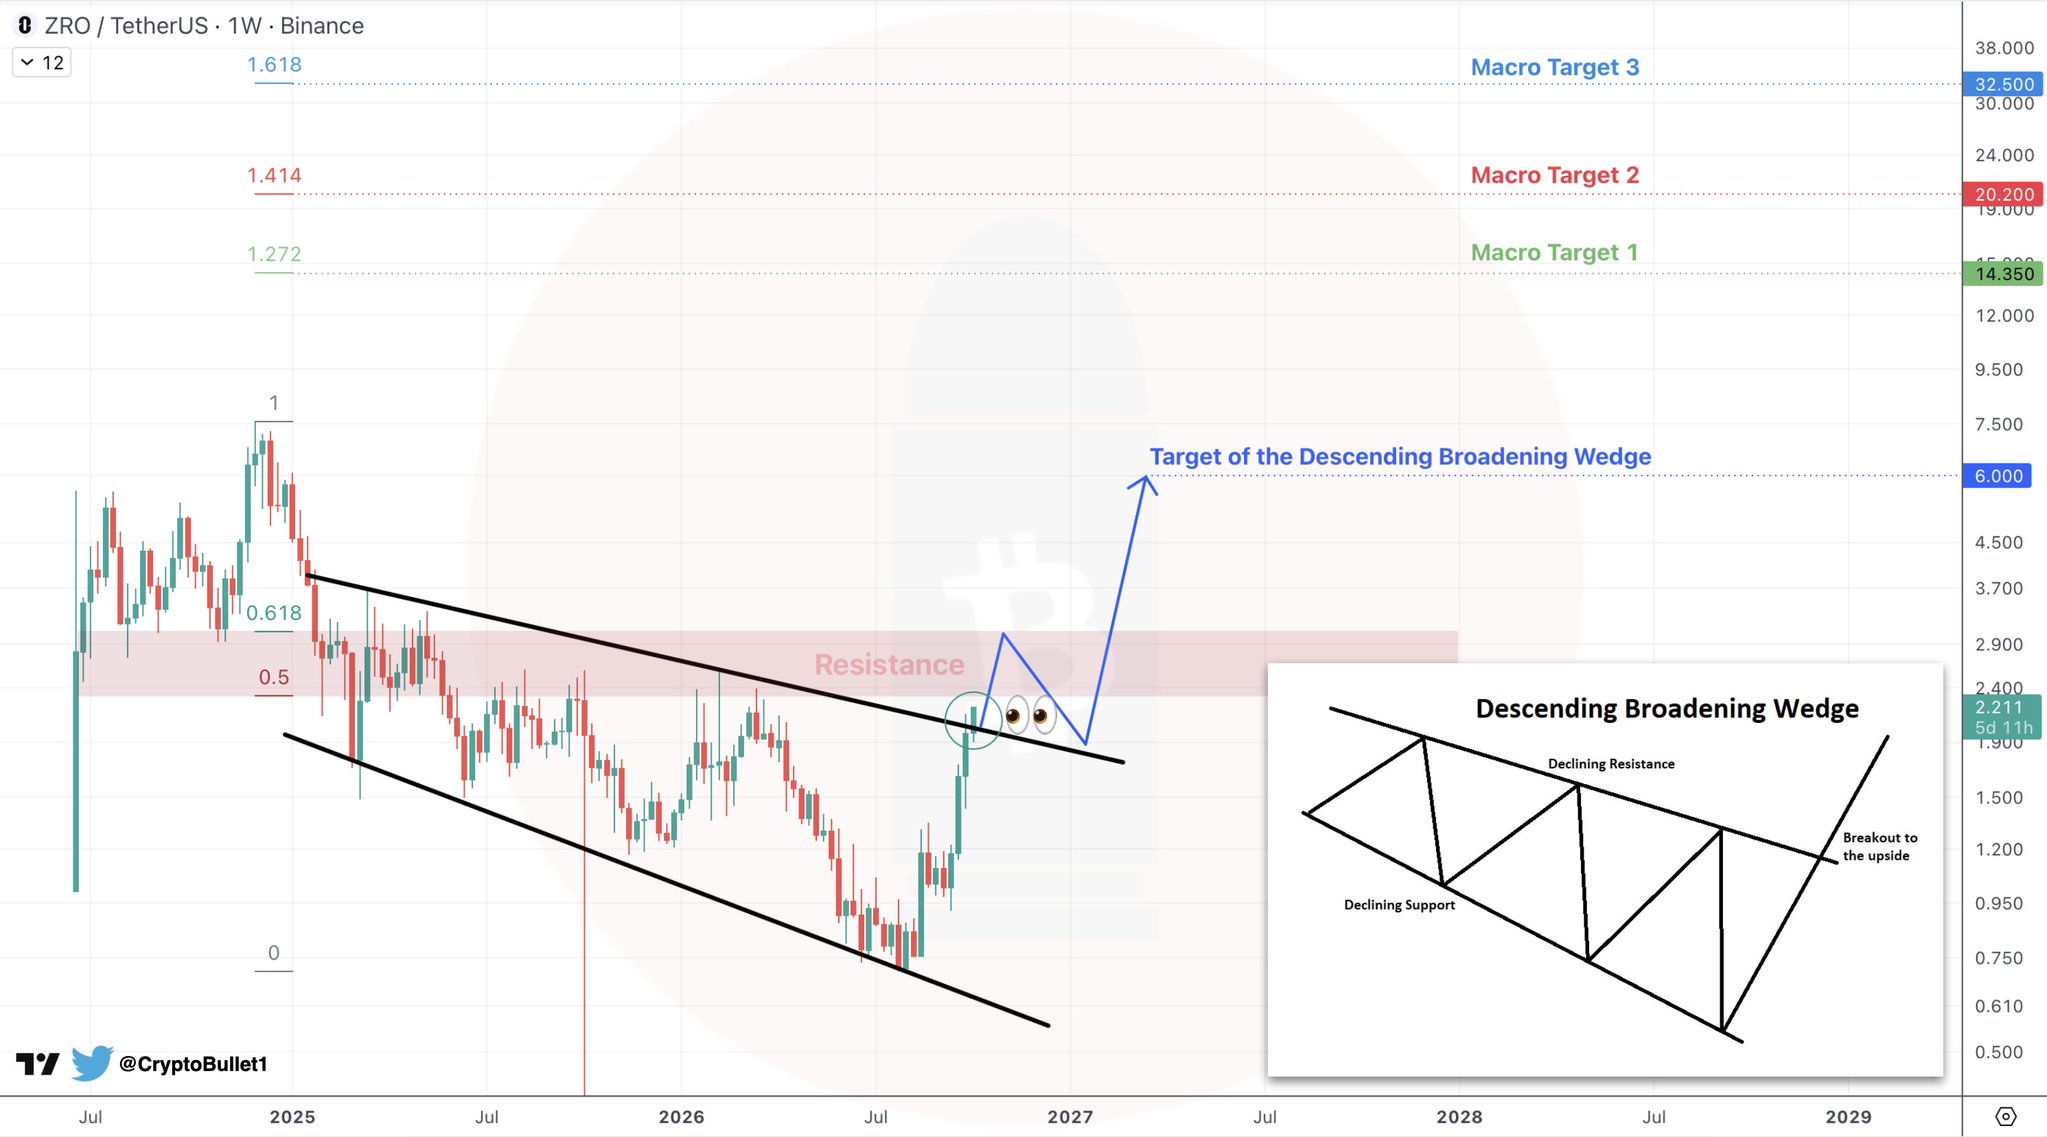
- ZRO is trading at ~$2.21, pressing against the upper boundary of a weekly Descending Broadening Wedge per @CryptoBullet1
- Wedge measured move targets $6.00 (+171% from current price) as the first technical destination
- Macro targets: $14, $20, and $32 across 2027-2029 — representing up to +1,348% from $2.21
- Bearish invalidation: weekly close back below the breakout zone near $1.90 resets the structure
LayerZero (ZRO) is printing one of the more consequential pattern breakouts in the current altcoin cycle — a confirmed exit from a Descending Broadening Wedge on the weekly chart, a structure that, when resolved to the upside, has historically produced outsized multi-stage moves. At the time of writing, ZRO is trading at approximately $2.21, pressing against the upper boundary of a formation that has contained price since the asset’s post-launch decline.
The setup is being flagged by analyst @CryptoBullet1, who posted the macro chart on October 6, 2026, stating: “$ZRO is currently breaking out of this huge Descending Broadening Wedge. I’m still pretty bullish on $ZRO, I think it will be a great runner in 2027-2029.” His price sequence is explicit: a wedge target at $6, followed by macro targets at $14, $20, and $32. These are not short-term swing levels — they represent a multi-year thesis extending through 2027-2029.
The Descending Broadening Wedge — What It Is and Why It Matters
A Descending Broadening Wedge is defined by two diverging, downward-sloping trendlines — a falling upper resistance and a falling lower support — with price oscillating between them in increasingly wide swings. The pattern is counterintuitive: the expanding volatility and consecutive lower lows create the appearance of accelerating weakness, yet the structure is classified as a bullish reversal formation. The mechanism is capitulation exhaustion — sellers repeatedly overextend, buyers absorb at progressively wider levels, and the eventual breakout above the upper trendline releases the compressed energy from the entire formation.
On the ZRO weekly chart shared by @CryptoBullet1, the Fibonacci grid overlaid on the pattern assigns the current breakout zone near the 0.618 retracement level — a cluster the chart labels between approximately $1.90 and $2.40. The current price of ~$2.21 sits inside this breakout zone. The chart explicitly labels three macro target coordinates: $14.35 (Macro Target 1), $20.20 (Macro Target 2), and $32.50 (Macro Target 3) — with the analyst’s stated figures of $14, $20, and $32 aligning closely with these chart annotations.
The Price Sequence — Wedge Target First, Macro Targets Second
@CryptoBullet1 structures the thesis in two distinct phases. The first is the wedge measured move — a near-term target of $6.00, derived from the height of the broadening wedge projected from the breakout point. At $2.21, that represents a move of approximately +171% from current price to the first technical target. The chart’s “Wedge Target” arrow explicitly points to the $6.00 level.
The second phase is the macro sequence: $14 → $20 → $32, which the analyst frames as the 2027-2029 runner thesis. These are not sequential price targets that must be hit in order within a short window — they represent staging posts in a multi-year advance. From $2.21, the move to $32 would constitute a gain of approximately +1,348% from the current price. The chart’s Fibonacci structure places $32.50 near the 1.618 extension level of the prior range — a measurement consistent with how broadening wedge breakouts are conventionally projected.
Why a Broadening Wedge Breakout Carries Weight on the Weekly Timeframe
Pattern significance scales with timeframe. A broadening wedge on a 15-minute chart is noise. On the weekly chart — where each candle represents seven days of price discovery — the structure has been building for months. The longer the compression, the more supply has been absorbed at progressively lower prices, and the larger the potential reaction when the upper trendline is cleared. @CryptoBullet1’s use of the weekly chart is deliberate: this is a macro setup, not a scalp. His 2027-2029 timeframe for the macro targets is consistent with the scale of the formation being broken.
The Fibonacci retracement grid on the chart — spanning from the 0 base level to the full 1.618 extension — gives each target coordinate a structural anchor. The wedge target at $6 sits near the 1.272 extension zone visible on the chart’s price axis. The macro targets at $14.35, $20.20, and $32.50 correspond to the chart’s labeled zones at progressively higher extensions.
Bullish Scenario
A weekly close above the wedge’s upper trendline — confirmed at current price levels above $2.21 — opens the measured move to $6.00 as the first technical destination. Sustained momentum through $6 would then target the macro sequence: $14.35, $20.20, and $32.50 across the 2027-2029 window, per @CryptoBullet1’s thesis.
Bearish Scenario
A weekly close back inside the wedge — a rejection below the upper trendline with price returning below the breakout zone near $1.90 — would invalidate the current breakout attempt and reset the formation. In that case, the lower boundary of the wedge near $0.50–$0.61 (as labeled on the chart axis) would become the next structural test.
The One Variable the Chart Cannot Answer
Pattern analysis identifies structure — it does not guarantee continuation. The Descending Broadening Wedge breakout on the ZRO weekly chart is a technical event. Whether it sustains depends on whether demand for LayerZero’s cross-chain messaging infrastructure grows in the 2026-2029 cycle. @CryptoBullet1’s confidence in ZRO as a “great runner in 2027-2029” is explicitly a fundamental bet alongside the technical setup — not purely a chart call. The wedge provides the setup; protocol adoption and ecosystem expansion provide the fuel. Traders should track whether the $6 wedge target holds as support on any retest before applying the macro targets.
Frequently Asked Questions
What is a Descending Broadening Wedge and why is it bullish for ZRO?
What is the first price target after ZRO’s wedge breakout?
When does @CryptoBullet1 expect ZRO to reach its macro targets of $14, $20, and $32?
What price level would invalidate ZRO’s broadening wedge breakout?
Source: Cryptobullet1 · Published by CoinsProbe Markets Desk
The opinions and market insights shared on CoinsProbe represent the views of individual authors based on prevailing market conditions at the time of publication. Cryptocurrency investments carry significant risk and volatility. Readers are encouraged to conduct their own research and seek professional financial advice before making investment decisions. CoinsProbe and its contributors do not accept responsibility for financial losses or decisions made based on published content.
CoinsProbe may publish sponsored articles, affiliate links, or promotional collaborations. All sponsored material is clearly labeled to maintain transparency with our audience. Our editorial decisions remain fully independent, and advertising partnerships do not influence reviews, rankings, or published opinions.
Since 2023, CoinsProbe has delivered reliable insights on cryptocurrency, blockchain, and digital assets. Our content is created by experienced researchers and analysts who follow strict editorial standards focused on accuracy, transparency, and credibility. Every article is carefully reviewed and verified using trusted sources and current market data. We provide unbiased analysis and timely updates covering everything from emerging crypto projects to major industry developments.