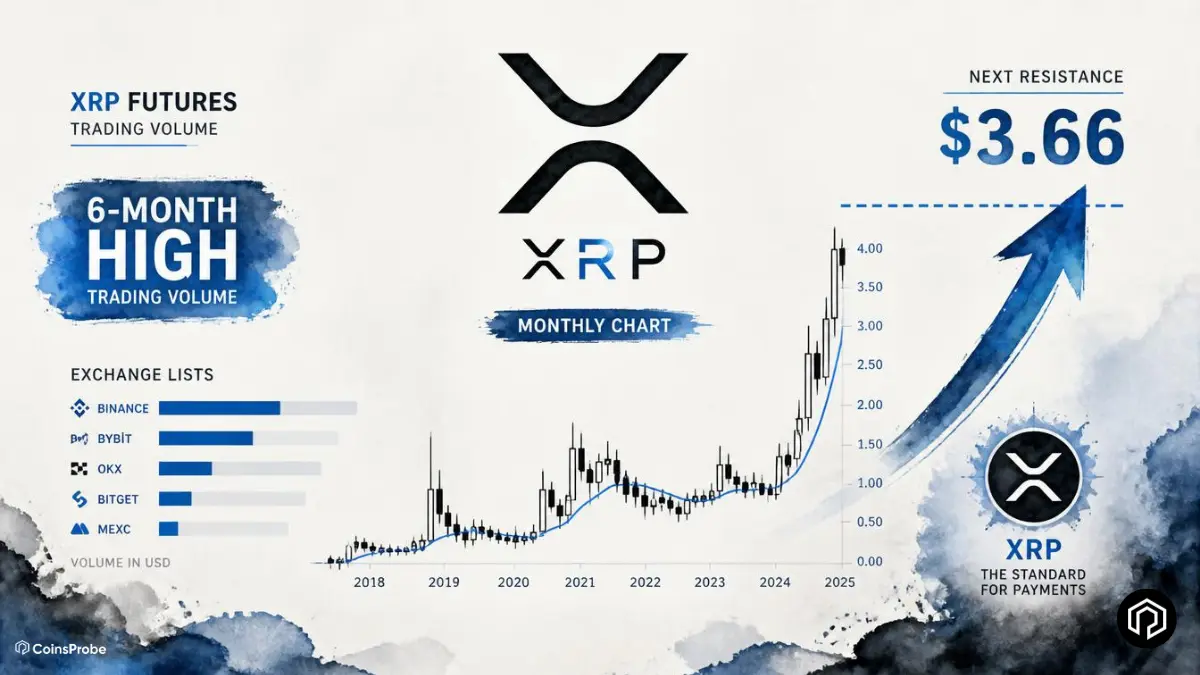
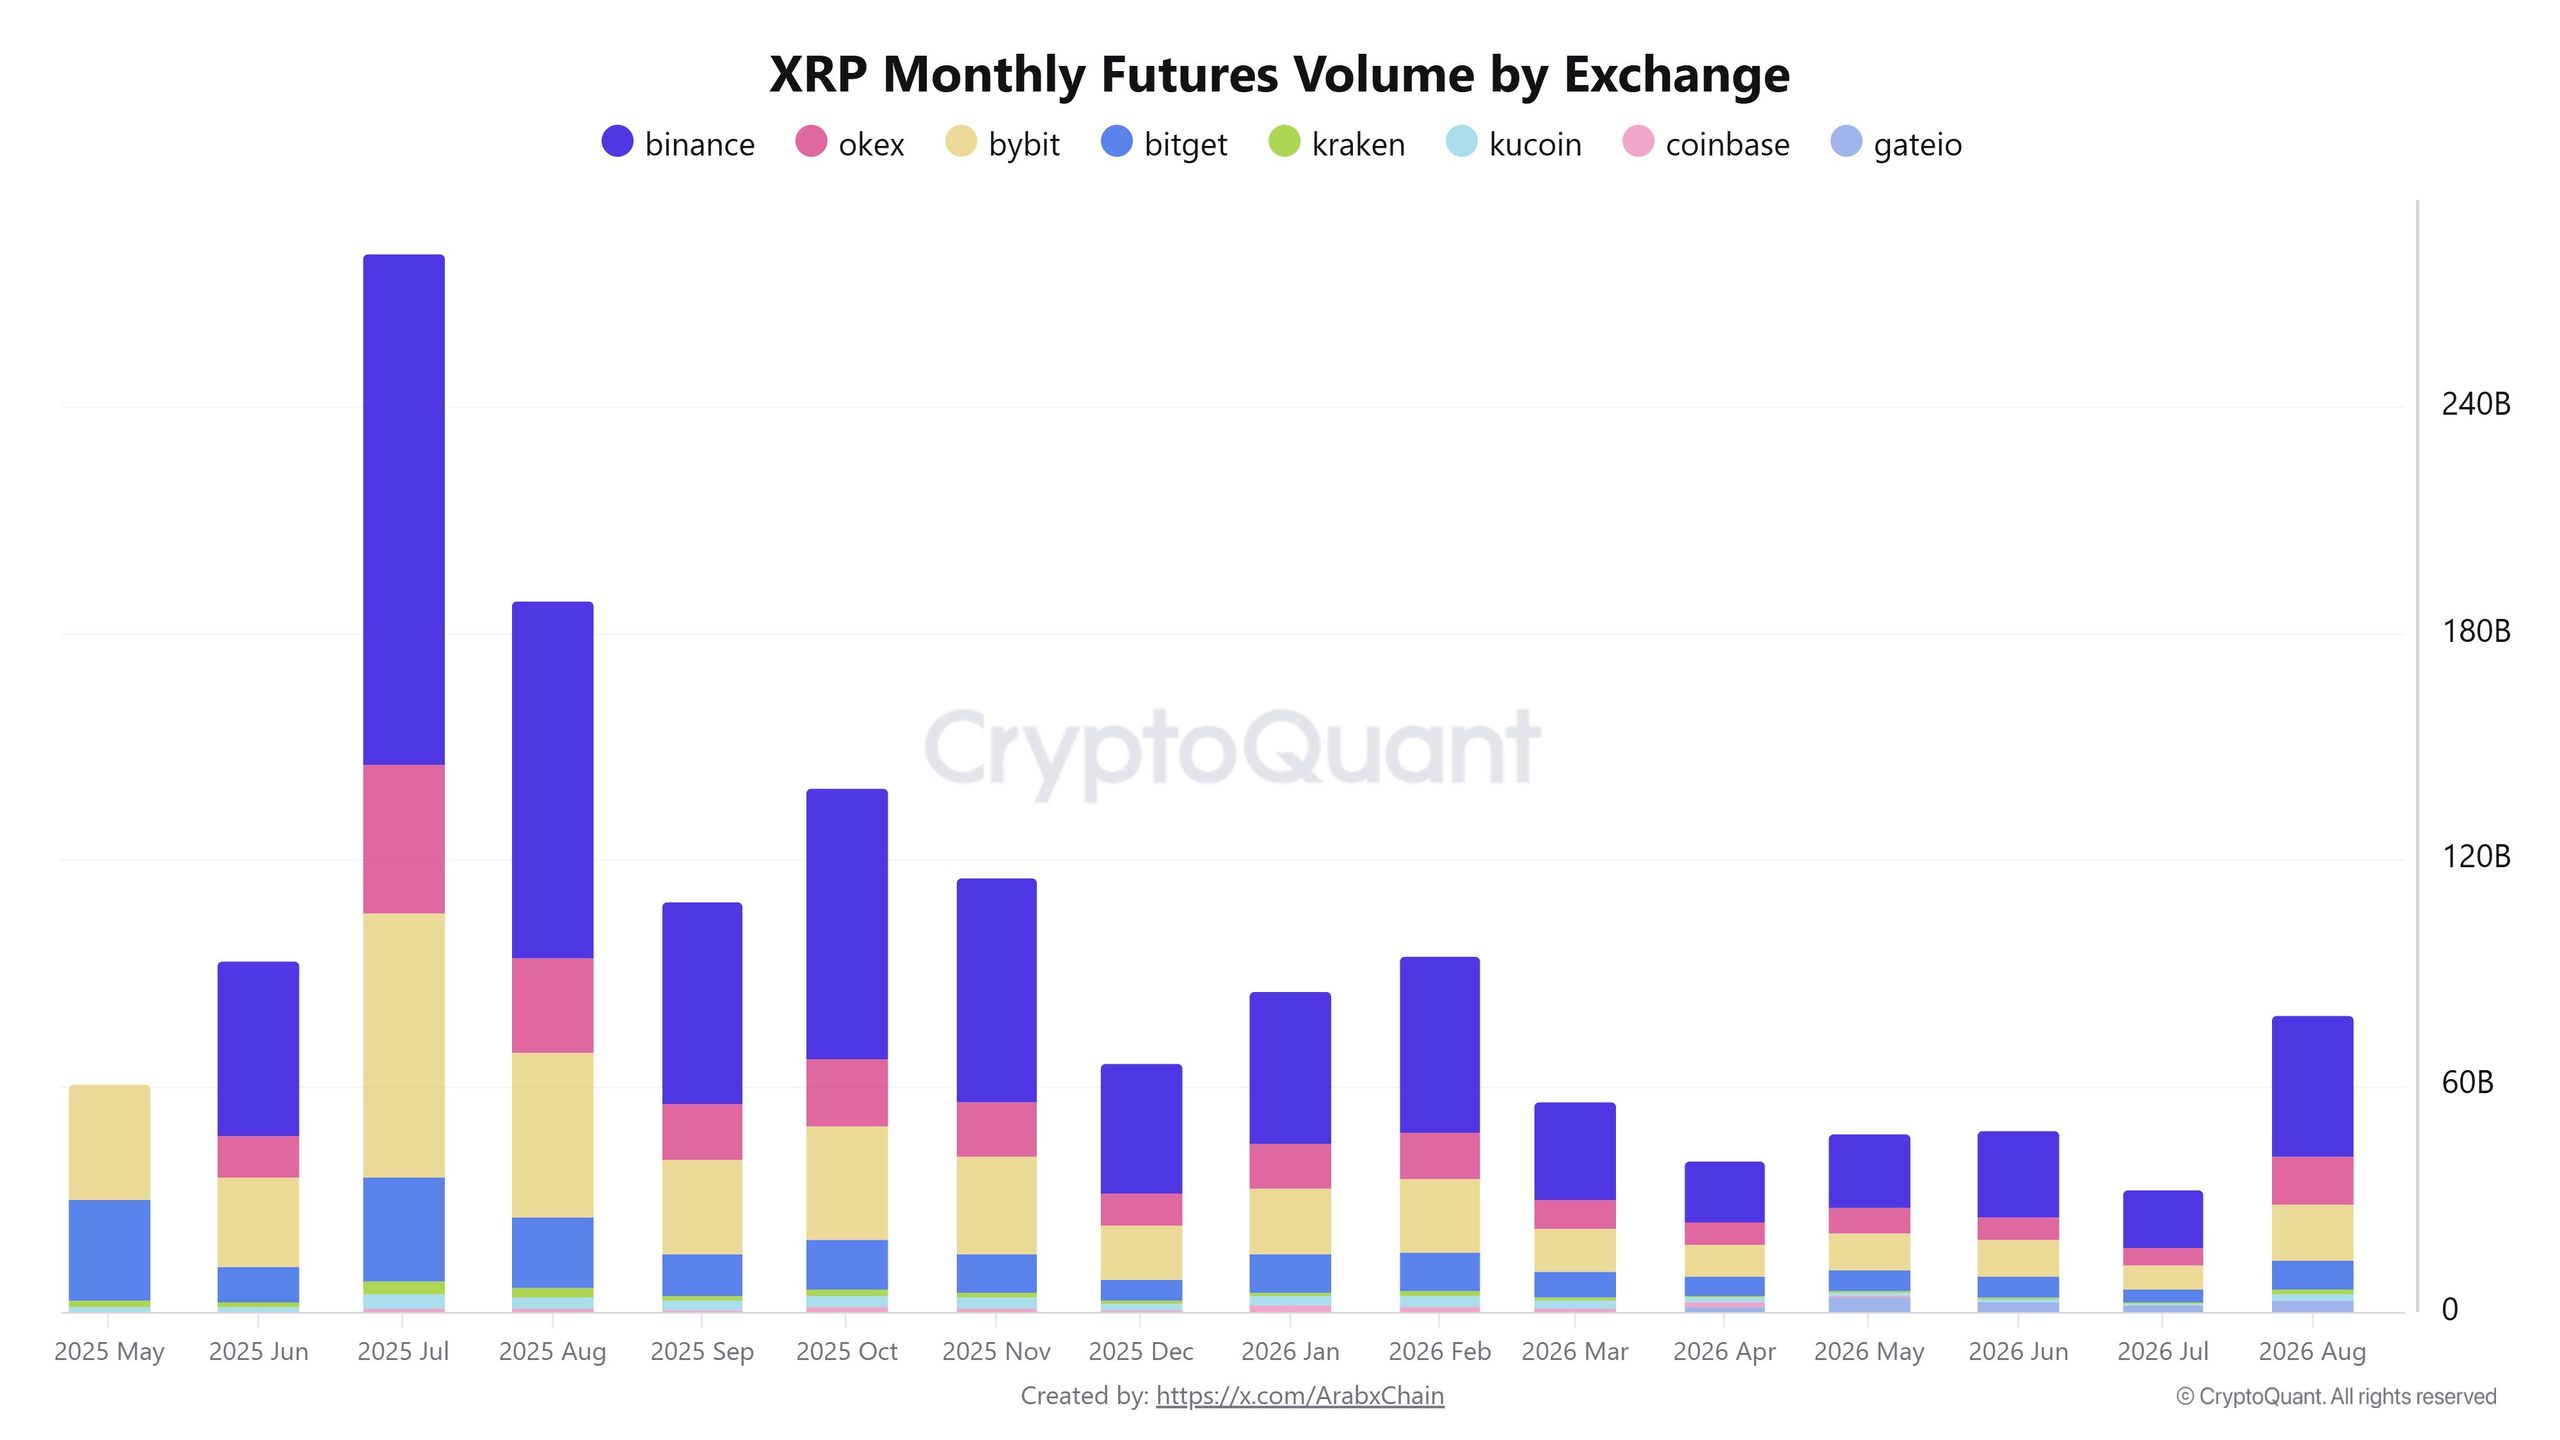
- XRP August futures volume reached a 6-month high with over $64.6 billion across Binance, Bybit, and OKX — the strongest monthly derivatives print since February 2026 — confirming traders returned to XRP after months of thin activity.
- Analyst Ali Charts (@alicharts) identifies a decade-long monthly ascending triangle on XRP — with $3.66 as the breakout level that activates a measured move target of approximately $60, via intermediate markers at $9.49, $15.60, $31.87, and $57.40.
- XRP is trading at $1.39 — down 1.58% in 24 hours but up 34.49% over 30 days — sitting above the rising monthly support trendline while the $3.66 monthly close remains the confirmation threshold for the full pattern.
XRP is operating on two distinct timeframes simultaneously — and the story on each is different. In the short term, August delivered the strongest monthly futures volume in six months, confirming that derivatives traders returned to XRP with conviction after a prolonged quiet period. In the long term, a monthly ascending triangle that has been building for nearly a decade is waiting for a single level — $3.66 — to activate one of the more striking measured move targets in the current altcoin landscape.
At the time of writing, XRP is trading at approximately $1.39 — down 1.58% in 24 hours but still up 34.49% over 30 days — with a market capitalization of approximately $87.28 billion.
As covered in our XRP macro bottom 3 bullish signals analysis and XRP trend reversal and ETF momentum breakdown, the structural case for XRP has been building through 2026 across multiple independent frameworks. The August futures volume rebound and the decade-long monthly triangle add the derivatives activity and long-term technical dimensions to that picture.

August Futures Volume Hits a 6-Month High — Derivatives Traders Return to XRP
The first major data point in the current XRP setup comes from CryptoQuant data highlighted by on-chain analyst Arab Chain (@ArabxChain): XRP futures trading volume in August 2026 climbed to a six-month high — the strongest monthly derivatives print since February.
The August Volume Breakdown
The three largest futures venues accounted for more than $64.6 billion in combined August volume:
| Exchange | August Futures Volume |
|---|---|
| Binance | ~$37 billion |
| Bybit | ~$14.54 billion |
| OKX | ~$12.88 billion |
| Combined Total | $64.6 billion+ |
The stacked exchange chart shows August volume climbing back above $60 billion — a clear break from the low-activity stretch that characterized XRP derivatives through April, May, June, and July 2026. July, in particular, marked one of the weakest monthly derivatives months of the year for XRP. August’s reversal to $64.6 billion represents a decisive return of trader interest after that multi-month quiet period.
What the Volume Spike Actually Means — And What It Doesn’t
High futures volume is not inherently bullish — and the distinction matters for interpreting the August data correctly.
Futures volume captures activity from both long and short positions — a volume spike can represent aggressive buying, aggressive shorting, or a contested two-sided market where both bulls and bears are adding exposure simultaneously. The August $64.6 billion reading tells us that derivatives traders returned to XRP in size. It does not tell us which direction they were positioned.
What the volume data does confirm with certainty:
Liquidity returned: After months of thin derivatives activity, August brought meaningful capital back to XRP futures across the three largest venues. Thin liquidity markets are more volatile and less efficient — deeper liquidity creates more stable price discovery.
Trader interest is back: $64.6 billion in monthly futures volume across three exchanges represents active institutional and retail derivatives participation — the kind of engagement that tends to accompany and sustain directional price moves rather than appearing in quiet, directionless markets.
Correlation with August performance: CryptoQuant noted that the volume pickup coincided directly with XRP’s stronger August price performance (+34.49% over 30 days). The causal direction is bidirectional — stronger price action attracted more futures traders, and futures activity amplified the directional move in both cases.
This pattern of derivatives returning alongside price recovery is consistent with what we documented in our Bitcoin whale accumulation and CryptoQuant on-chain signals analysis — where smart money positioning through derivatives and spot markets together creates more durable directional moves than either channel alone.
Ali Charts: Monthly Ascending Triangle — $3.66 Is the Line, $60 Is the Target
The second and longer-timeframe signal comes from analyst Ali Charts (@alicharts), whose analysis of XRP’s monthly chart identifies one of the more structurally significant pattern setups in the current crypto market — one that has been building for nearly a decade.
The Pattern — A Decade-Long Ascending Triangle
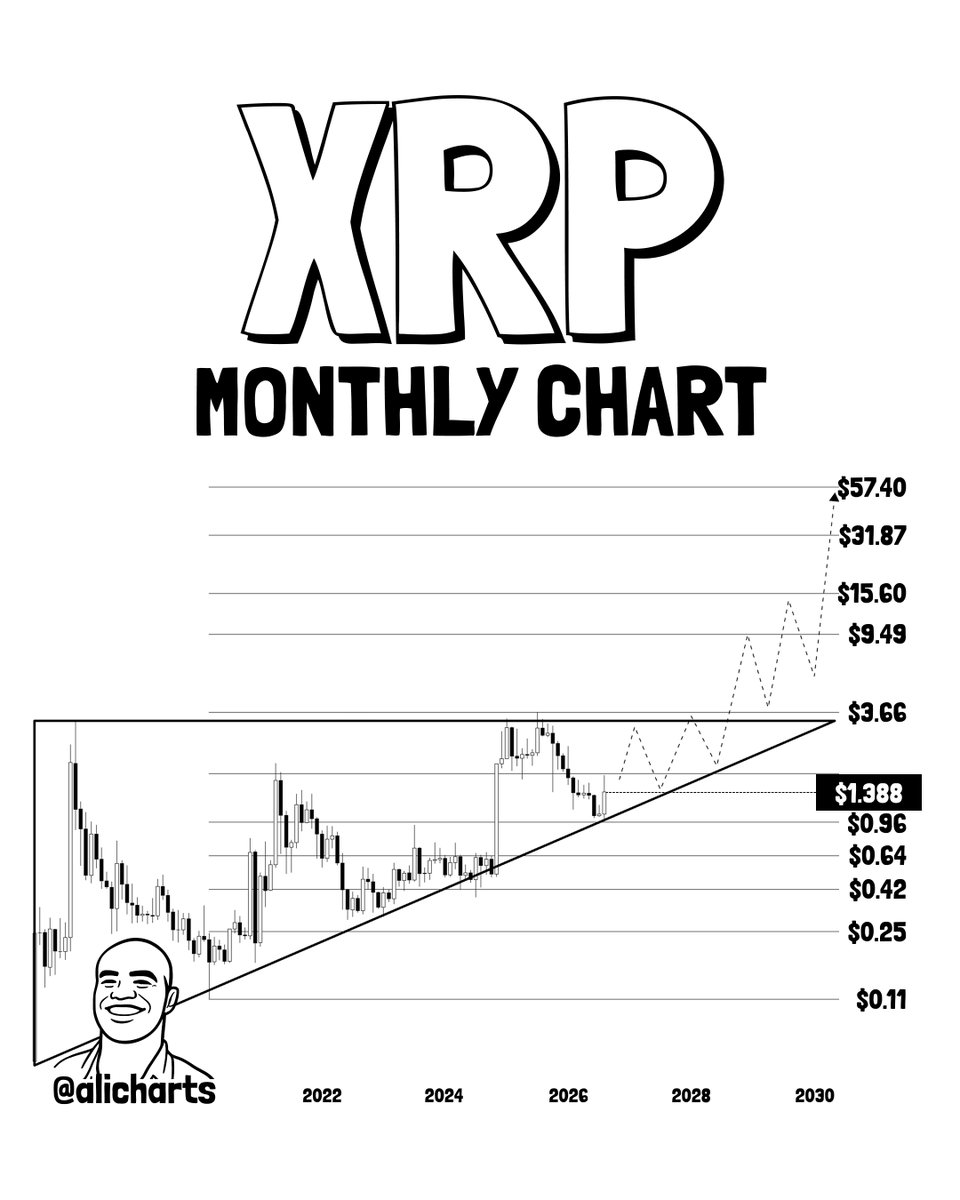
An ascending triangle is a technical pattern characterized by:
- A flat horizontal resistance line at the top — in XRP’s case, the $3.66 level
- A rising support trendline at the bottom — which XRP has been respecting across multiple cycles
- Progressively higher lows as price compresses toward the apex of the triangle
The longer a triangle builds before resolving, the more significant the eventual breakout tends to be — because longer patterns represent more sustained accumulation and more stored energy for the directional resolution. A monthly ascending triangle that has been developing for nearly a decade represents one of the most compressed and potentially powerful setups available in technical analysis.
At the current price of $1.39, XRP is:
- Above the rising monthly support trendline — the lower boundary of the triangle is intact
- Well below the $3.66 flat top resistance — the breakout level has not been tested yet
The $3.66 Level — Why It Is the Only Level That Matters
Ali Charts’ analysis is precise about what is required for the pattern to activate: a monthly close above $3.66. Not an intraday touch. Not a weekly close. A sustained monthly closing price above $3.66 — the flat top resistance that has defined the upper boundary of the triangle across multiple years and multiple bull and bear cycles.
The specificity of the monthly close requirement reflects the timeframe of the pattern. A decade-long monthly triangle is not confirmed by a daily or weekly move — it requires the same timeframe (monthly) to produce the breakout confirmation.
The Intermediate Upside Markers and Final Target
The chart currently labels price around $1.388, sitting above the rising support trendline and well below the flat top of the triangle. Intermediate upside markers on the projection include $9.49, $15.60, $31.87, and $57.40.Until XRP reclaims $3.66 on a monthly close, that $60 target remains a long-term measured move, not an active breakout. The immediate structure still depends on holding the rising monthly support and rebuilding strength after the latest pullback.
What Is Required Before $60 Becomes Relevant
Ali Charts is explicit about the current status: until XRP produces a monthly close above $3.66, the $60 target remains a long-term measured move projection — not an active breakout that has been triggered. The full target is the mathematical outcome of the pattern completing. The pattern has not yet completed.
The immediate priority before the longer-term target becomes actionable is holding the rising monthly support trendline — the lower boundary of the triangle that price is currently respecting. A sustained monthly close below the rising support would weaken the ascending triangle structure and delay the breakout thesis.
Bullish vs. Bearish Scenarios
Bullish Scenario
XRP holds the rising monthly support trendline and continues building higher lows within the ascending triangle structure. Futures volume sustains above the $40–$50 billion monthly range — confirming that August’s rebound was a structural rather than temporary return of derivatives interest. Over subsequent months, XRP recovers toward the $3.66 monthly close threshold — the confirmation level that would activate the full triangle measured move toward $60 via the intermediate markers at $9.49, $15.60, $31.87, and $57.40.
Bearish Scenario
XRP loses the rising monthly support trendline on a sustained monthly close basis — breaking the ascending triangle’s lower boundary and indicating that the decade-long pattern has failed to hold its structural integrity. In this scenario, the $3.66 breakout thesis is delayed significantly and lower support levels come into focus. The short-term futures volume rebound would prove to have been activity rather than structural demand, and XRP would require a new base-building phase before the ascending triangle thesis can be reactivated.
Bottom Line
XRP is presenting a two-speed analytical picture that requires different lenses for different timeframes. In the short term, $64.6 billion in August futures volume — the highest in six months — confirms that derivatives traders returned to XRP after a multi-month quiet stretch, consistent with and contributing to the 34.49% monthly price performance. In the long term, a decade-long monthly ascending triangle is waiting for a $3.66 monthly close to activate a measured move that projects toward $60 via intermediate targets at $9.49, $15.60, $31.87, and $57.40.
The rising monthly support trendline — currently being respected — is the immediate structural level to watch. The $3.66 monthly close is the level that converts the long-term pattern from a forming structure into a confirmed breakout. Everything between the current price of $1.39 and those two levels defines the near-to-medium term XRP framework.
Frequently Asked Questions
Did XRP futures volume rise in August 2026?
Yes. CryptoQuant data shared by Arab Chain shows August futures volume hit a six-month high, with Binance, Bybit, and OKX combining for more than $64.6 billion.
Which exchange led XRP futures volume in August?
Binance led with about $37 billion, followed by Bybit at $14.54 billion and OKX at about $12.88 billion.
What is XRP’s long-term bullish target on the monthly chart?
Ali Charts says XRP has been forming a multi-year ascending triangle, and a monthly close above $3.66 would activate a technical target near $60.
Does higher futures volume mean XRP will rally?
Not by itself. Higher futures volume shows liquidity is returning, but it can come from both longs and shorts. Price structure and a monthly close above $3.66 remain the key confirmation levels.
The opinions and market insights shared on CoinsProbe represent the views of individual authors based on prevailing market conditions at the time of publication. Cryptocurrency investments carry significant risk and volatility. Readers are encouraged to conduct their own research and seek professional financial advice before making investment decisions. CoinsProbe and its contributors do not accept responsibility for financial losses or decisions made based on published content.
CoinsProbe may publish sponsored articles, affiliate links, or promotional collaborations. All sponsored material is clearly labeled to maintain transparency with our audience. Our editorial decisions remain fully independent, and advertising partnerships do not influence reviews, rankings, or published opinions.
Since 2023, CoinsProbe has delivered reliable insights on cryptocurrency, blockchain, and digital assets. Our content is created by experienced researchers and analysts who follow strict editorial standards focused on accuracy, transparency, and credibility. Every article is carefully reviewed and verified using trusted sources and current market data. We provide unbiased analysis and timely updates covering everything from emerging crypto projects to major industry developments.