
- ETH trading at $2,675.82 (-0.46% 24h) with a 1-hour bull flag tightening near apex per @alicharts
- $2,700 hourly close is the confirmed breakout trigger — less than 1% from current price
- Measured pattern targets: $2,800 → $2,950 → $3,100 (+15.7% from current price)
- $2,640 is the invalidation floor — a close below risks flush to $2,450–$2,300
Ethereum is trading at $2,675.82 — down a marginal 0.46% in the past 24 hours against a market cap of $326.7 billion — while its short-term structure is quietly tightening into one of the cleanest continuation setups of the current cycle. The consolidation is not weakness. It is compression before release.
That is the direct read from crypto analyst Ali Martinez (@alicharts), who identifies Ethereum as forming a textbook bull flag on the 1-hour chart. His exact words: “$ETH appears to be forming a bull flag on the lower timeframes. As long as $2,640 continues to hold as support, the setup favors the bulls. Now I’m watching $2,700. An hourly close above that level could confirm the breakout.”
The Setup — A Flagpole, a Wedge, and One Trigger Level
A bull flag is a two-part structure. First, a sharp directional move — the flagpole — driven by genuine buying pressure. Then a controlled, lower-volume consolidation that forms a descending channel or wedge, bleeding off excess momentum without surrendering the structural gain. The pattern resolves when price breaks the upper boundary of the wedge with conviction, resuming the original trend.
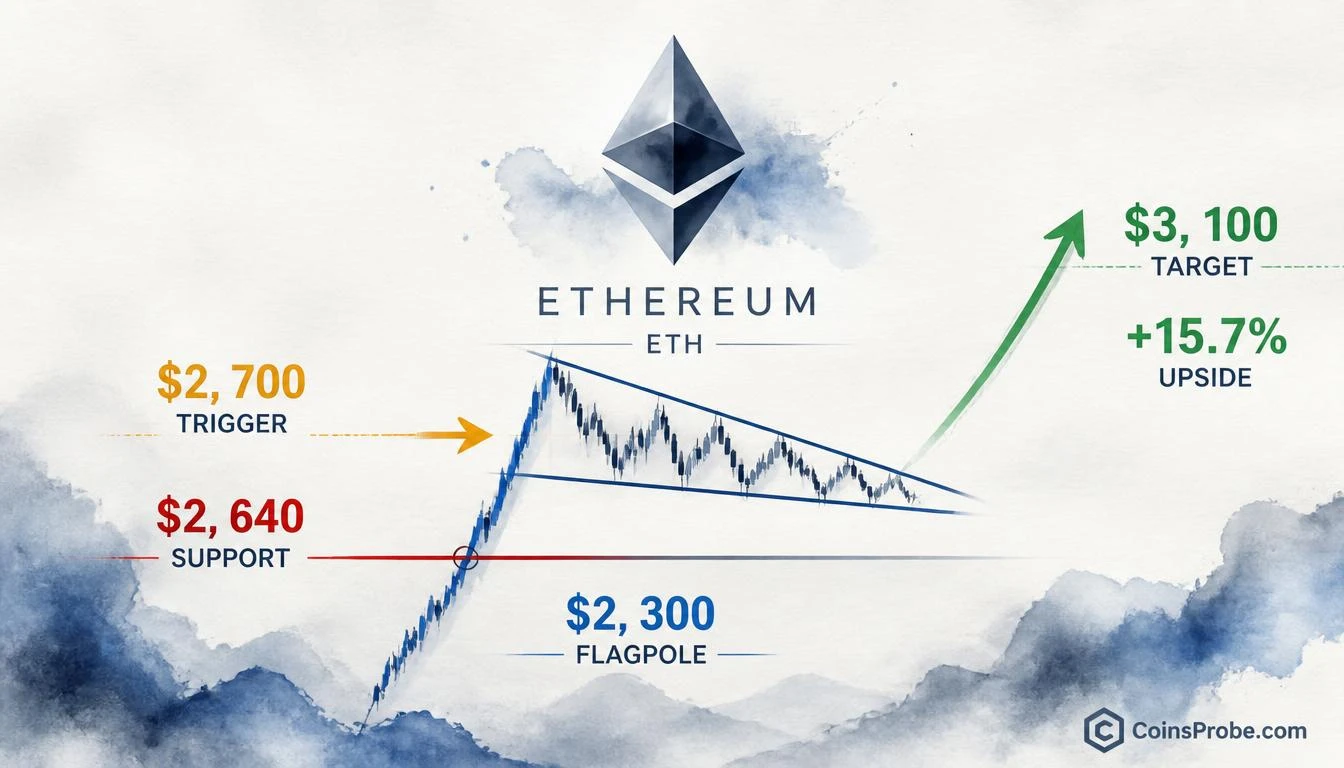
On the ETH 1-hour chart shared by @alicharts, the flagpole originated near $2,300, producing the sharp rally leg. From approximately September 23 through October 1, price consolidated into a descending wedge — the flag itself — with the structure now tightening toward its apex. The longer compression holds without breaking support, the more energy accumulates behind the eventual break.
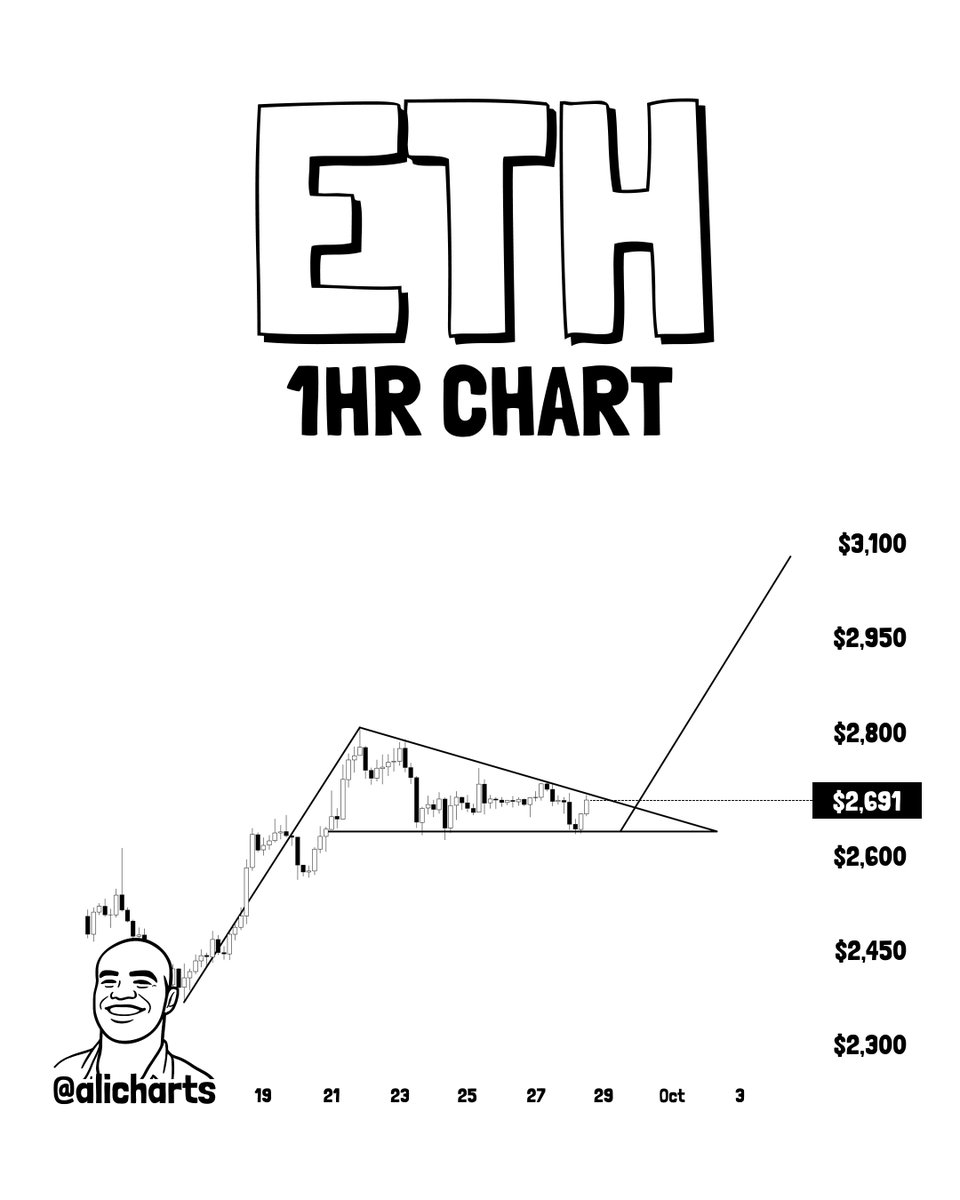
The chart identifies three price levels that define the entire trade structure: $2,640 as active support and the invalidation boundary; $2,700 as the immediate confirmation trigger; and $2,800 as the upper trendline of the flag. Above $2,800, the measured targets extend to $2,950 and then $3,100. From current price of $2,675.82, the move to $3,100 represents +15.7% remaining upside if the pattern completes as measured.
Why $2,700 — The Hourly Close Rule
Martinez is not watching $2,700 as a price touch. He is watching it as a confirmed hourly close above that level. The distinction matters. Intraday wicks above a resistance level are noise — they represent order flow testing liquidity, not structure changing. A closing price above $2,700 on the 1-hour chart means buyers absorbed every attempt to sell the level and held it through the candle’s close. That is a different signal entirely.
At current price of $2,675.82, ETH sits $24.18 — less than 1% below that trigger. The compression is already in its final stage. The wedge apex is near. Volume will confirm or deny the move.
The $2,640 Line — Where the Setup Lives or Dies
Every bull flag has an invalidation. Here it is $2,640. This level is not arbitrary — it represents the lower boundary of the current consolidation range and the structural support that has held throughout the flag formation. As long as it holds, the setup remains intact and bulls retain control of the pattern’s internal logic.
A break below $2,640 on a closing basis does not simply delay the pattern — it negates it. The chart analysis points to $2,450–$2,300 as the flush target if support fails, a range that would erase the bulk of the flagpole’s initial rally. That is a -8.5% to -14% move from current price — the precise reason $2,640 is the level every ETH position holder is watching in real time.
For broader context on Ethereum’s fundamental trajectory, BlackRock’s continued push into the Ethereum ETF market provides the institutional backdrop against which this technical setup is forming.
Bullish and Bearish Scenarios
Bullish Scenario — Hourly Close Above $2,700
An hourly candle closing above $2,700 confirms the bull flag breakout. The immediate target becomes the upper flag resistance at $2,800, followed by the measured move targets at $2,950 and $3,100. From trigger to final target: approximately +14.8%. Volume expansion on the breakout candle is the critical confirmation — a low-volume close above $2,700 would be suspect.
Bearish Scenario — Loss of $2,640
A confirmed hourly close below $2,640 invalidates the bull flag. The wedge structure collapses, and the pattern’s measured risk points to $2,450–$2,300 as the next support cluster — a range representing -8.5% to -14% from current price. In this scenario, the consolidation recharacterizes from a flag to distribution, and the bias flips bearish until $2,640 is reclaimed.
The Structure in Summary
ETH is sitting inside a coiled 1-hour bull flag with less than 1% separating current price from the breakout trigger. The pattern has a clear support floor at $2,640, a defined trigger at $2,700, and a measured target sequence at $2,800 → $2,950 → $3,100. The risk and reward are precisely mapped. What is not mapped is the timing — only a confirmed hourly close above $2,700 opens that door. Until then, $2,640 remains the line that keeps the setup alive. Watch the next few hourly candles closely — the wedge is at its tightest point.
Frequently Asked Questions
What is a bull flag pattern and how does it apply to Ethereum right now?
Why is $2,700 the specific level analysts are watching for Ethereum?
What happens to the Ethereum bull flag setup if $2,640 breaks?
How much upside does the Ethereum bull flag measured move project?
Source: Ali Charts · Published by CoinsProbe Markets Desk
The opinions and market insights shared on CoinsProbe represent the views of individual authors based on prevailing market conditions at the time of publication. Cryptocurrency investments carry significant risk and volatility. Readers are encouraged to conduct their own research and seek professional financial advice before making investment decisions. CoinsProbe and its contributors do not accept responsibility for financial losses or decisions made based on published content.
CoinsProbe may publish sponsored articles, affiliate links, or promotional collaborations. All sponsored material is clearly labeled to maintain transparency with our audience. Our editorial decisions remain fully independent, and advertising partnerships do not influence reviews, rankings, or published opinions.
Since 2023, CoinsProbe has delivered reliable insights on cryptocurrency, blockchain, and digital assets. Our content is created by experienced researchers and analysts who follow strict editorial standards focused on accuracy, transparency, and credibility. Every article is carefully reviewed and verified using trusted sources and current market data. We provide unbiased analysis and timely updates covering everything from emerging crypto projects to major industry developments.