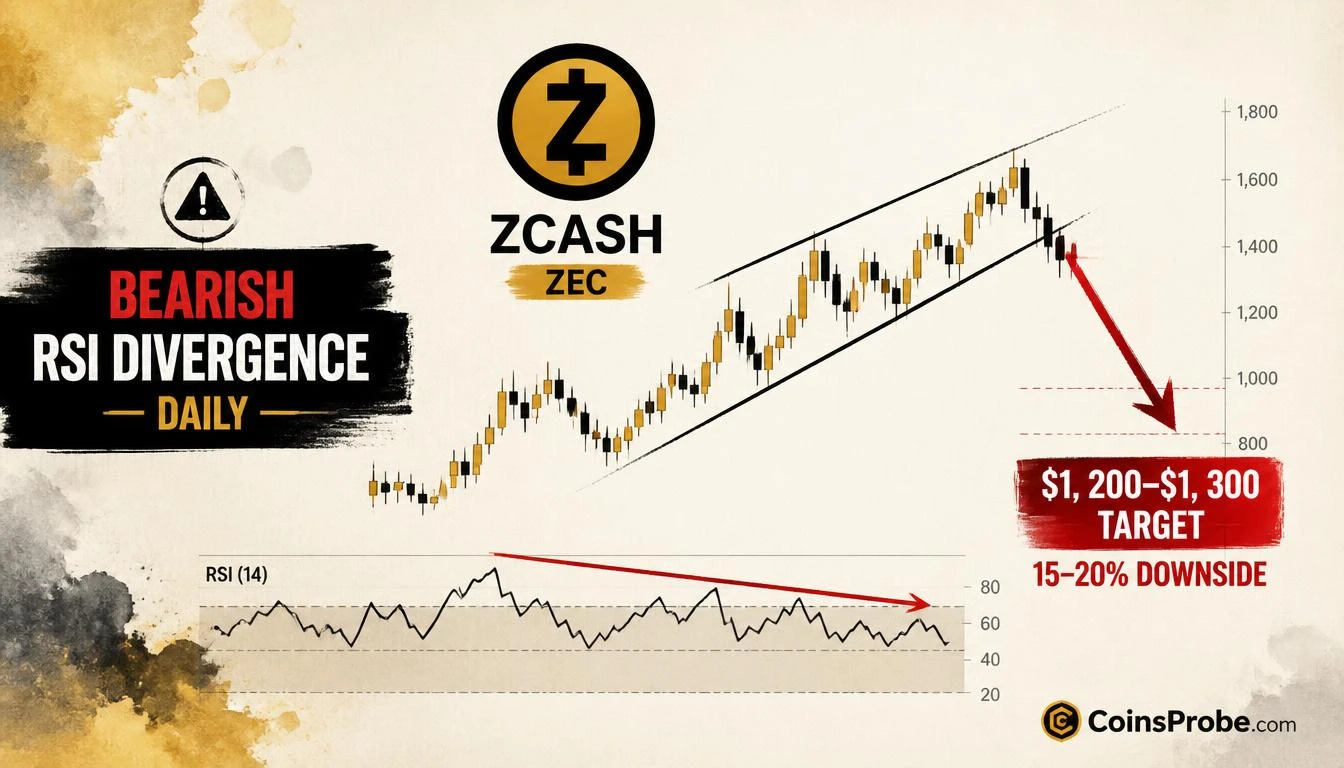

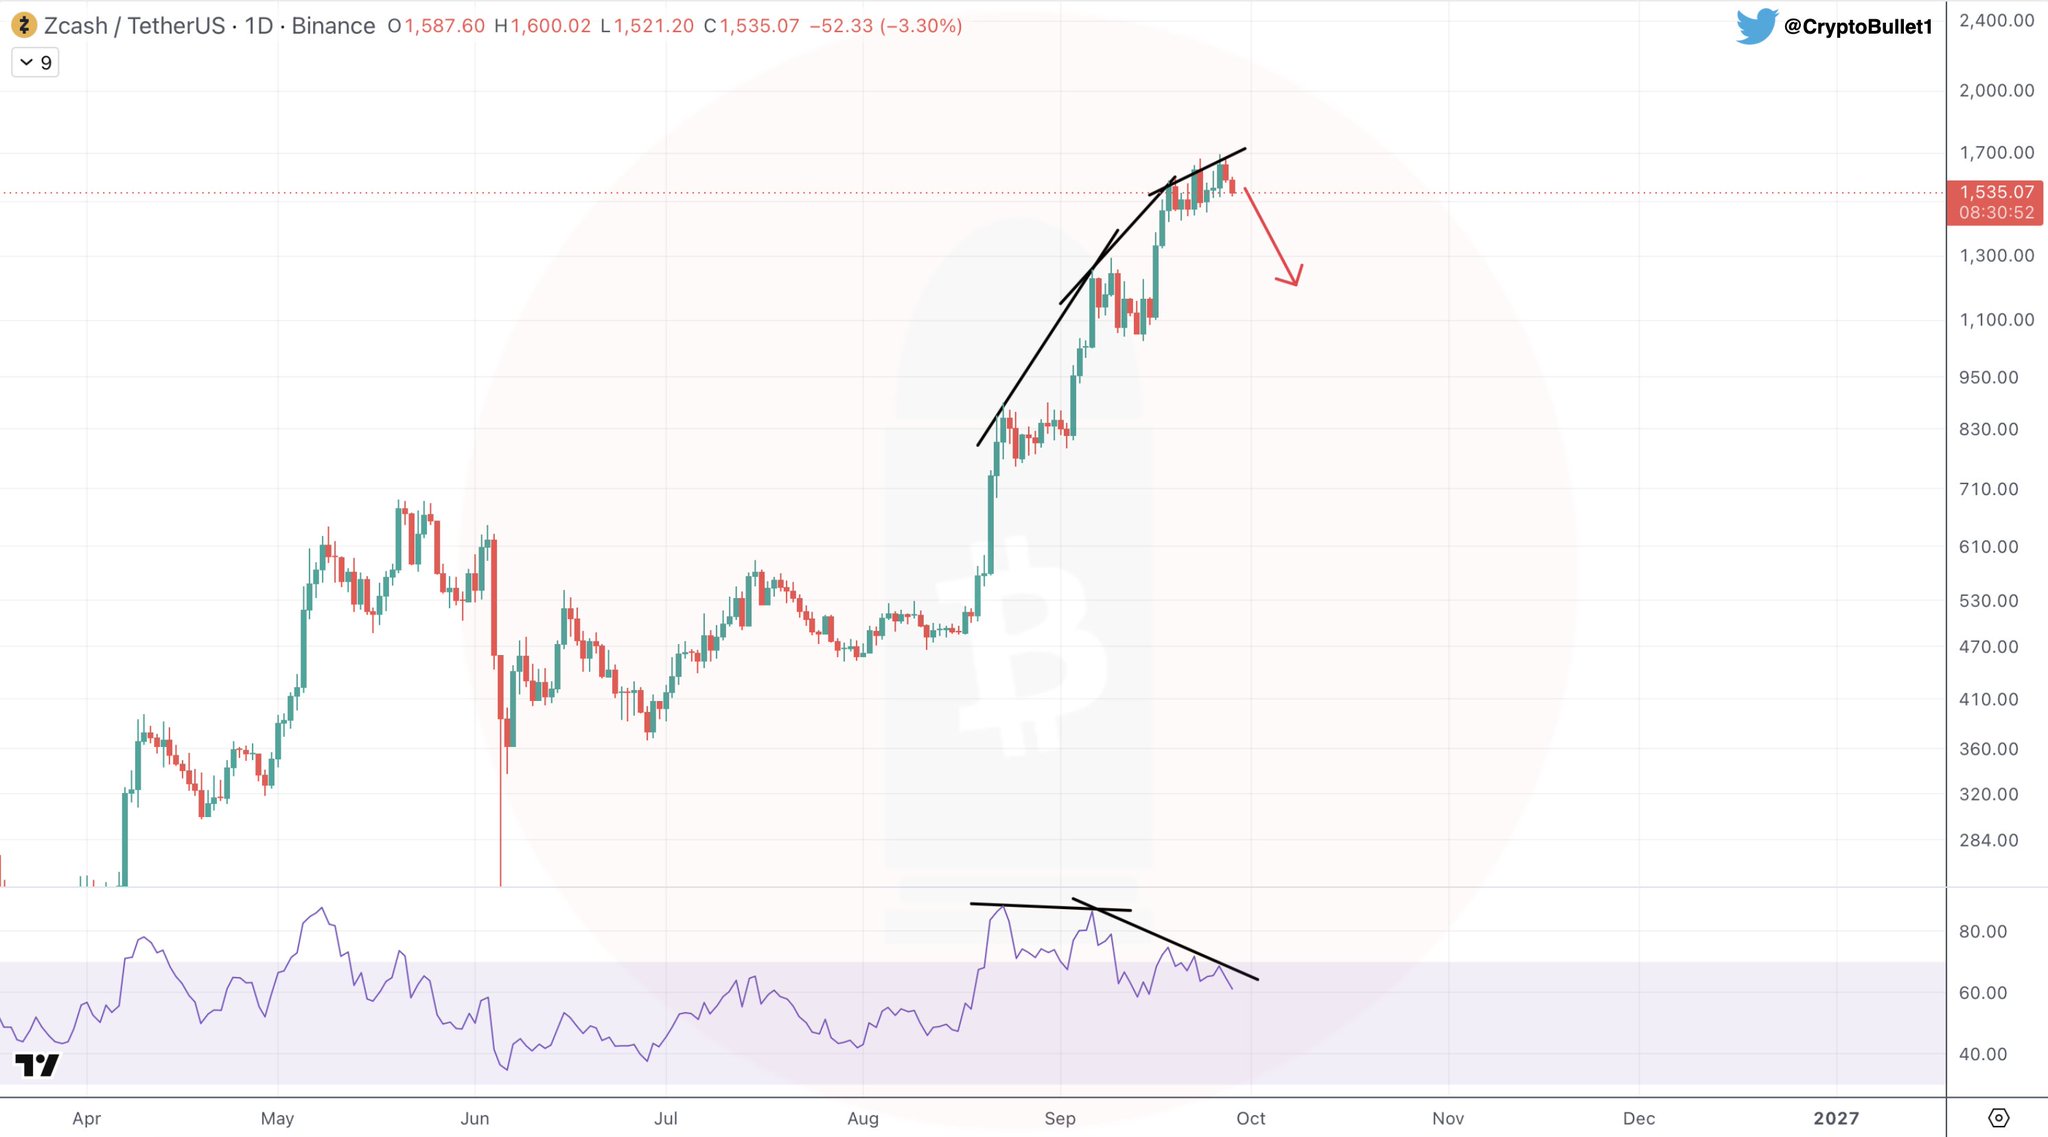
- ZEC daily chart shows bearish RSI divergence — price peaked ~$1,700 while momentum printed lower highs per @CryptoBullet1
- Rising wedge compounding the divergence signal — lower wedge boundary at ~$1,500 is the breakdown confirmation trigger
- Analyst target zone: $1,200–$1,300, representing a 15–20% decline from current levels near $1,535
- Divergence is invalidated only if ZEC closes above $1,700 with RSI simultaneously printing a higher high
Zcash (ZEC) is flashing a classic exhaustion signal on the daily chart — and the structure is unambiguous. Price climbed to a recent peak near $1,700 while the Relative Strength Index (RSI) simultaneously printed a lower high, forming a descending trendline on momentum. That disconnect — higher price, lower momentum — is the textbook definition of bearish divergence, and it is now confirmed on the daily timeframe.
The signal was identified by analyst CryptoBullet1 (@CryptoBullet1), who posted to X: “$ZEC shows signs of exhaustion on the daily 🧐 Bearish Divergence should play out 📉” — a direct, unhedged read on what the chart is communicating. The analyst’s projected breakdown trajectory targets the $1,200–$1,300 support zone, representing a potential decline of 15–20% from current levels near $1,535.
What Bearish RSI Divergence Actually Measures
RSI divergence is not a price pattern — it is a momentum pattern. The RSI measures the speed and magnitude of price changes on a 0–100 scale. When price makes a higher high but RSI makes a lower high, it signals that fewer buyers are participating in each successive push upward. Bulls are still winning price battles, but they are winning them with diminishing energy. Historically, this is how rallies end — not with a sharp reversal, but with a quiet loss of conviction followed by a sudden structural break.
In ZEC’s case, the momentum failure is compounded by a second pattern: a rising wedge on the price chart itself. Rising wedges — two converging trendlines sloping upward — are bearish exhaustion formations. They signal that buying pressure is narrowing even as price appears to climb. The combination of a rising wedge and negative RSI divergence on the same daily timeframe is a high-probability setup for breakdown, not continuation.
The Chart Setup — What @CryptoBullet1 Sees
The daily ZEC/USDT chart on Binance shows price peaked near $1,700 while the RSI panel simultaneously carved a descending trendline of lower highs. The two converging black trendlines on the price action define the rising wedge structure. CryptoBullet1’s red arrow projection indicates an expected breakdown from the wedge, with the measured move targeting the $1,200–$1,300 demand zone — the region that provided structural support before the current rally began. The critical line-in-the-sand level is the wedge’s lower boundary near $1,500: a daily close below that level would formally confirm the bearish setup and open the measured move downside.
Why This Setup Has Weight
Bearish RSI divergence on a daily chart is a slower-burn signal than intraday divergence — it takes more sessions to form, and when it resolves, it tends to do so with conviction. The daily timeframe filters out noise that would otherwise produce false signals on shorter charts. The fact that ZEC’s divergence is accompanied by a rising wedge — itself a pattern with a historical bearish resolution rate — means two independent analytical frameworks are pointing to the same conclusion simultaneously.
Context matters here. ZEC has attracted significant large-wallet activity during its recent run. One Zcash whale’s spot bag reached $220M in unrealized profit alongside a $58M short hedge — a position structure that itself implies awareness of downside risk at elevated prices. Separately, Garrett Jin holds 202,078 ZEC with $224.5M in unrealized profit — a position of that size adds meaningful overhead supply if profit-taking accelerates near current levels. Large unrealized gains at resistance are fuel for distribution, not accumulation.
The Levels That Define the Trade
Three levels structure the current setup:
- $1,700 — the recent peak and upper resistance. A sustained close above here would invalidate the divergence thesis by producing a higher RSI high to match, eliminating the divergence entirely.
- $1,500 — the lower wedge boundary and the confirmation trigger. A daily close below this level activates the breakdown and opens the measured move.
- $1,200–$1,300 — the analyst’s target zone and the structural support from prior consolidation. This is where the measured move terminates if the breakdown plays out.
Bullish Scenario — Divergence Invalidated Above $1,700
If ZEC reclaims and closes above $1,700 on the daily with RSI simultaneously printing a higher high, the bearish divergence is formally invalidated. That outcome would reset the momentum picture and put the $1,900–$2,000 range into focus as the next resistance zone. The rising wedge would need to be re-evaluated as a bull flag rather than an exhaustion pattern.
Bearish Scenario — Breakdown Below $1,500
A daily close below the wedge’s lower trendline near $1,500 confirms CryptoBullet1’s setup. The measured move from the wedge’s widest point projects a decline to the $1,200–$1,300 zone — a 15–20% drawdown from current levels. Failure to hold $1,200 would open deeper support near $1,000, where the next significant demand cluster sits.
The RSI Is Not Wrong — It Is Early
One important nuance: RSI divergence does not predict the exact session of breakdown. It identifies that a structural imbalance exists between price and momentum. Markets can remain divergent for multiple sessions — sometimes weeks — before the setup resolves. The divergence signal is a warning, not a countdown timer. What traders are watching is the $1,500 wedge support: the moment that level breaks on a daily close, the “warning” becomes a confirmed signal with a defined target.
The setup is structurally complete. Bearish RSI divergence is confirmed on the ZEC daily chart, compounded by a rising wedge that narrows the price action into an increasingly fragile structure. CryptoBullet1’s $1,200–$1,300 target represents the logical destination if $1,500 fails. The single level that changes everything in either direction is $1,700 to the upside — and $1,500 to the downside.
Frequently Asked Questions
What is bearish RSI divergence and why does it matter for ZEC right now?
What price level would confirm the ZEC bearish divergence breakdown?
At what price would the bearish ZEC thesis be invalidated?
How does the rising wedge on ZEC’s chart reinforce the RSI divergence signal?
Source: Cryptobullet1 · Published by CoinsProbe Markets Desk
The opinions and market insights shared on CoinsProbe represent the views of individual authors based on prevailing market conditions at the time of publication. Cryptocurrency investments carry significant risk and volatility. Readers are encouraged to conduct their own research and seek professional financial advice before making investment decisions. CoinsProbe and its contributors do not accept responsibility for financial losses or decisions made based on published content.
CoinsProbe may publish sponsored articles, affiliate links, or promotional collaborations. All sponsored material is clearly labeled to maintain transparency with our audience. Our editorial decisions remain fully independent, and advertising partnerships do not influence reviews, rankings, or published opinions.
Since 2023, CoinsProbe has delivered reliable insights on cryptocurrency, blockchain, and digital assets. Our content is created by experienced researchers and analysts who follow strict editorial standards focused on accuracy, transparency, and credibility. Every article is carefully reviewed and verified using trusted sources and current market data. We provide unbiased analysis and timely updates covering everything from emerging crypto projects to major industry developments.