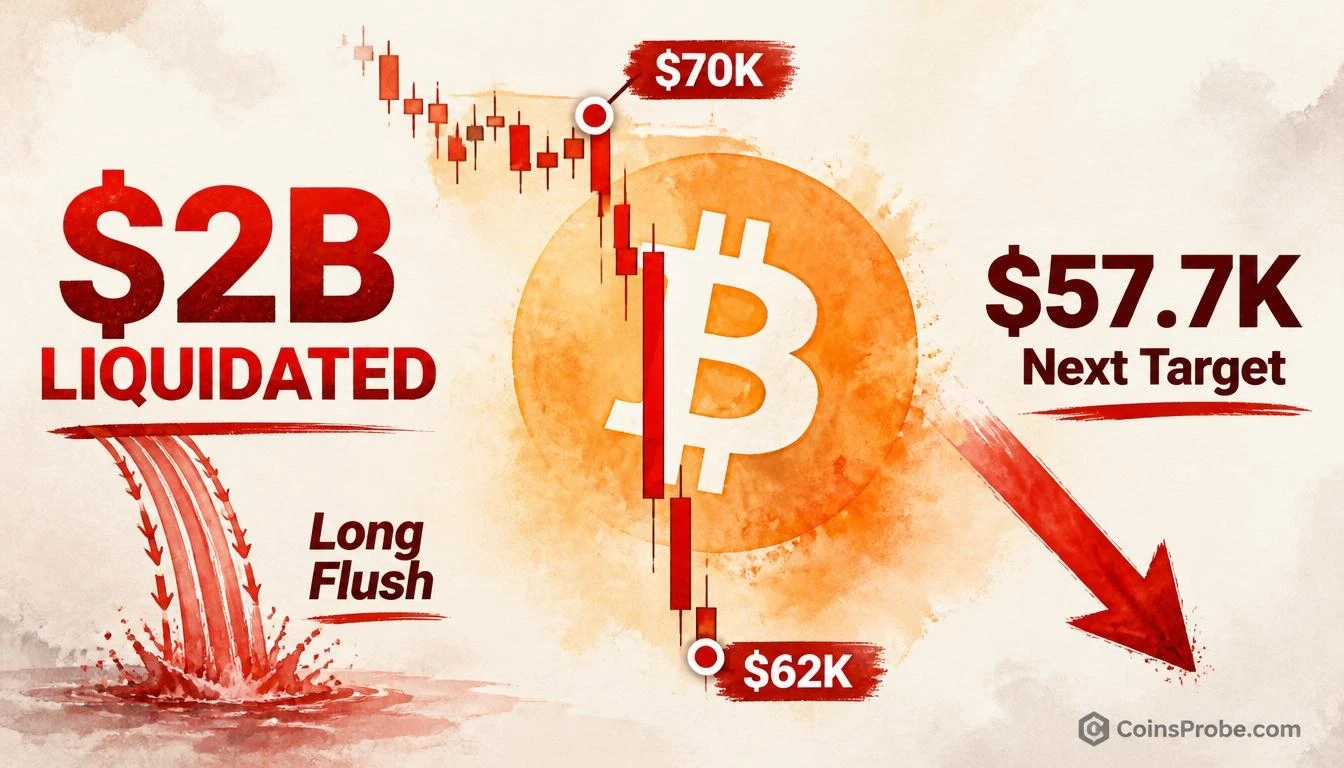

- Bitcoin hit $62,080 on Nov. 15 — lowest since July 14 — as ~$2B in positions were liquidated per CoinGlass
- Long liquidations totaled $1.753B vs. $271M in shorts — a 6.5-to-1 ratio confirming a forced long squeeze
- U.S. spot Bitcoin ETFs saw ~$2.35B in net outflows over two weeks; IBIT posted 11 consecutive sessions of outflows
- Bears are targeting $57,700 — the 2026 low — as the next key support if the weekly close fails
The move was not driven by a single piece of news. Bitcoin’s plunge to $62,080 on November 15 was the product of three converging pressures: two weeks of relentless ETF outflows that stripped away demand, a technical break below key support levels that exposed overleveraged long positions, and a forced liquidation cascade that mechanically accelerated the fall.
At the time of writing, Bitcoin is trading at approximately $64,735 — down 1.16% in the last 24 hours — with a market cap of $1.30 trillion and $52.0 billion in 24-hour volume, per live data.
The Liquidation Cascade — $2 Billion in 24 Hours
Approximately $2 billion in crypto positions were liquidated over the 24 hours ending November 15, per CoinGlass data. The breakdown reveals the directional imbalance clearly: roughly $1.753 billion in long positions were forcibly closed versus just $271 million in shorts — a 6.5-to-1 ratio confirming this was a long squeeze, not a two-sided collapse.
Within that total, Bitcoin accounted for approximately $774 million in liquidations and Ethereum for roughly $488 million, per CoinGlass. BTC bottomed at $62,080–$62,112 — its lowest print since July 14 — while ETH reached $1,711.
The mechanism is straightforward: when price breaks below a support level where large long positions are clustered, exchanges automatically close those positions by selling into the market. That selling drives price lower, triggering the next cluster of liquidations. The cascade self-reinforces until either price finds genuine buyers or the leveraged positions are exhausted.
ETF Outflows — The Demand Destruction That Set the Stage
Liquidation cascades do not emerge in a vacuum. The precondition here was a sustained withdrawal of institutional demand. U.S. spot Bitcoin ETFs recorded approximately $2.35 billion in net outflows over two weeks leading into the November 15 flush, with BlackRock’s IBIT reportedly posting 11 consecutive sessions of outflows — a streak that CoinsProbe tracked in detail in Bitcoin ETFs Post $1.07B in Five-Day Outflows.
ETF outflows matter structurally because spot ETFs are a direct demand channel — each net outflow means the authorized participant is redeeming shares, which requires selling actual Bitcoin. Two weeks of consistent selling from this channel progressively weakened the bid. When leveraged longs were then triggered into liquidation, there was no institutional demand cushion to absorb the selling pressure.
| Metric | Figure | Source |
|---|---|---|
| Total 24H Liquidations | ~$2.0B | CoinGlass |
| Long Liquidations | $1.753B | CoinGlass |
| Short Liquidations | $271M | CoinGlass |
| BTC Liquidations | ~$774M | CoinGlass |
| ETH Liquidations | ~$488M | CoinGlass |
| Spot ETF Outflows (2 Weeks) | ~$2.35B | ETF flow data |
| BTC Low (Nov. 15) | $62,080 | CoinGecko |
| ETH Low (Nov. 15) | $1,711 | CoinGecko |
The Macro Backdrop — What Comes Next
Two forward-looking catalysts are now in focus. First, tonight’s weekly close will determine whether Bitcoin prints a weekly candle below the range that has held since the summer — a close in the low $60Ks would shift the medium-term technical picture materially. Bears are already eyeing $57,700, cited as the 2026 low, as the next meaningful downside reference if the weekly close fails. For context on the on-chain floor model that places a structural support near that range, see Bitcoin CVDD Sits at $50.7K.
Second, macro policy risk is building around Kevin Warsh — a former Federal Reserve governor considered a potential Fed chair candidate — with markets treating any commentary from him as a liquidity and rate signal. His positioning on monetary policy, if articulated publicly this week, would directly affect the risk-asset environment that Bitcoin trades within. This is an anticipated risk, not a confirmed trigger of November 15’s move. Separately, Nvidia reports Tuesday at approximately 21:20 UTC — its first earnings since Jensen Huang’s departure as CEO — and AI equity sentiment has acted as a leading indicator for crypto risk appetite in recent sessions.
The longer structural question is whether this sell-off represents a temporary flush of leverage or the beginning of a more extended drawdown. CoinsProbe’s earlier analysis of Bitcoin’s December 1st Deadline laid out the bear case in detail — the conditions flagged there are now closer to being tested.
Is the Selling Pressure Sustainable?
The $2 billion liquidation event itself is a one-time mechanical event — once those long positions are closed, they cannot be liquidated again. The question is what rebuilds in their place. If new leveraged longs re-enter at current levels before spot demand recovers, the structure remains fragile and another cascade is possible on the next technical break. If the market deleverages cleanly and spot buyers emerge near the weekly close, the flush may prove to be an overcorrection.
The metric to track is the daily net ETF flow figure. If outflows slow or reverse toward inflows, it signals that institutional demand is returning to absorb spot supply. If outflows persist at the two-week pace of roughly $167 million per day, the demand-side weakness that enabled this cascade remains intact.
Bitcoin’s November 15 drop to $62,080 was the product of a specific, traceable sequence: two weeks of $2.35 billion in ETF outflows depleted the demand cushion, a technical break triggered overleveraged longs, and $1.753 billion in forced long closures mechanically drove price to its lowest level since July 14. The next session’s weekly close and the daily ETF flow data are the two numbers that will define what comes next. Watch the daily ETF net flow figure — available via SoSoValue — as the real-time indicator of whether institutional demand has stabilized.
Frequently Asked Questions
Why did Bitcoin drop to $62K on November 15?
How much did Bitcoin ETFs lose in outflows before the crash?
What is the next key support level for Bitcoin after the $62K low?
What macro events could move Bitcoin this week after the $2B flush?
Source: AsterDEX · Published by CoinsProbe Markets Desk
The opinions and market insights shared on CoinsProbe represent the views of individual authors based on prevailing market conditions at the time of publication. Cryptocurrency investments carry significant risk and volatility. Readers are encouraged to conduct their own research and seek professional financial advice before making investment decisions. CoinsProbe and its contributors do not accept responsibility for financial losses or decisions made based on published content.
CoinsProbe may publish sponsored articles, affiliate links, or promotional collaborations. All sponsored material is clearly labeled to maintain transparency with our audience. Our editorial decisions remain fully independent, and advertising partnerships do not influence reviews, rankings, or published opinions.
Since 2023, CoinsProbe has delivered reliable insights on cryptocurrency, blockchain, and digital assets. Our content is created by experienced researchers and analysts who follow strict editorial standards focused on accuracy, transparency, and credibility. Every article is carefully reviewed and verified using trusted sources and current market data. We provide unbiased analysis and timely updates covering everything from emerging crypto projects to major industry developments.