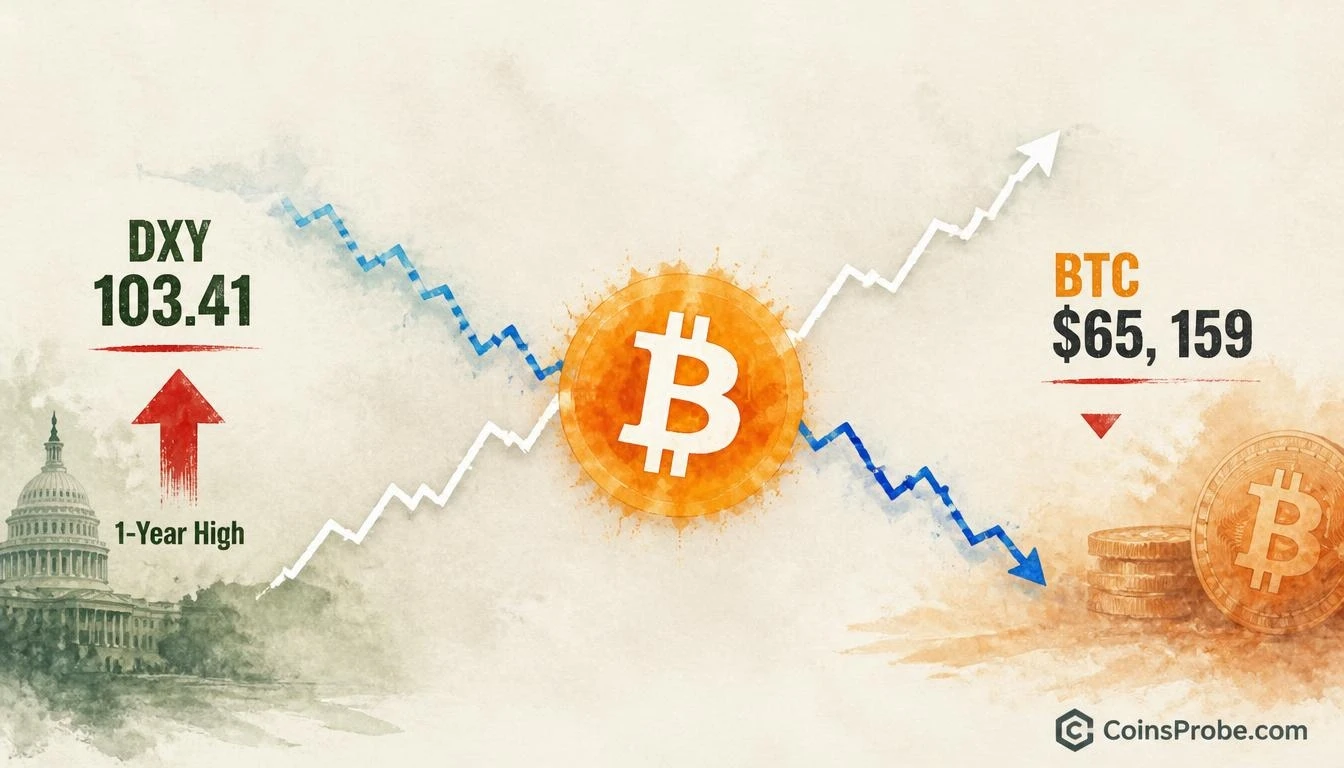

- Bitcoin is at $65,159 (-1.91% 24h) as DXY closes at 103.41 — the highest 2026 print and a 1-year high
- DXY gained +4.26% year-over-year from 99.18, with the rally building since Jan 27 bottom at 96.22 per Alphractal
- Gold futures sit at $3,886.3 — 26.9% below their Jan 29 ATH of $5,318.4, confirming dollar-driven liquidity compression
- Watch DXY 103.00 — a weekly close below signals dollar momentum fading and opens recovery path for BTC
Bitcoin is trading at $65,159 — down 1.91% in the past 24 hours and sitting below the $100K level — as the U.S. Dollar Index delivers its most significant macro signal of the year. A strengthening dollar is not a neutral event for risk assets. It is a liquidity tightening mechanism, and Bitcoin is absorbing that pressure in real time.
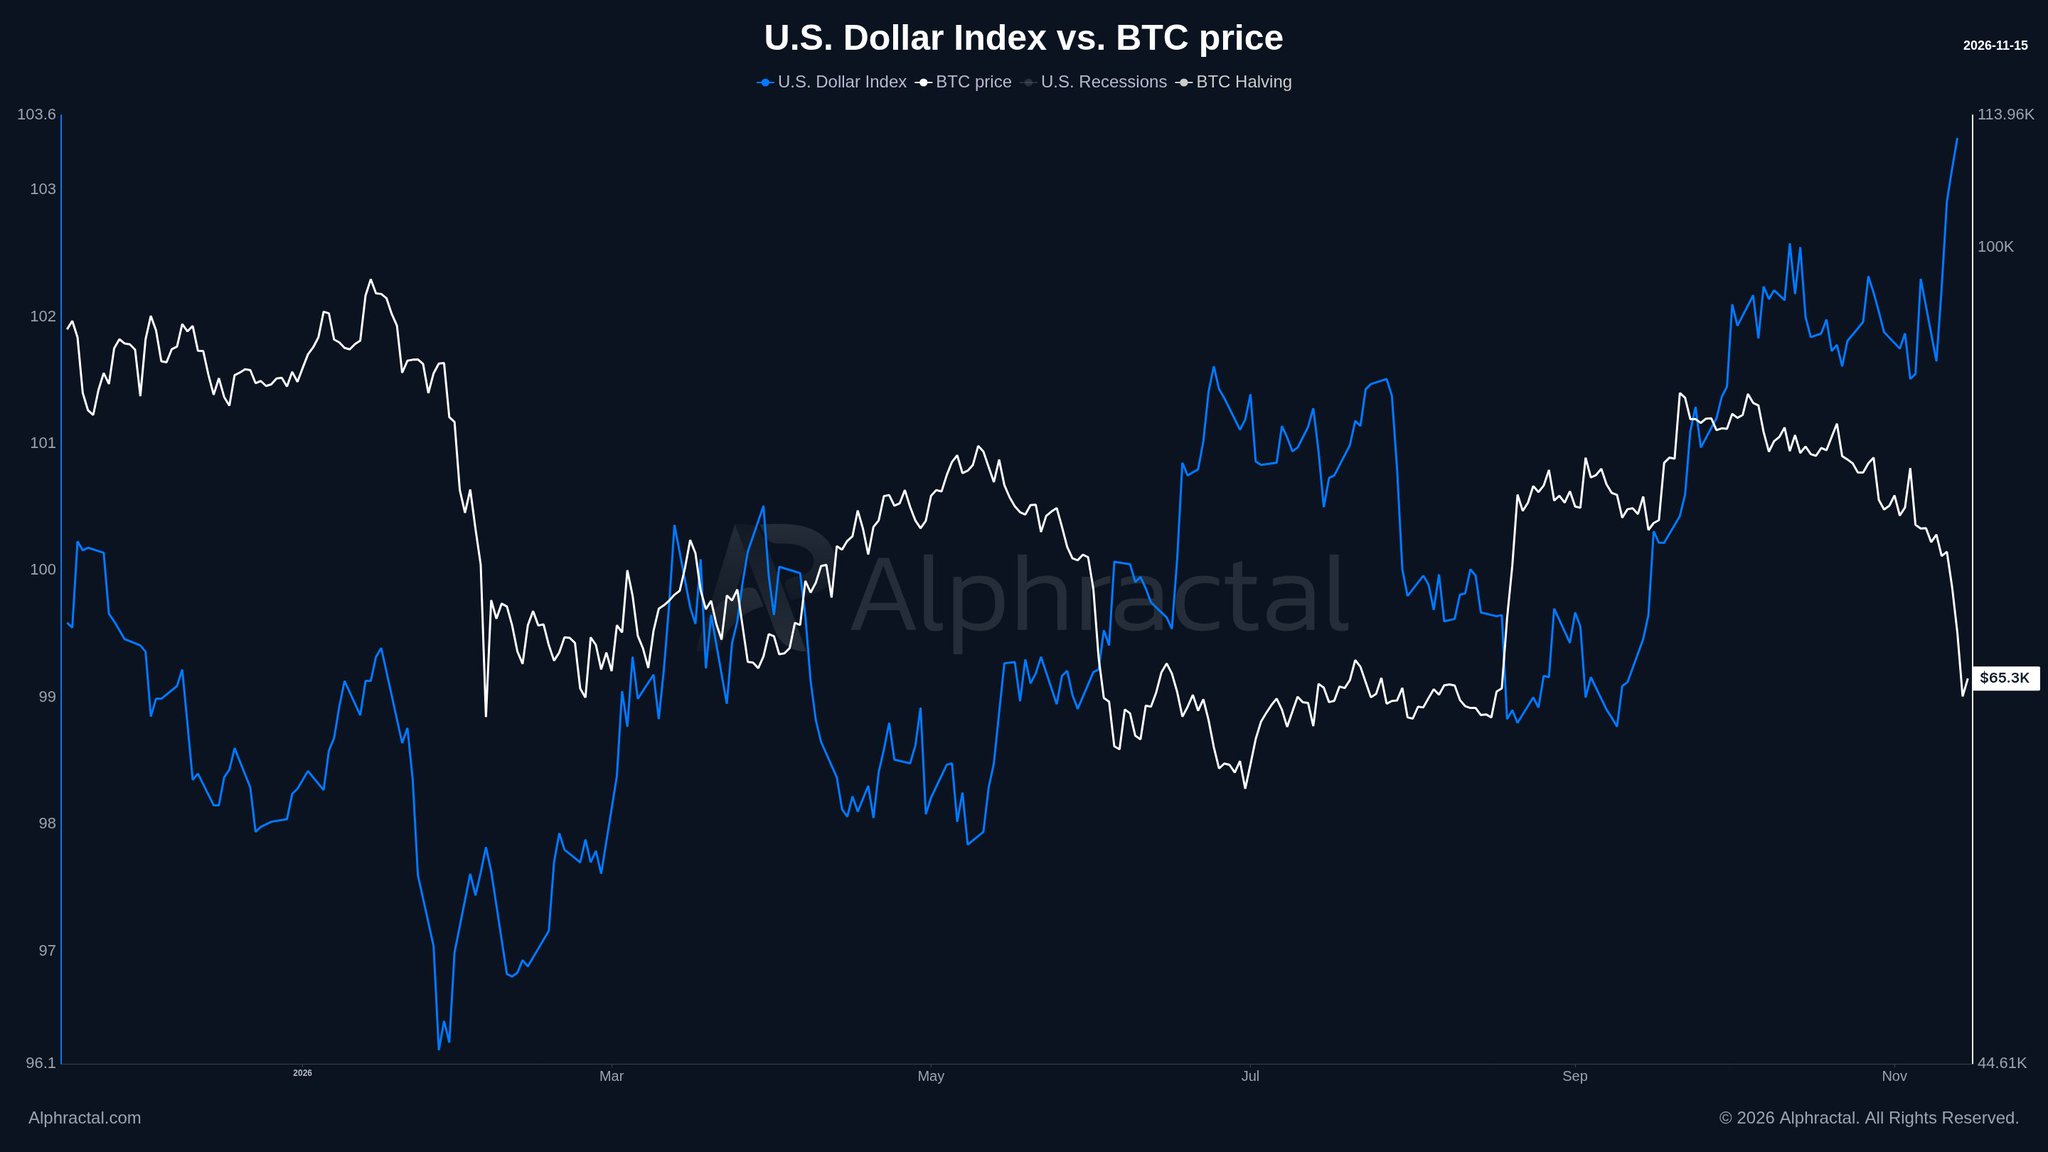
An analyst at Alphractal flagged the move on November 15, noting that DXY closed at 103.41 on November 13 — the highest print of 2026 and the highest weekly close in a full year. The 7-day gain alone was +1.11 points (+1.09%). On a year-over-year basis, the index has risen +4.26% from 99.18, a move the analyst describes as building since the January 27 bottom at 96.22.
DXY at 103.41 — The Macro Mechanism Compressing Bitcoin
The DXY measures the value of the U.S. dollar against a basket of six major currencies — euro, yen, pound, Canadian dollar, Swedish krona, and Swiss franc. When DXY rises, global dollar liquidity contracts: dollar-denominated assets become more expensive to hold internationally, capital flows into dollar instruments rather than risk assets, and financing costs for leveraged positions increase. Bitcoin, priced in dollars and held primarily by participants who also hold other risk assets, sits directly in the path of that compression.
The chart shared by Alphractal maps DXY (white line) against Bitcoin’s price (blue line) across approximately January through November 15, 2026. The inverse correlation is the defining visual of the chart: as DXY surged to the top of its year-long range near 103.6, Bitcoin dropped simultaneously — with BTC tagged at approximately $62K at the correlation inflection point. The DXY breakout is confirmed: the index has moved above the prior resistance range that defined most of the 2026 trading year. Bitcoin, meanwhile, is printing below the $100K level visible on the chart’s right axis.
Percentile Context — Elevated But Not Extreme
Alphractal’s note adds an important structural qualifier: at 103.41, DXY sits at the 62nd percentile over the past four years. That framing matters. The index remains well below its 2022 peak of 114.11 and below the January 2025 high of 109.96. This is not a cycle high for the dollar — it is a 2026-high, occurring in an environment where the index had spent most of the year well below 100.
That context cuts both ways. The dollar is elevated enough to generate real liquidity pressure on risk assets — which the BTC price action confirms. But it is not in the historically extreme territory that preceded prolonged risk-off regimes in 2022. The 62nd percentile reading positions DXY as meaningfully strong without being structurally unprecedented.
Gold Confirms the Liquidity Signal
Bitcoin is not the only risk asset registering the dollar’s move. Gold futures, as reported by Alphractal, are sitting at $3,886.3 — which is 26.9% below their January 29 all-time high of $5,318.4. Gold and Bitcoin are structurally different assets, but both respond to the same dollar liquidity dynamic. When the dollar strengthens, real assets priced in USD face the same headwind: a rising denominator compresses prices. The fact that gold is simultaneously 26.9% off its ATH while BTC trades near $65K reinforces that this is a macro-driven liquidity event, not a Bitcoin-specific structural issue.
For further context on Bitcoin’s on-chain floor models during macro pressure periods, see Bitcoin CVDD Sits at $50.7K — What This On-Chain Floor Model Says Now. And for where the current environment fits within the broader market psychology, Where Are You in the Market Cycle? Mapping Crypto’s Psychology Right Now offers a structured lens.
The Build-Up From 96.22 — Why This Move Has Momentum
Alphractal’s note identifies January 27 as the structural starting point of the current DXY rally, with the index bottoming at 96.22. From that level to November 13’s close of 103.41, DXY has gained approximately 7.47 points — a sustained, multi-month move, not a spike. That duration matters: a gradual dollar strengthening cycle allows liquidity to drain progressively from risk markets rather than creating a sharp but quickly-reversed shock. Bitcoin’s descent from above $100K to the current $65,159 reflects that slow drain.
The parallel compression in stablecoin supply is worth noting — the liquidity context is consistent across signals. Stablecoin Supply Drops $17B — The Steepest Contraction Since 2022 documents how on-chain dollar proxies have been contracting in step with the macro tightening.
What Reverses the Pressure
The mechanism is symmetric: a DXY reversal from these levels would loosen the same liquidity conditions currently compressing Bitcoin. At 103.41 and the 62nd percentile, the dollar has room to extend — but it also does not carry the historical momentum of a peak like 114.11. Traders watching BTC’s recovery potential should track DXY’s ability to hold above the 103 level on weekly closes. A failure to hold — particularly driven by softer U.S. economic data or a shift in Federal Reserve forward guidance — would remove the primary macro headwind currently weighing on price.
At $65,159, Bitcoin is pricing in a world where the dollar stays strong. Any data that changes that expectation will reprice BTC accordingly. The DXY chart, not the BTC chart, is the leading variable right now.
Watch 103.00 on DXY as the first line of support — a weekly close below it would signal the dollar rally is losing momentum and open room for Bitcoin to recover toward the $100K level that now acts as overhead resistance.
Frequently Asked Questions
Why does a rising DXY put pressure on Bitcoin’s price?
Is DXY at 103.41 historically extreme or still within a normal range?
What level on DXY would signal the pressure on Bitcoin is easing?
Why is gold also falling while DXY rises — isn’t gold a safe haven?
Source: Alphractal · Published by CoinsProbe Markets Desk
The opinions and market insights shared on CoinsProbe represent the views of individual authors based on prevailing market conditions at the time of publication. Cryptocurrency investments carry significant risk and volatility. Readers are encouraged to conduct their own research and seek professional financial advice before making investment decisions. CoinsProbe and its contributors do not accept responsibility for financial losses or decisions made based on published content.
CoinsProbe may publish sponsored articles, affiliate links, or promotional collaborations. All sponsored material is clearly labeled to maintain transparency with our audience. Our editorial decisions remain fully independent, and advertising partnerships do not influence reviews, rankings, or published opinions.
Since 2023, CoinsProbe has delivered reliable insights on cryptocurrency, blockchain, and digital assets. Our content is created by experienced researchers and analysts who follow strict editorial standards focused on accuracy, transparency, and credibility. Every article is carefully reviewed and verified using trusted sources and current market data. We provide unbiased analysis and timely updates covering everything from emerging crypto projects to major industry developments.