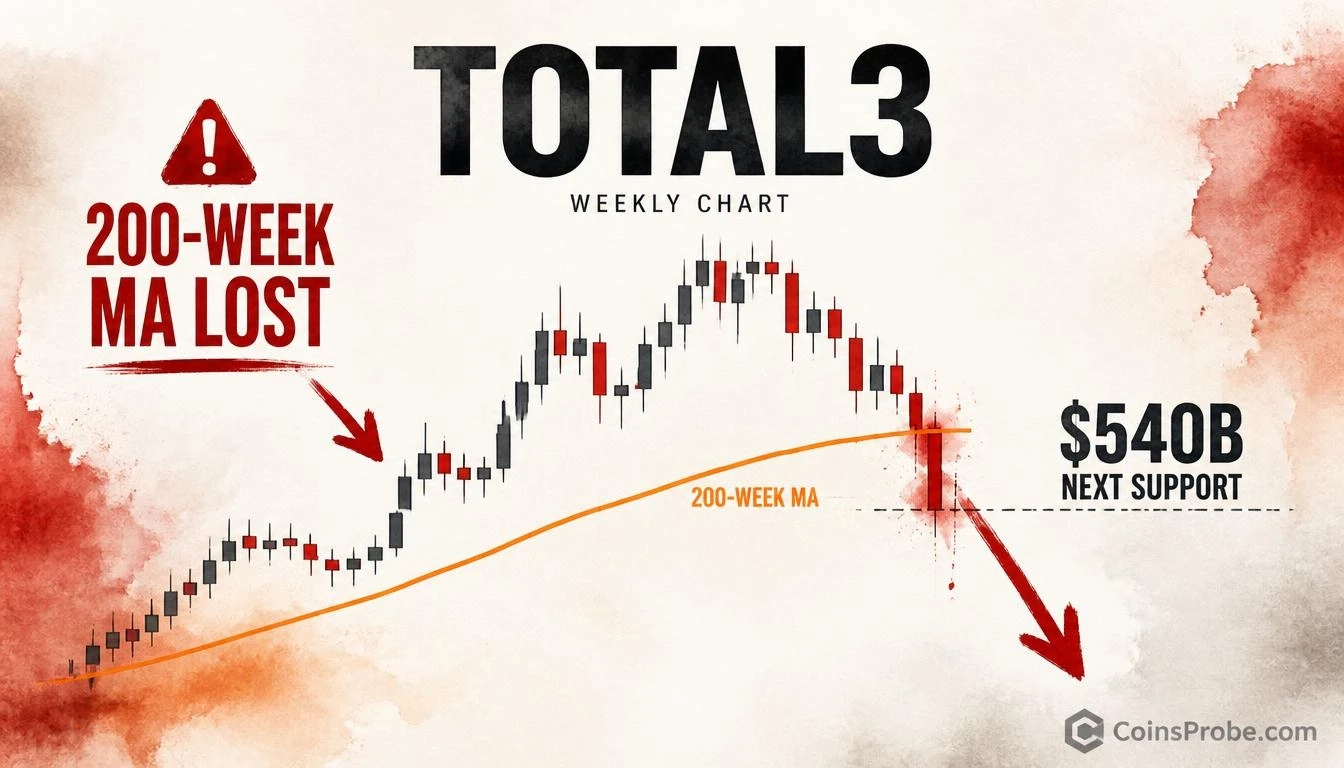

- TOTAL3 has broken below the 200-Week MA (~$675B), confirmed on the weekly chart per analyst warning on Nov 15, 2026
- Analyst calls the breakdown "VERY BAD" and explicitly warns traders to prepare for capitulation in the altcoin market
- Next major reference level below 200-Week MA is $540B — approximately 17% below current TOTAL3 reading of $650.57B
- Weekly close above $675B is the sole condition that would invalidate the bearish structural read
The crypto market excluding Bitcoin and Ethereum — tracked as TOTAL3 — has broken below its 200-Week Moving Average, a level that has historically served as the last line of macro support during bear markets. At the time of writing, Bitcoin is trading at approximately $64,616, down 1.13% in the past 24 hours, with a total market cap of $1.299 trillion — but it is the altcoin complex, represented by TOTAL3 at approximately $650.57 billion, that is flashing the more alarming structural signal.
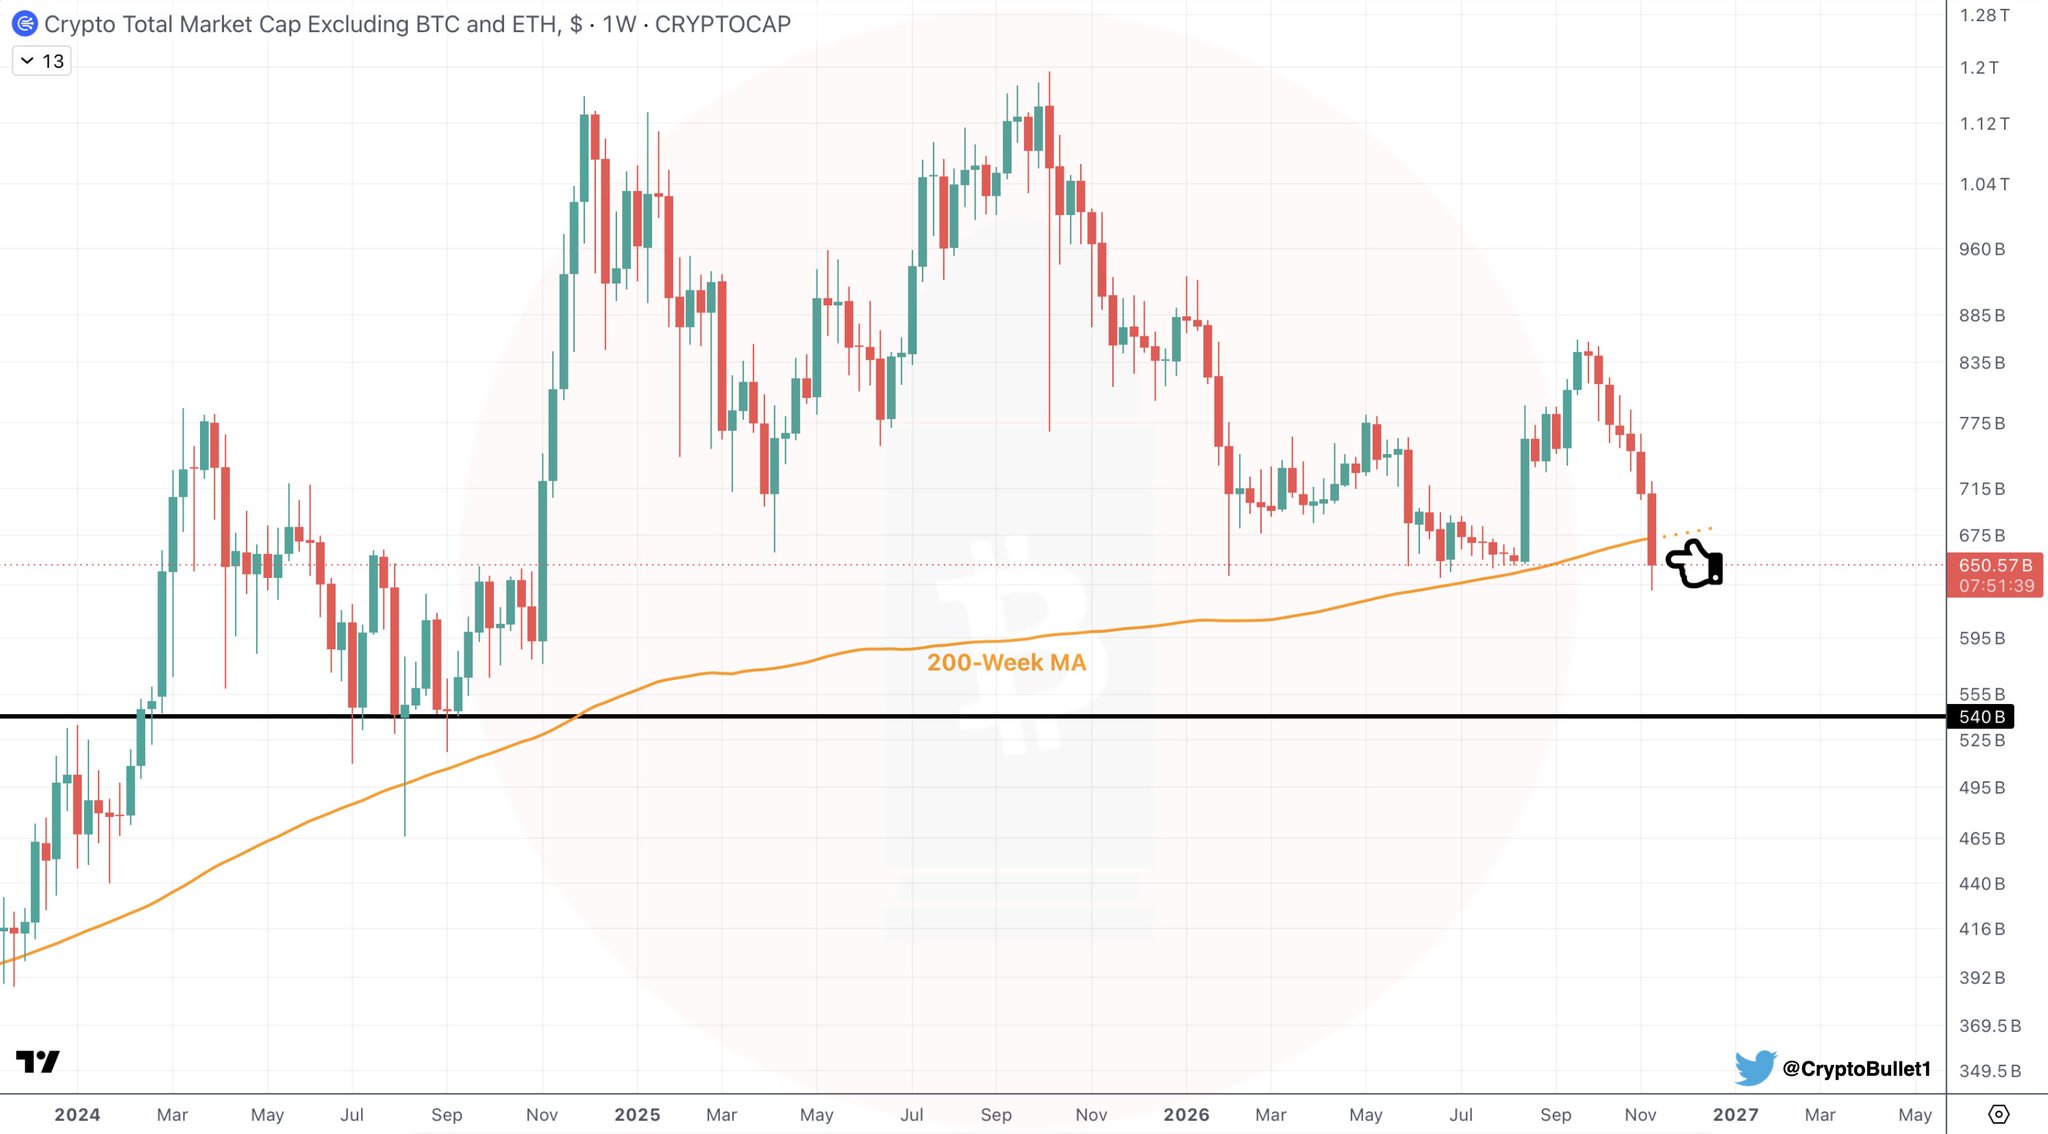
One analyst, posting on November 15, 2026, delivered an unambiguous warning: “#TOTAL3 is losing the 200-Week MA. This is bad. VERY BAD. Be mentally prepared for capitulation.” The tone is not speculative hedging — it is a direct, declarative read of a weekly chart that now shows TOTAL3 trading below the orange 200-Week MA line, with the gap between price and the moving average widening.
What the 200-Week MA Actually Measures — And Why Losing It Matters
The 200-Week Moving Average is not a short-term oscillator or a momentum signal. It is a long-horizon trend filter — the average closing price of an asset across the past 200 weekly candles, or roughly four years of market history. For the broader altcoin market, it represents the structural mean around which multi-year cycles rotate. When TOTAL3 is above it, the altcoin market is in a structurally bullish regime. When it trades below it, historical precedent points to accelerated drawdowns as marginal buyers exit and leveraged positions unwind.
The chart shows TOTAL3 at $650.57 billion, with the 200-Week MA sitting visually near $675 billion. The breakdown is confirmed: price is now below that moving average, and with roughly eight hours remaining in the weekly candle at the time of the post, there is limited time for a recovery close above it on this weekly bar. The analyst’s concern is precisely this — a weekly close below the 200-Week MA would shift the structural reading from “testing support” to “support lost.”
The 540B Line — The Next Major Reference Level
Below the 200-Week MA, the chart identifies one additional reference level: a horizontal support shelf at $540 billion. This is the next meaningful technical floor for TOTAL3 if the 200-Week MA fails to reclaim on a weekly closing basis. The distance from the current $650.57 billion reading to $540 billion represents approximately a 17% further decline in total altcoin market capitalization — a move that, if it materializes, would translate into severe drawdowns across mid- and small-cap tokens that carry the most beta to TOTAL3.
It is worth placing this in macro context. The broader dollar environment has been applying sustained pressure on risk assets — the DXY hitting a one-year high at 103.41 has historically compressed crypto valuations, and altcoins, which carry higher beta than Bitcoin, feel that compression most acutely. TOTAL3 losing the 200-Week MA during a period of dollar strength is a compounding risk factor, not an isolated technical event.
Why “Capitulation” Is the Specific Word the Analyst Used
Capitulation has a precise meaning in market structure — it describes the phase where holders who have been absorbing losses finally exit, creating a sharp, high-volume flush that exhausts remaining sell pressure. The analyst’s explicit call to “be mentally prepared for capitulation” is not a price target. It is a regime warning: the structural support that prevented prior drawdowns from becoming cascading sell-offs has now been compromised.
The implication for altcoin holders is specific. Tokens that have been holding up relative to Bitcoin may now face accelerated BTC-denominated declines as TOTAL3 reprices lower. Projects without fundamental catalysts — protocol revenue, active user growth, upcoming unlock events — are most exposed. The structural timeline pressure on Bitcoin itself through December adds another layer of urgency to what the TOTAL3 chart is now signaling.
What a Recovery Would Require
The analyst’s warning is conditional on the weekly close. For the bearish structural read to be invalidated, TOTAL3 would need to close the current weekly candle back above the 200-Week MA — visually near $675 billion — and sustain that level in subsequent weeks. A single-week reclaim followed by another loss would be more damaging than a clean breakdown, as it would create a failed recovery pattern on the weekly chart.
The metric to track is straightforward: TOTAL3’s weekly closing price relative to the 200-Week MA. DeFiLlama and TradingView both update this in real time. As long as weekly closes remain below the MA, the structural context supports further compression toward $540 billion. A sustained weekly close above it reopens the possibility that this was a wick below support rather than a regime change — but that recovery has not occurred at time of writing.
For Bitcoin-focused readers, the TOTAL3 breakdown does not necessarily mean Bitcoin itself will capitulate at the same pace. Bitcoin’s own on-chain support structure, including the CVDD floor model currently sitting at $50.7K, provides a separate analytical lens — but altcoins do not carry the same institutional bid that moderates Bitcoin’s downside. TOTAL3 losing the 200-Week MA is an altcoin-specific signal with altcoin-specific consequences.
The analyst’s conclusion is unambiguous. TOTAL3 has broken below a moving average that has never been lost without a significant capitulation event following. The $540 billion shelf is the next structural reference. Watch the weekly close above or below the 200-Week MA near $675 billion — that is the single most important data point for the altcoin market in this session.
Source: x.comFrequently Asked Questions
What does TOTAL3 breaking the 200-Week MA mean for altcoins?
What is the next support level for TOTAL3 if the 200-Week MA is not reclaimed?
What would invalidate the bearish TOTAL3 signal?
Does the TOTAL3 breakdown affect Bitcoin directly?
Source: Cryptobullet1 · Published by CoinsProbe Markets Desk
The opinions and market insights shared on CoinsProbe represent the views of individual authors based on prevailing market conditions at the time of publication. Cryptocurrency investments carry significant risk and volatility. Readers are encouraged to conduct their own research and seek professional financial advice before making investment decisions. CoinsProbe and its contributors do not accept responsibility for financial losses or decisions made based on published content.
CoinsProbe may publish sponsored articles, affiliate links, or promotional collaborations. All sponsored material is clearly labeled to maintain transparency with our audience. Our editorial decisions remain fully independent, and advertising partnerships do not influence reviews, rankings, or published opinions.
Since 2023, CoinsProbe has delivered reliable insights on cryptocurrency, blockchain, and digital assets. Our content is created by experienced researchers and analysts who follow strict editorial standards focused on accuracy, transparency, and credibility. Every article is carefully reviewed and verified using trusted sources and current market data. We provide unbiased analysis and timely updates covering everything from emerging crypto projects to major industry developments.