- TSLA confirmed breakout above descending channel with daily close above $400 — Martinez's pre-specified trigger level
- Analyst @alicharts called the $400 breakout level on October 5, 2026 — three weeks before confirmation arrived
- $450 is the stated target; $421.88 and $451.29 are the intermediate resistance levels between current price and objective
- Daily close back below $400 invalidates the breakout and returns TSLA to the channel structure
Tesla (TSLA) has confirmed a technical breakout from a multi-month descending channel, with the stock now trading at approximately $407.46 after closing above the $400 confirmation level. The breakout — called in advance by technical analyst Ali Martinez (@alicharts) — places TSLA in a structurally different position than it has occupied for months: above resistance, not below it.
Martinez flagged the setup on October 28, 2026, writing: “TESLA IS BREAKING OUT, AS PREDICTED — $TSLA has breached the upper boundary of the descending channel developing on its daily chart. With a daily close above $400, the breakout is now confirmed. This technical formation opens the path for Tesla to advance toward $450.”
The prediction itself was not reactive — Martinez had identified the descending channel and the $400 level as the breakout trigger in a prior post dated October 5, 2026 (ID: 2107181865111294046), meaning the confirmation arrived on exactly the level he had pre-specified.
The Descending Channel — Structure and Breakdown
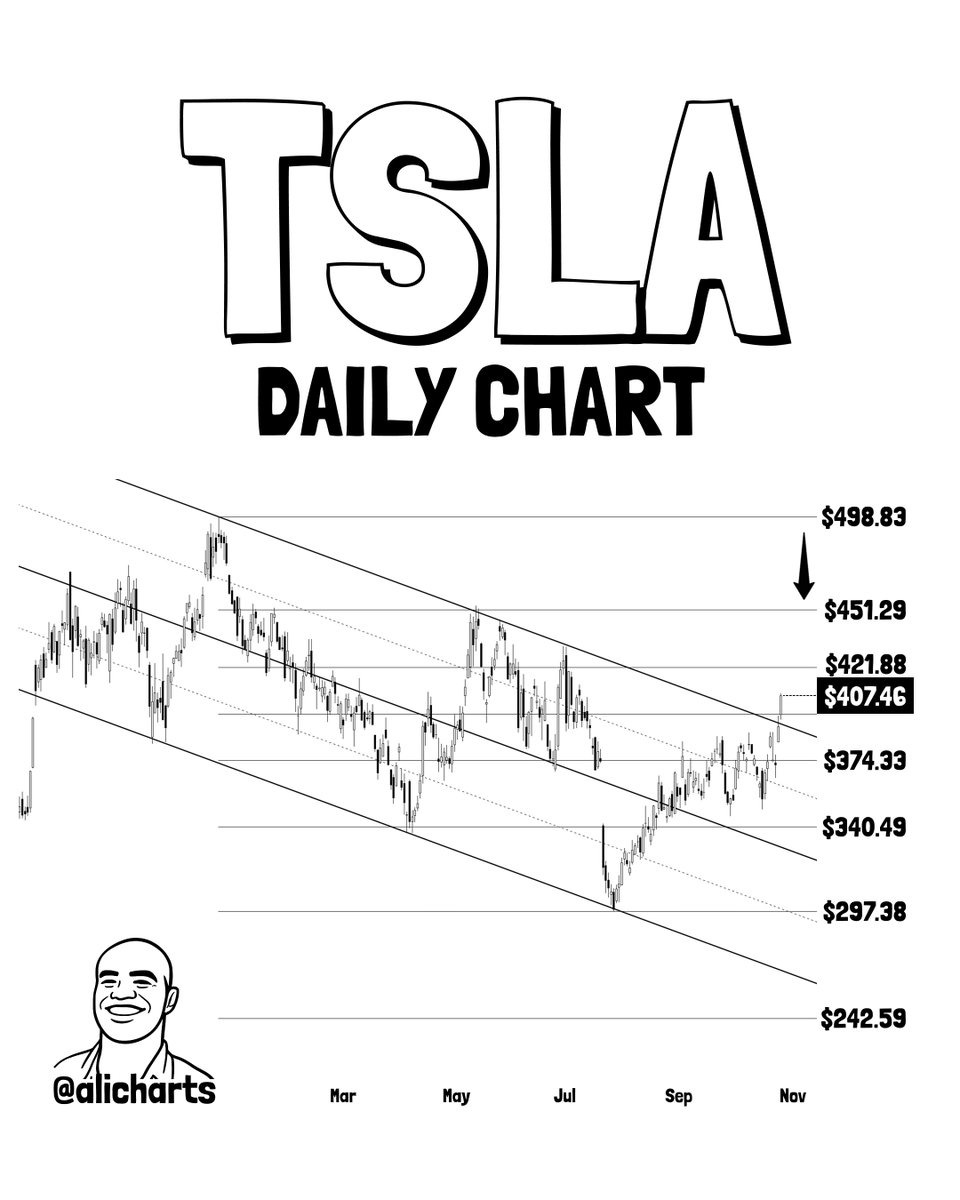
The descending parallel channel on TSLA’s daily chart formed over a period stretching from approximately March through late October 2026. Two downward-sloping trendlines — an upper resistance boundary and a lower support boundary — contained price action for the entire duration, with TSLA oscillating between the channel extremes. Key levels visible within that range included $498.83, $451.29, $421.88, $407.46, $374.33, $340.49, $297.38, and $242.59, documenting a sustained sequence of lower highs and lower lows consistent with a bearish trend corridor.
The critical structural shift occurred when TSLA closed above the upper trendline — a boundary that had rejected multiple rallies throughout the channel’s formation. Martinez set $400 as the confirmation threshold for that close, not the trendline touch itself. The daily close above $400 is what elevated this from a trendline touch to a confirmed breakout. At the time of writing, TSLA is trading at approximately $407.46 — above the breakout level and above the $374.33 prior support zone, though still below the $421.88 and $451.29 intermediate levels that now represent the path to the stated $450 target.
The $450 Target — How the Math Works
The $450 price target cited by Martinez is not arbitrary. In descending channel breakouts, the measured move objective is typically derived from the channel’s width projected upward from the breakout point. The channel contained a price range spanning from the low $240s to the high $490s at its widest points, implying substantial compression over the multi-month formation. A breakout above $400 with a target of $450 represents approximately a 10.7% advance from the confirmed breakout level — a conservative projection relative to the channel’s full width, suggesting Martinez is citing an intermediate target rather than a full measured move extension.
The intermediate resistance levels visible on the chart — $421.88 and $451.29 — align closely with the stated $450 target. The $451.29 level in particular appears as a labeled reference on the chart, and Martinez annotated it with a downward arrow as an apparent near-term target zone, consistent with his stated $450 objective. For context, Tesla previously surged 5% in a single session after the Flying Roadster unveil, illustrating how quickly TSLA can close ground toward resistance levels when momentum is engaged.
Why This Breakout Has Credibility
Three factors separate a genuine descending channel breakout from a false one. First, the analyst pre-specified the exact confirmation level — $400 — more than three weeks before the breakout occurred. Pre-specified levels carry more analytical weight than post-hoc rationalization because the market has no way to engineer a close at a level no one has published. Second, the breakout is confirmed on the daily timeframe, not an intraday spike — daily closes are significantly harder to manufacture and carry more institutional weight in technical analysis. Third, the prior prediction was publicly documented (October 5 post), meaning the track record is verifiable, not retroactive.
It is also worth noting that TSLA’s technical reset comes alongside broader corporate developments. A potential SpaceX-Tesla merger scenario has circulated in markets, with structural implications for the combined entity’s balance sheet. Whether that narrative is contributing to renewed institutional interest in TSLA is a separate question — but the technical picture, as Martinez correctly identified, was forming independently of any single macro catalyst.
Bullish Scenario
TSLA sustains price above $400 on subsequent daily closes, clears $421.88 intermediate resistance, and advances toward the $451.29–$450 target zone identified by Martinez. A clean hold above $407.46 (current level) with a move through $421.88 would represent the path of least resistance toward the stated target.
Bearish Scenario
A daily close back below $400 would invalidate the breakout signal and return TSLA inside the descending channel structure. The next meaningful support below the breakout level sits at $374.33 per the chart labels. Recapture of the channel would negate the bullish thesis and shift the analytical focus back to range-bound price action.
The setup Martinez identified has now delivered its confirmation. The descending channel — formed over approximately eight months — has been broken with a daily close above $400, the pre-specified trigger. TSLA is now trading at $407.46, between the breakout level and the first intermediate resistance at $421.88. The stated target is $450, aligning with the $451.29 chart label. Watch $400 as the invalidation line — a daily close below that level reopens the channel and resets the thesis entirely.
Frequently Asked Questions
What does a descending channel breakout mean for TSLA?
What is @alicharts’ price target for Tesla after this breakout?
What level would invalidate the TSLA breakout signal?
When did @alicharts originally predict the TSLA breakout?
Source: Ali Charts · Published by CoinsProbe Markets Desk
The opinions and market insights shared on CoinsProbe represent the views of individual authors based on prevailing market conditions at the time of publication. Cryptocurrency investments carry significant risk and volatility. Readers are encouraged to conduct their own research and seek professional financial advice before making investment decisions. CoinsProbe and its contributors do not accept responsibility for financial losses or decisions made based on published content.
CoinsProbe may publish sponsored articles, affiliate links, or promotional collaborations. All sponsored material is clearly labeled to maintain transparency with our audience. Our editorial decisions remain fully independent, and advertising partnerships do not influence reviews, rankings, or published opinions.
Since 2023, CoinsProbe has delivered reliable insights on cryptocurrency, blockchain, and digital assets. Our content is created by experienced researchers and analysts who follow strict editorial standards focused on accuracy, transparency, and credibility. Every article is carefully reviewed and verified using trusted sources and current market data. We provide unbiased analysis and timely updates covering everything from emerging crypto projects to major industry developments.