
- NVDA confirms breakdown below 200-day SMA (~$204.38) after failed breakout at ATH $243.37 on October 6
- Analyst flags $190 (rising channel lower boundary) as the next critical support — loss opens $170 and $154
- $212 former support now flips to resistance; sustained close below $204.38 weakens long-term bull structure
NVIDIA has confirmed a breakdown below one of the most closely watched technical levels in equity markets. The stock is currently trading at $204.64 — below its 200-day simple moving average of approximately $204.38 — a development that one analyst identifies as a direct challenge to the bull trend that has defined NVDA’s structure since April 2026.
An analyst at @alicharts framed the setup bluntly: “Nvidia may be the most important stock to monitor when evaluating whether weakness in AI infrastructure is spreading into the industry’s largest beneficiaries.” That framing is not incidental. NVDA is widely treated as a proxy for AI infrastructure spending — and a sustained break below the 200-day SMA weakens the structural argument that has underpinned the entire AI trade. For more on the broader AI infrastructure signal, see Is the AI Bubble About to Burst? The 200-Day SMA Is Sending a Warning.
The Breakdown — What the Chart Shows
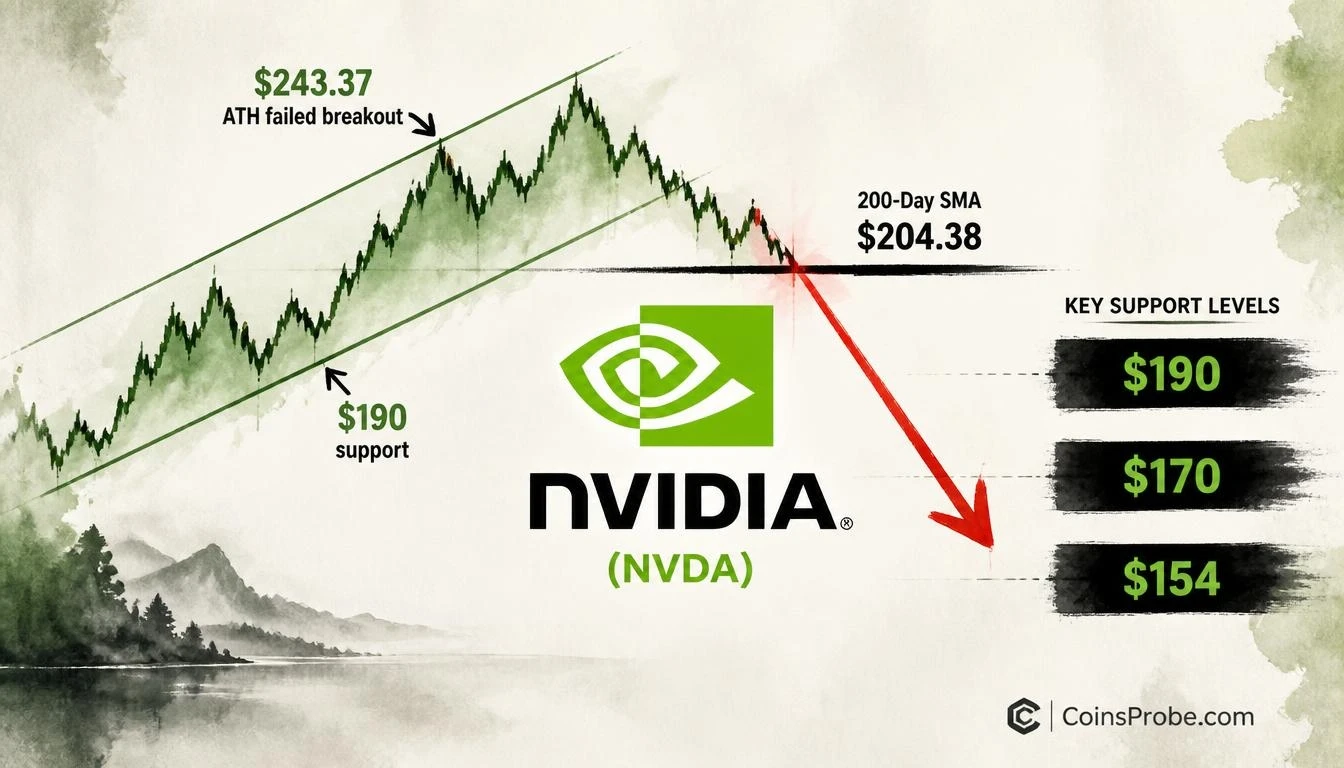
Since April 2026, NVDA has traded within a rising parallel channel. The structure was intact through most of the period, with price respecting both the upper and lower boundaries. On October 6, the stock attempted a breakout above the upper boundary of the channel, reaching an all-time high near $243.37. That breakout failed. Price reversed sharply and has since declined through the channel interior, breaking below the $212 level — previously a significant support zone — and is now pressing against the 200-day SMA at $204.38.
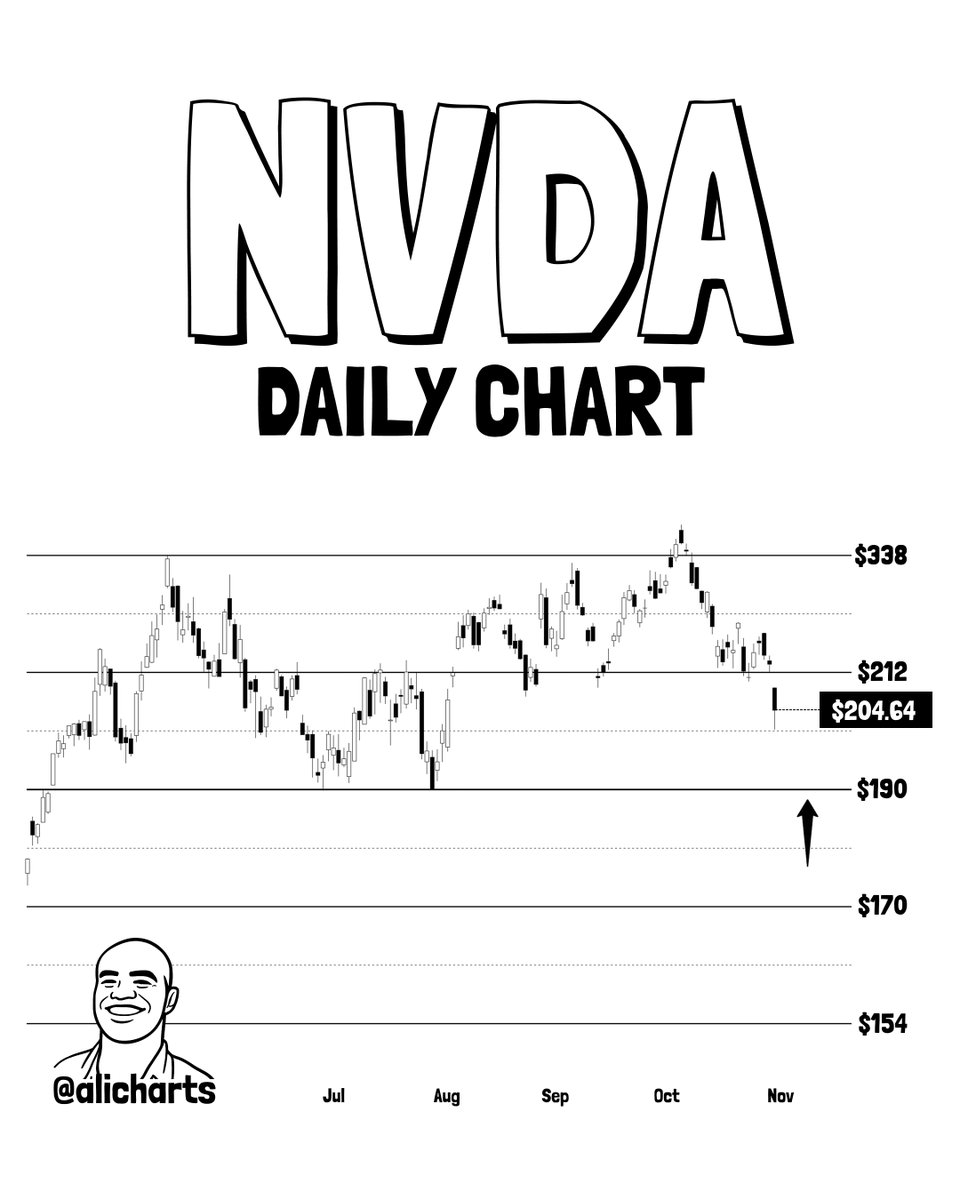
The chart shared by the analyst labels the current price at $204.64, with clear horizontal support zones marked at $212, $190, $170, and $154. Price is below $212 and above $190 — sitting in a zone the analyst identifies as a major decision point. An upward arrow drawn near the $190 level signals that the analyst views that zone as a potential stabilization area if selling pressure continues. The $212 level, now lost, flips to resistance on any recovery attempt.
Why the 200-Day SMA Matters Here
The 200-day SMA is not a momentum oscillator — it is a trend filter. When a stock trades above it, institutional portfolios treat the asset as in a long-term uptrend. When it breaks below, risk models that use the 200-day as a regime signal mechanically reduce exposure. This is not a sentiment observation. It is a structural shift that affects the behavior of systematic funds, pension allocators, and risk-parity strategies simultaneously.
For NVDA specifically, the 200-day SMA break carries additional weight. The stock has been a central holding in AI-themed ETFs and institutional portfolios built around the AI infrastructure thesis. A sustained close below $204.38 does not just affect NVDA’s chart — it sends a signal about the durability of AI capital expenditure momentum across the sector. The concentration of AI-related gains in a narrow set of stocks is already a documented structural risk, as detailed in 10 Stocks Drive 70% of S&P 500’s +23% Gain Since March 30.
The Levels That Define the Next Move
With $212 lost and the 200-day SMA now under pressure, the analyst’s framework identifies three downside levels and one recovery threshold:
| Level | Role | Context |
|---|---|---|
| $212 | Former support, now resistance | Breakdown confirmed below this level |
| $204.38 | 200-day SMA | Current test — sustained close below weakens structure |
| $190 | Channel lower boundary / next support | Analyst’s primary watch level if selling continues |
| $170 | Deeper support | Next meaningful level if $190 fails |
| $154–$155 | Lower structural support | Analyst’s deepest cited target zone |
Source: @alicharts (X), November 3, 2026
The $190 level corresponds to the lower boundary of the rising parallel channel that has contained NVDA’s trend since April. A hold at $190 would keep the channel structure technically intact. A break below it would confirm that the rising channel has been invalidated entirely — shifting the analytical framework from “pullback within an uptrend” to “trend reversal.”
What a Failed Breakout Signals
The October 6 high of $243.37 now carries specific analytical weight as a failed breakout — not just a peak. Price broke above the upper channel boundary, could not sustain the move, and reversed sharply. Failed breakouts above multi-month consolidation ranges tend to produce accelerated declines because they flush out buyers who entered on the breakout and find no follow-through. The speed of the decline from $243.37 to $204.64 — approximately 16% in under a month — is consistent with that pattern. This context matters for anyone reassessing the prior breakout thesis that targeted $280.
Bullish Scenario
NVDA holds the $190 channel boundary on a closing basis, reclaims $204.38 (200-day SMA), and then re-tests $212 as support. A close back above $212 would restore the prior support structure and neutralize the breakdown signal. Only above $212 does the bullish channel structure re-engage.
Bearish Scenario
A sustained daily close below the 200-day SMA at $204.38 — followed by a break below $190 — invalidates the rising channel entirely. In that scenario, the analyst’s stated downside targets are $170 and $154–$155, representing approximately 17% and 25% additional downside from the current $204.64, respectively.
The structural question NVDA is answering right now is not specific to one stock. It is whether AI infrastructure weakness is contained or spreading. The 200-day SMA break is the first quantifiable data point in that answer. Watch $190 — loss of that level ends the bull channel and opens $170.
Frequently Asked Questions
What happens to NVDA if the $190 support level breaks?
Is NVDA’s 200-day SMA break confirmed or just an intraday touch?
What would reverse the NVDA breakdown signal?
Why does NVDA’s chart matter for the broader AI trade?
Source: Ali Charts · Published by CoinsProbe Markets Desk
The opinions and market insights shared on CoinsProbe represent the views of individual authors based on prevailing market conditions at the time of publication. Cryptocurrency investments carry significant risk and volatility. Readers are encouraged to conduct their own research and seek professional financial advice before making investment decisions. CoinsProbe and its contributors do not accept responsibility for financial losses or decisions made based on published content.
CoinsProbe may publish sponsored articles, affiliate links, or promotional collaborations. All sponsored material is clearly labeled to maintain transparency with our audience. Our editorial decisions remain fully independent, and advertising partnerships do not influence reviews, rankings, or published opinions.
Since 2023, CoinsProbe has delivered reliable insights on cryptocurrency, blockchain, and digital assets. Our content is created by experienced researchers and analysts who follow strict editorial standards focused on accuracy, transparency, and credibility. Every article is carefully reviewed and verified using trusted sources and current market data. We provide unbiased analysis and timely updates covering everything from emerging crypto projects to major industry developments.