
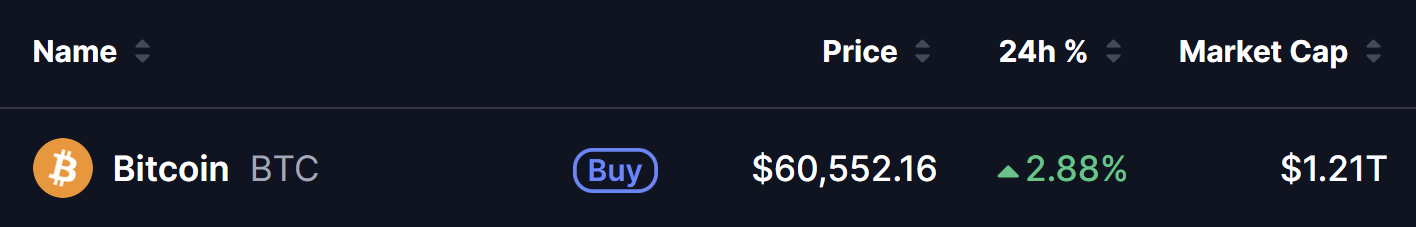
- Bitcoin is trading near $60,552, up 2.9% in the past 24 hours.
- Analyst Ali Martinez notes that trading below the 200-week SMA has historically marked strong long-term buying opportunities.
- On-chain data shows retail investors and whales have returned to accumulation over the past month.
- Broad-based buying across wallet sizes suggests Bitcoin may be forming a market bottom.
Bitcoin is sending two simultaneous signals that deserve attention — one from its most important long-term technical indicator, and one from the behaviour of the market’s participants across every level of wallet size. Together, they describe a setup that has historically been one of the strongest long-term entry conditions the asset produces.
Bitcoin Price at a Glance — July 2, 2026
Signal 1 — The 200-Week SMA: Bitcoin’s Most Reliable Long-Term Floor
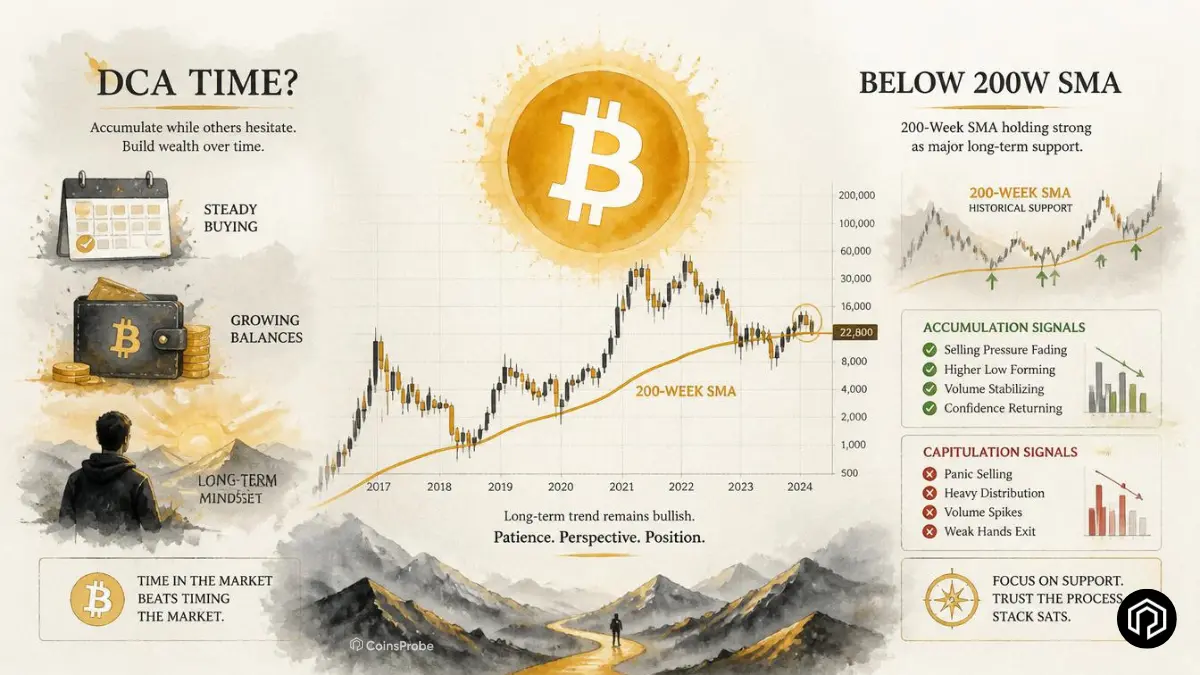
Analyst @alicharts highlighted a simple but historically powerful observation: Bitcoin rarely trades below its 200-week simple moving average (SMA) — and when it does, those brief periods have consistently represented some of the most exceptional long-term buying opportunities in the asset’s history.
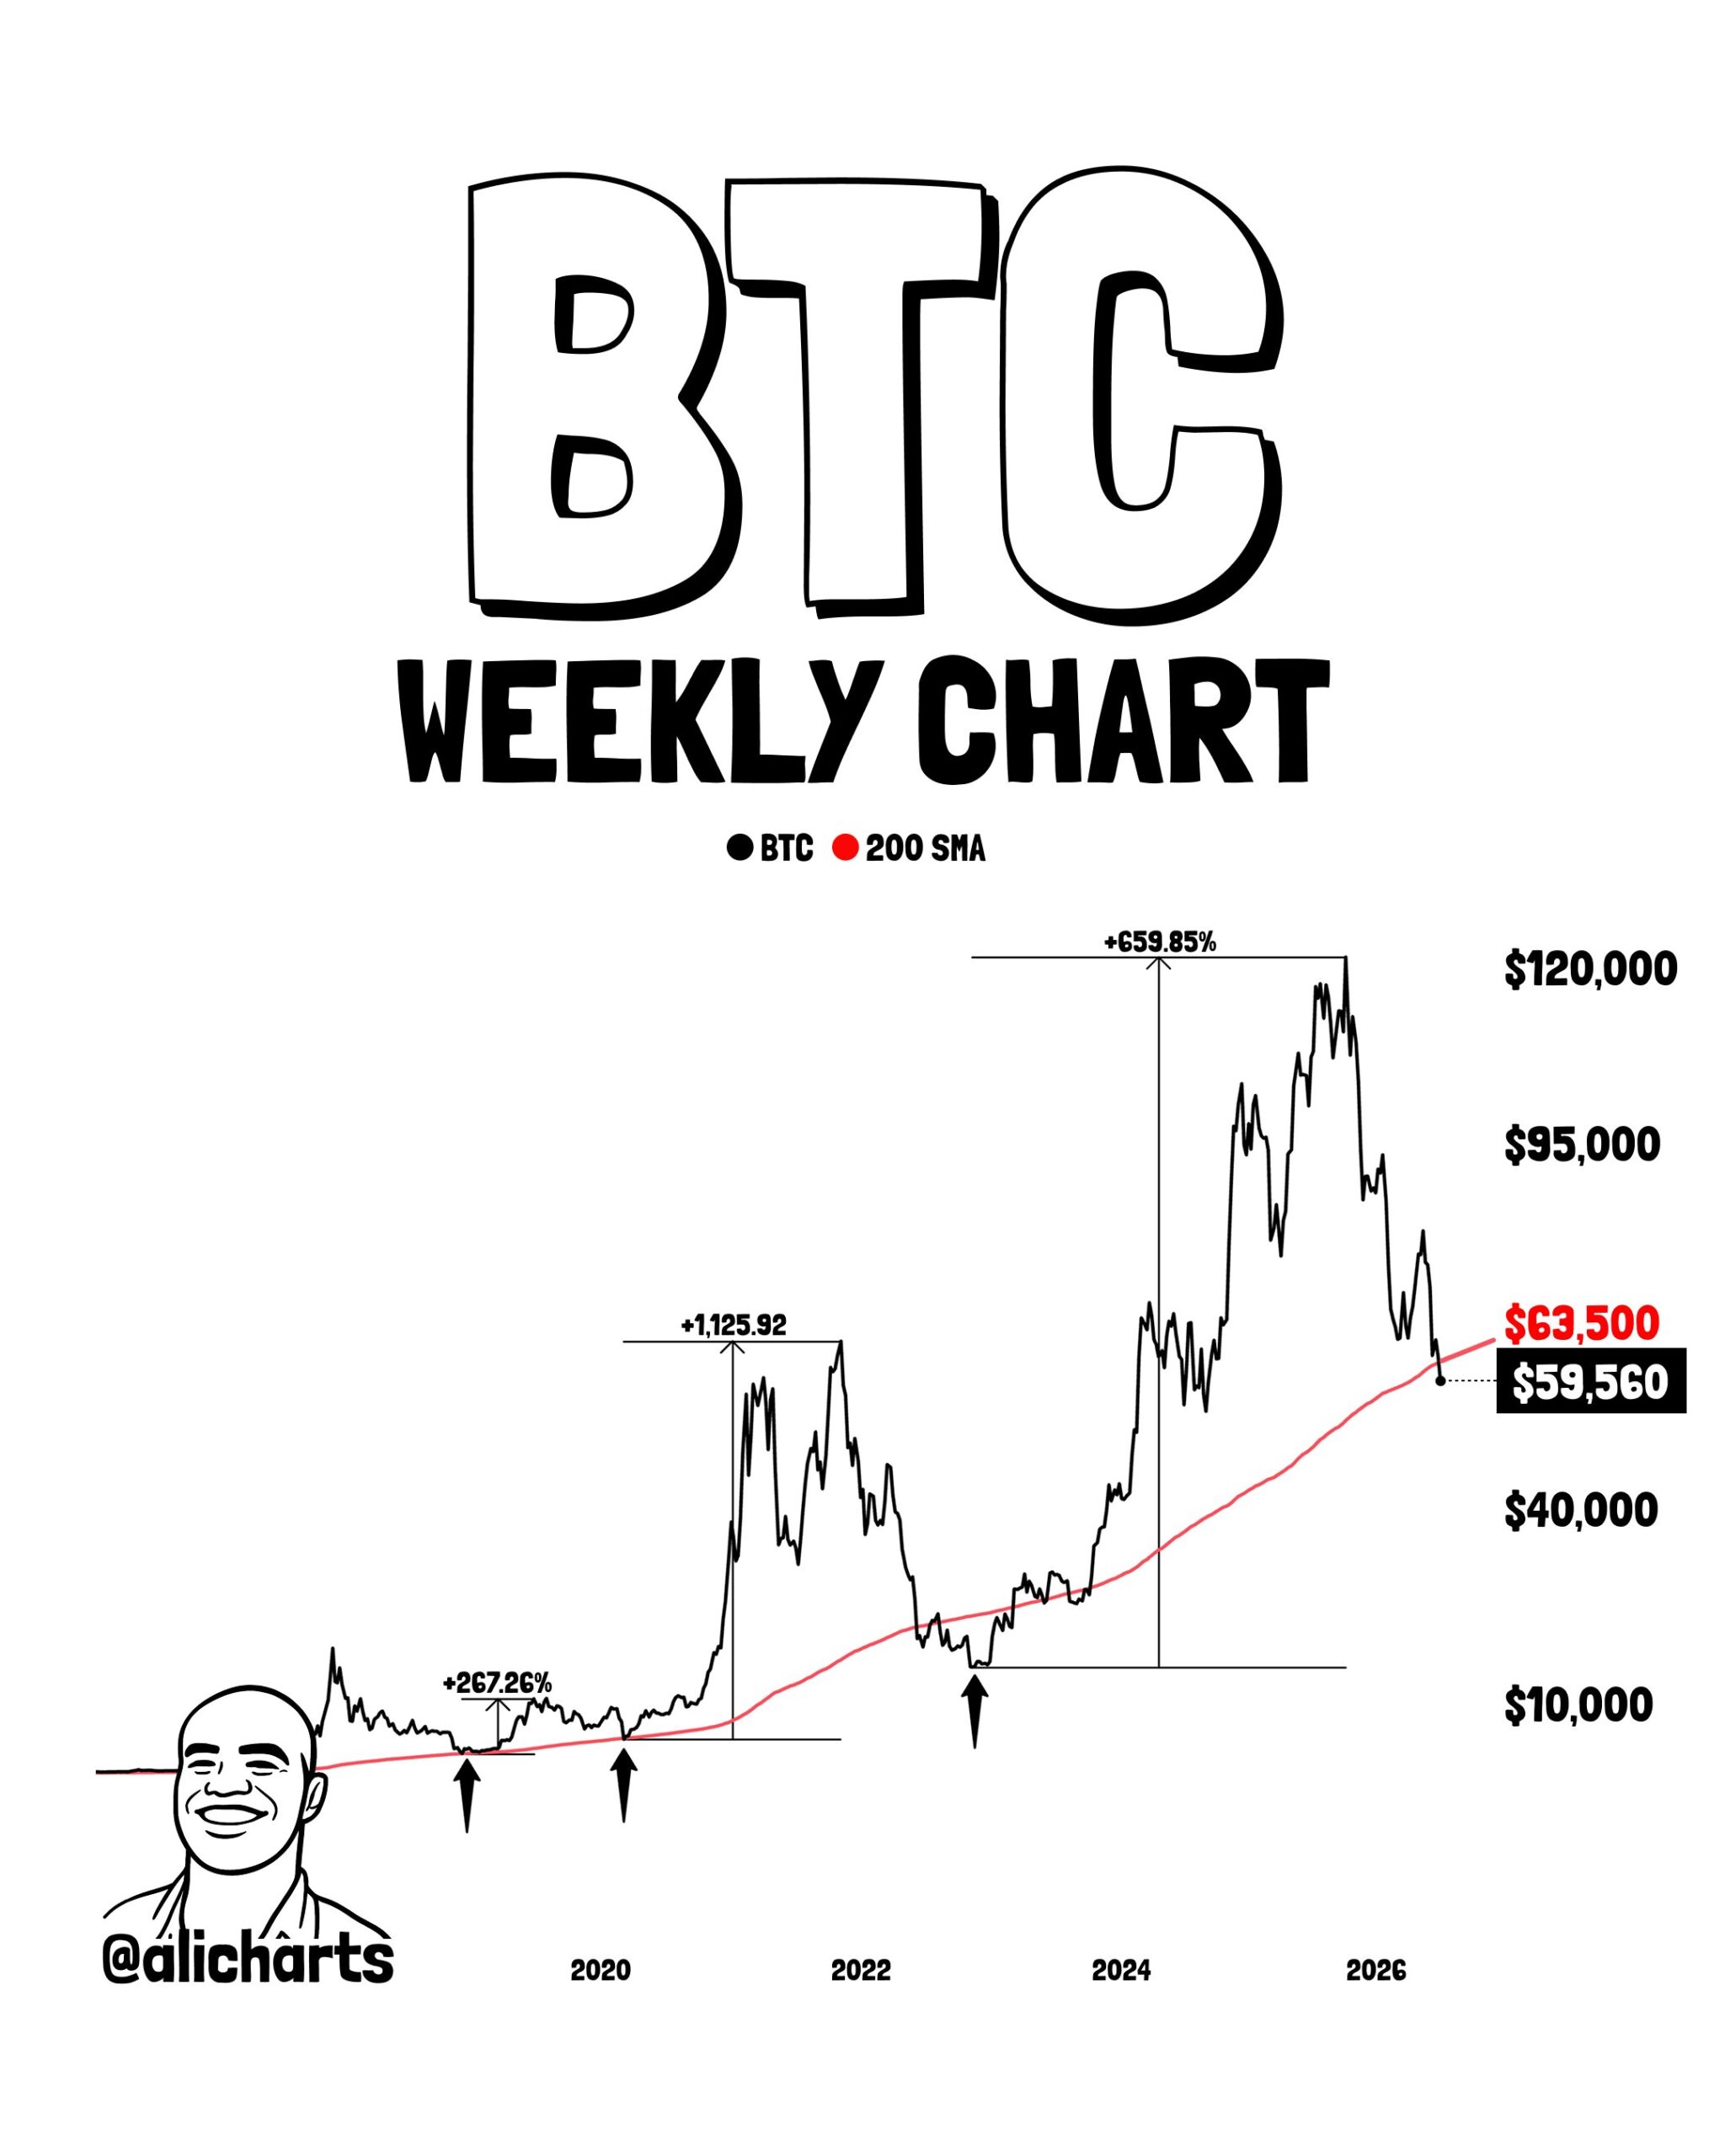
Why the 200-week SMA matters:
The 200-week SMA is the longest commonly tracked moving average in Bitcoin’s technical analysis toolkit. Because it averages price across approximately four years of trading — nearly the full length of a complete Bitcoin cycle — it captures the asset’s long-term trend far more reliably than any shorter-term indicator.
When Bitcoin trades below this level — even briefly — it means the current price is below the average of the past four years of market activity. In practical terms, this has historically represented the most extreme value zone Bitcoin produces in a given cycle — a price that, when viewed over a multi-year horizon, has always eventually been surpassed significantly.
The historical pattern: The periods when Bitcoin has traded at or below the 200-week SMA — visible in prior bear market lows — have each been followed by recoveries that substantially exceeded those lows. As we covered in our Bitcoin on-chain bottom signal analysis and our Wyckoff Phase B accumulation article, the structural on-chain picture has been pointing toward this kind of historically significant accumulation zone for several weeks.
The DCA implication: @alicharts specifically frames this as an ideal environment for a dollar-cost averaging (DCA) strategy — buying gradually over time rather than attempting to identify the exact single-day bottom. When a price zone is identified as historically significant through a major long-term indicator like the 200-week SMA, committing a fixed amount regularly allows investors to build a position throughout the zone rather than risking a single poorly-timed lump-sum entry.
Signal 2 — Coordinated Accumulation Across All Wallet Sizes
While the 200-week SMA provides the technical framework, the wallet-size cohort data provides the behavioural confirmation: something meaningful has shifted in how participants at every level of the market are positioning.
Over the past 30 days — following months of net selling pressure during the correction — investors across multiple wallet size categories have flipped from net selling to net buying simultaneously.
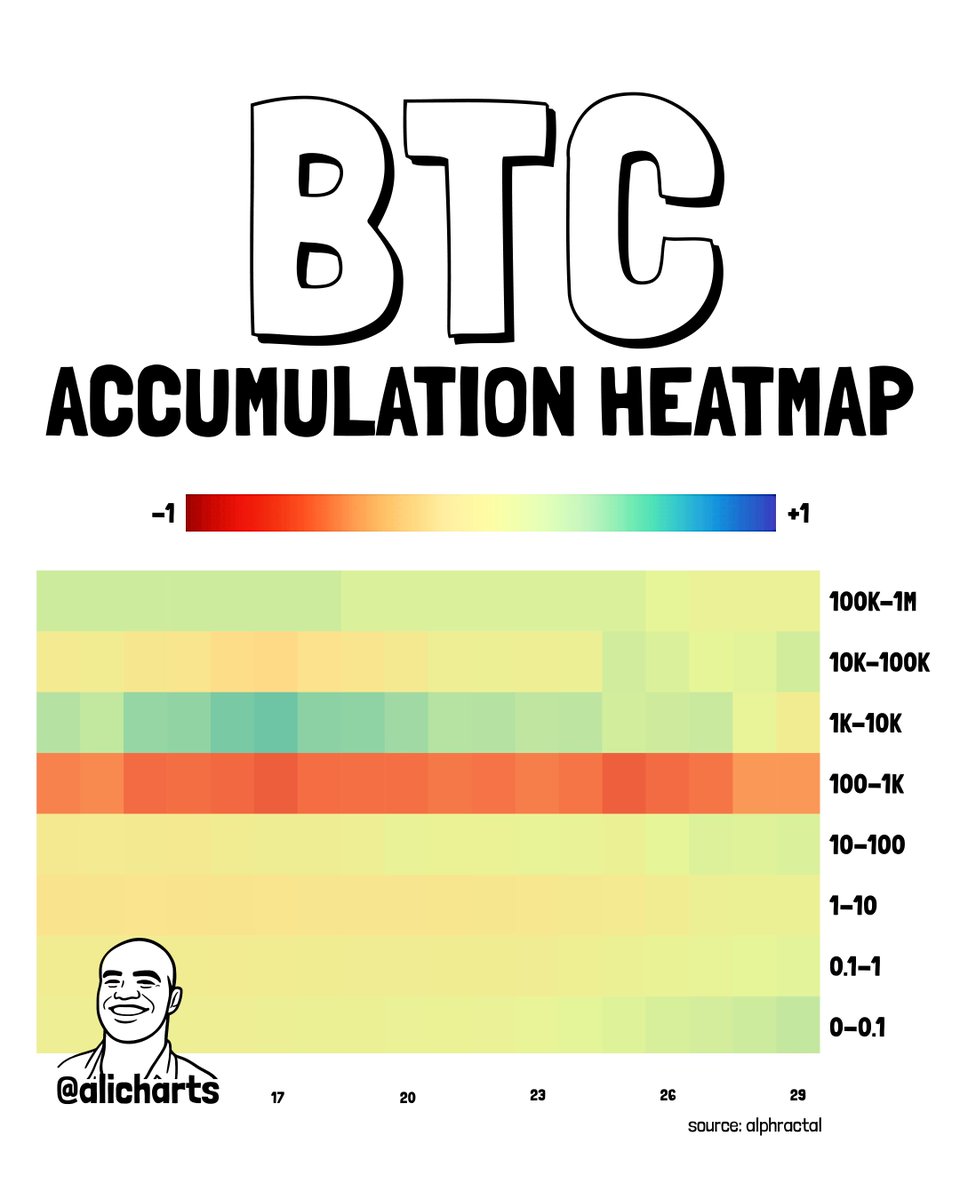
Retail investors (under 1 BTC):
The smallest wallet holders — typically the most retail-oriented and sentiment-driven segment — have increased their buying intensity meaningfully over the past 30 days. This shift matters specifically because retail buying during a price correction, rather than selling, reflects genuine value perception at current prices rather than momentum chasing.
Mid-sized whales (10–100 BTC):
This cohort — representing experienced individual investors and smaller institutional participants — has also turned actively accumulative. The 10–100 BTC range is particularly significant as a signal because it tends to represent participants with enough capital to have survived multiple market cycles and enough discipline to distinguish between short-term volatility and longer-term value.
Large entities (1,000–100,000 BTC):
The largest tracked wallet category — including entities like institutional funds, custodians, and other large holders — has stopped net selling and flipped to net buyers, though at a more measured and cautious pace than smaller cohorts. This measured scaling-in from large entities is actually consistent with how major capital allocators typically enter: gradually, through accumulation over time, rather than aggressively at a single price point.
Why All Three Cohorts Moving Together Matters
The truly unusual and historically significant element of the current data is not that any single cohort is accumulating — it is that all three are doing so simultaneously.
Each cohort typically has different motivations, time horizons, and price sensitivities. Retail investors tend to be sentiment-driven and often buy into strength and sell into weakness. Mid-sized whales tend to be more contrarian and value-focused. Large entities move slowly and strategically. When all three groups reach the same conclusion — that current prices represent a buying opportunity — it reflects a convergence of assessments across the full spectrum of market participants.
This kind of coordinated multi-cohort accumulation reduces available liquid supply from multiple directions at once — retail buyers are not selling their small holdings, mid-sized participants are actively adding, and large entities have stopped distributing into the market. The combined effect is a meaningful reduction in the selling pressure available to push prices lower, while simultaneously building an on-chain supply base at current prices.
As we covered in our LTH supply in loss and accumulation article — the Long-Term Holder picture has been showing the same underlying dynamic from a different analytical angle: conviction holders continuing to accumulate even while underwater.
What This Setup Has Historically Preceded
The combination of Bitcoin trading near or below its 200-week SMA while all major wallet size cohorts flip to net buying simultaneously has appeared in a limited number of instances in Bitcoin’s history — and each prior instance preceded a significant long-term price recovery.
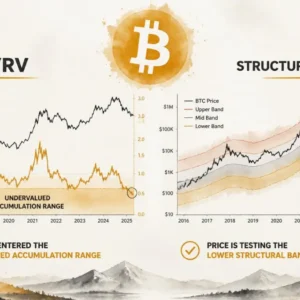
This does not mean the recovery begins immediately. As we covered in our Bitcoin cycle momentum analysis — the bear market has not yet produced a confirmed reversal signal from CryptoQuant’s cycle momentum indicator, and the MVRV realised price test near $50,000–$55,000 remains an unresolved variable. Short-term volatility can and does still occur even within historically significant accumulation zones.
But the structural backdrop — a price level that Bitcoin has historically returned above consistently, combined with a coordinated shift from selling to buying across retail, mid-sized, and large wallet cohorts simultaneously — is as constructive a long-term setup as Bitcoin regularly produces.
The DCA Framework — Practical Implications
@alicharts’ framing of the 200-week SMA context as a DCA opportunity reflects the most practically sound approach to historically significant accumulation zones: systematic, time-distributed buying rather than a single-point entry.
The logic:
- Historically significant accumulation zones are rarely single-day events — they extend over weeks or months
- Attempting to identify the exact bottom within the zone requires perfect timing that even the most sophisticated analysts rarely achieve consistently
- DCA into an identified high-value zone captures an average entry price across the zone rather than risking a single poorly-timed entry
- When combined with the kind of multi-cohort accumulation signal currently visible, the DCA approach aligns personal buying behaviour with what the largest and most historically successful market participants are already doing
Bottom Line
Bitcoin at $60,552 is presenting two simultaneous signals that have historically identified high-value accumulation zones: proximity to the 200-week SMA — the long-term floor that Bitcoin has consistently traded above over extended periods — and a coordinated flip to net buying across retail, mid-sized whale, and large entity wallet cohorts simultaneously.
Neither signal guarantees an immediate price reversal, and macro headwinds including the BOJ rate cycle and Fed policy uncertainty remain active. But the combination of a historically significant technical level and multi-cohort behavioural confirmation describes the kind of setup that patient, long-term disciplined buyers have historically been rewarded for recognising — even when near-term volatility continues.
The market’s participants, at nearly every level, are telling you something. Whether you listen to them or wait for perfect clarity is the actual decision that matters here.
Frequently Asked Questions
Why is the 200-week SMA significant for Bitcoin?
It averages price across approximately four years of trading — capturing Bitcoin’s full cycle trend. When Bitcoin trades at or below this level, it has historically represented an exceptional long-term accumulation zone.
Which wallet size cohorts are now accumulating?
Retail (under 1 BTC), mid-sized whales (10–100 BTC), and large entities (1,000–100,000 BTC) have all flipped from net selling to net buying over the past 30 days — a relatively rare coordinated signal.
Why does multi-cohort accumulation matter?
When participants across all wallet sizes buy simultaneously, it reduces available liquid supply from multiple directions at once — building a stronger on-chain foundation at current prices than single-cohort buying alone.
Does this guarantee a Bitcoin recovery?
No — short-term volatility can still occur within accumulation zones, and macro headwinds including the BOJ rate cycle and Fed policy uncertainty remain active. The signal establishes a constructive structural backdrop, not a guaranteed outcome.
The opinions and market insights shared on CoinsProbe represent the views of individual authors based on prevailing market conditions at the time of publication. Cryptocurrency investments carry significant risk and volatility. Readers are encouraged to conduct their own research and seek professional financial advice before making investment decisions. CoinsProbe and its contributors do not accept responsibility for financial losses or decisions made based on published content.
CoinsProbe may publish sponsored articles, affiliate links, or promotional collaborations. All sponsored material is clearly labeled to maintain transparency with our audience. Our editorial decisions remain fully independent, and advertising partnerships do not influence reviews, rankings, or published opinions.
Since 2023, CoinsProbe has delivered reliable insights on cryptocurrency, blockchain, and digital assets. Our content is created by experienced researchers and analysts who follow strict editorial standards focused on accuracy, transparency, and credibility. Every article is carefully reviewed and verified using trusted sources and current market data. We provide unbiased analysis and timely updates covering everything from emerging crypto projects to major industry developments.