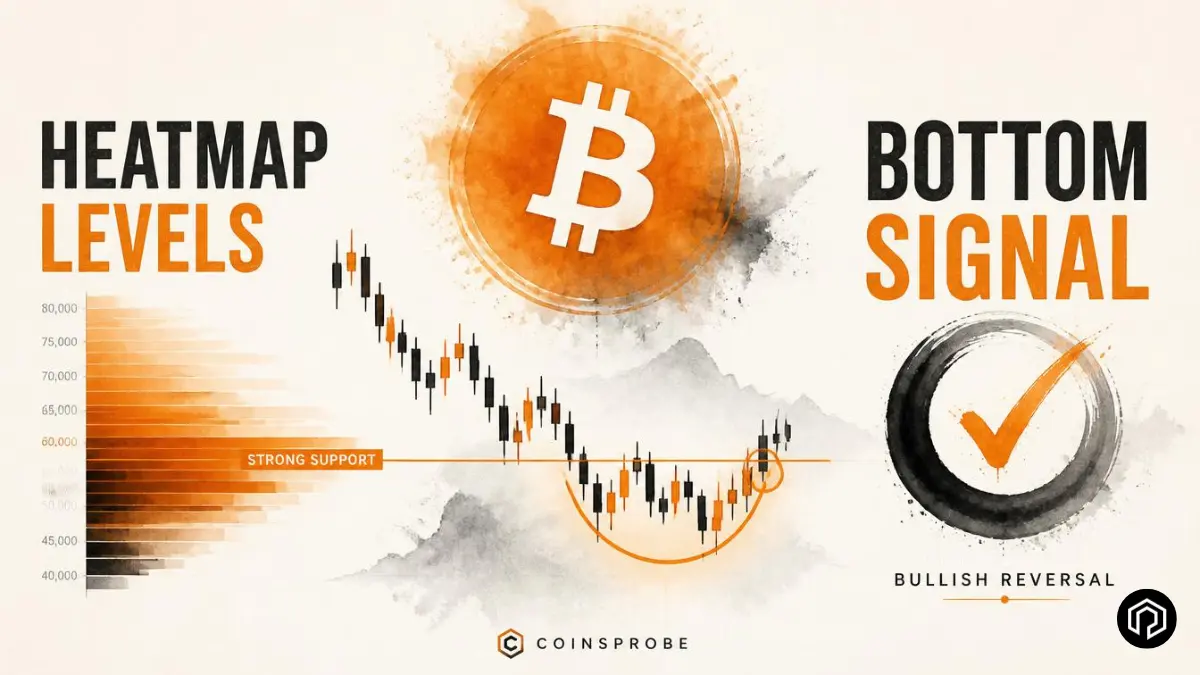

- BTC is trading near $63,500–$63,700 on August 13, 2026, after July CPI came in at 3.4% annually — slightly cooler than the prior 3.5% reading and broadly in line with expectations.
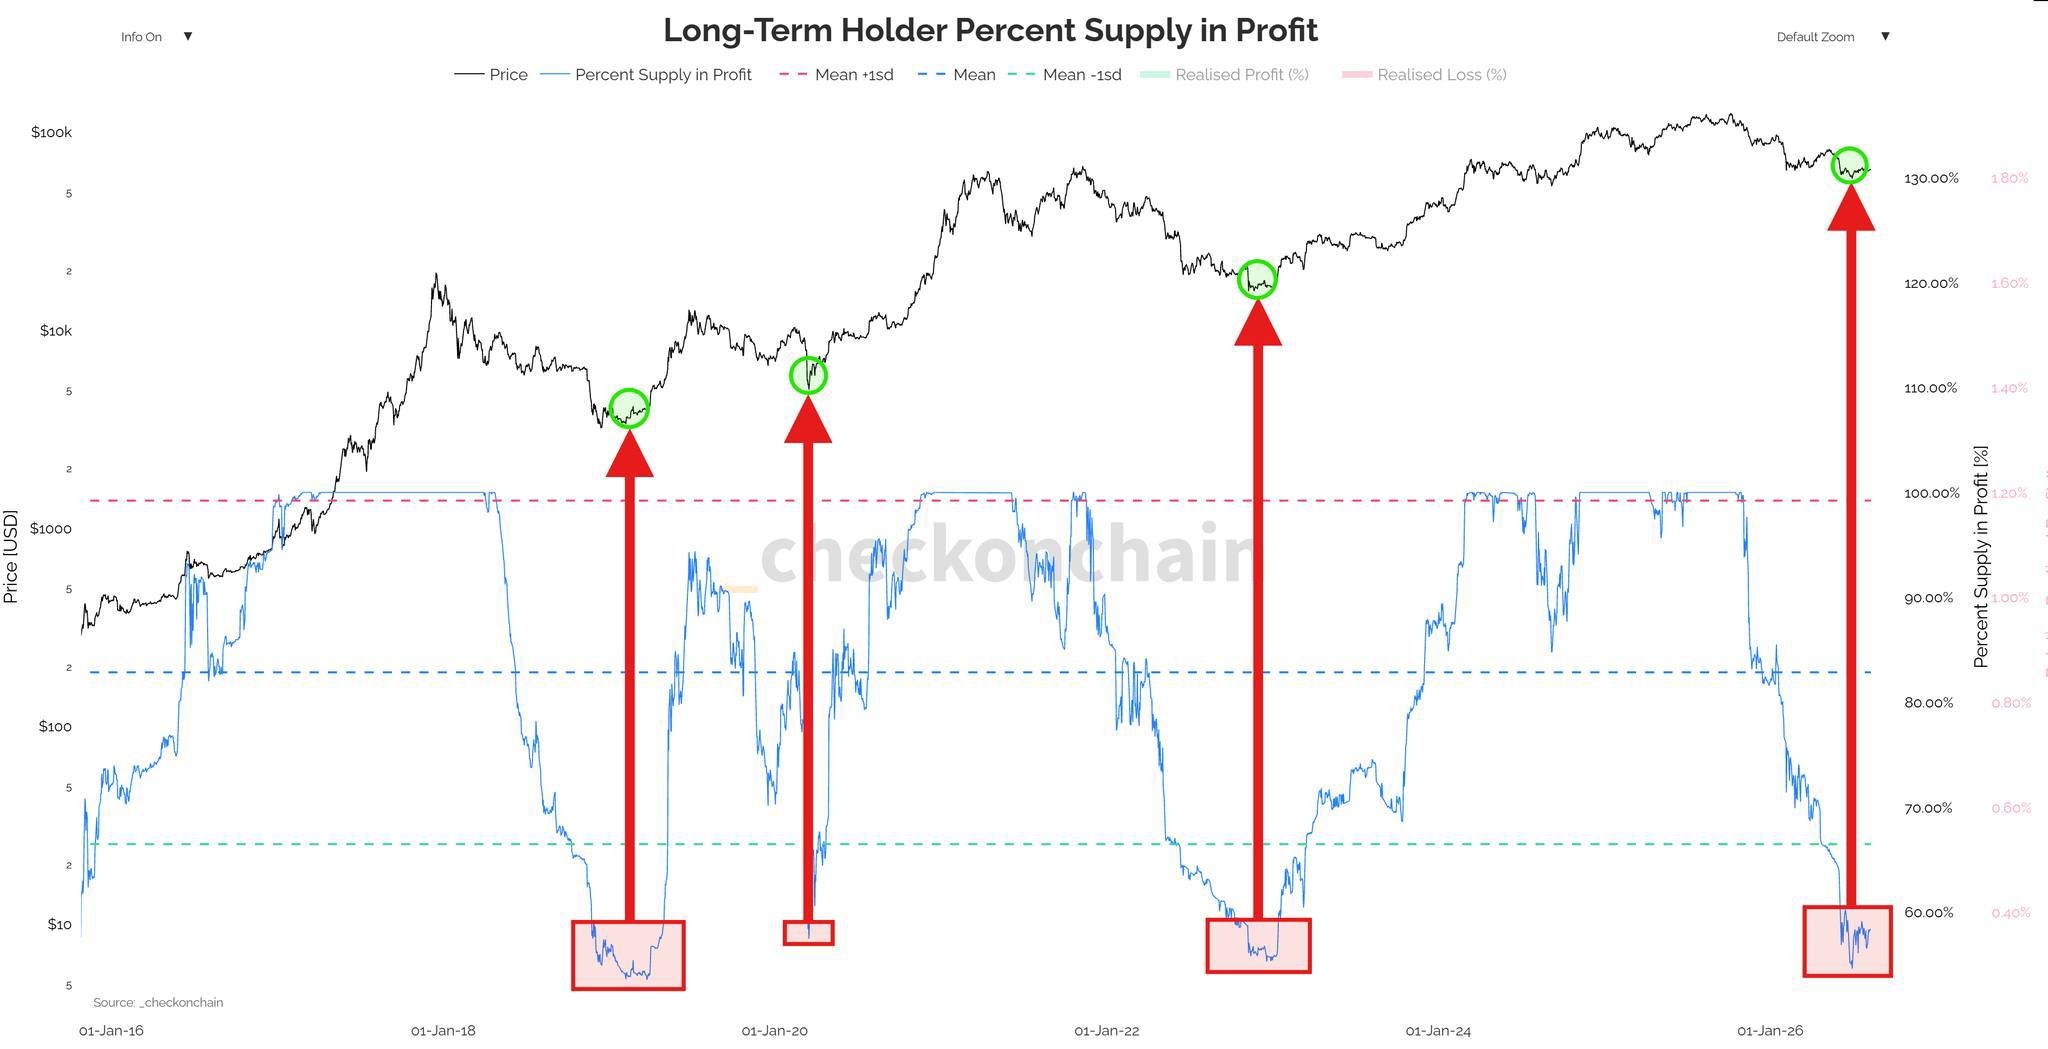
- The Long-Term Holder Percent Supply in Profit has dropped to the ~60% zone — the same level that preceded major recoveries following the late 2018, early 2020, and mid-2022 cycle bottoms.
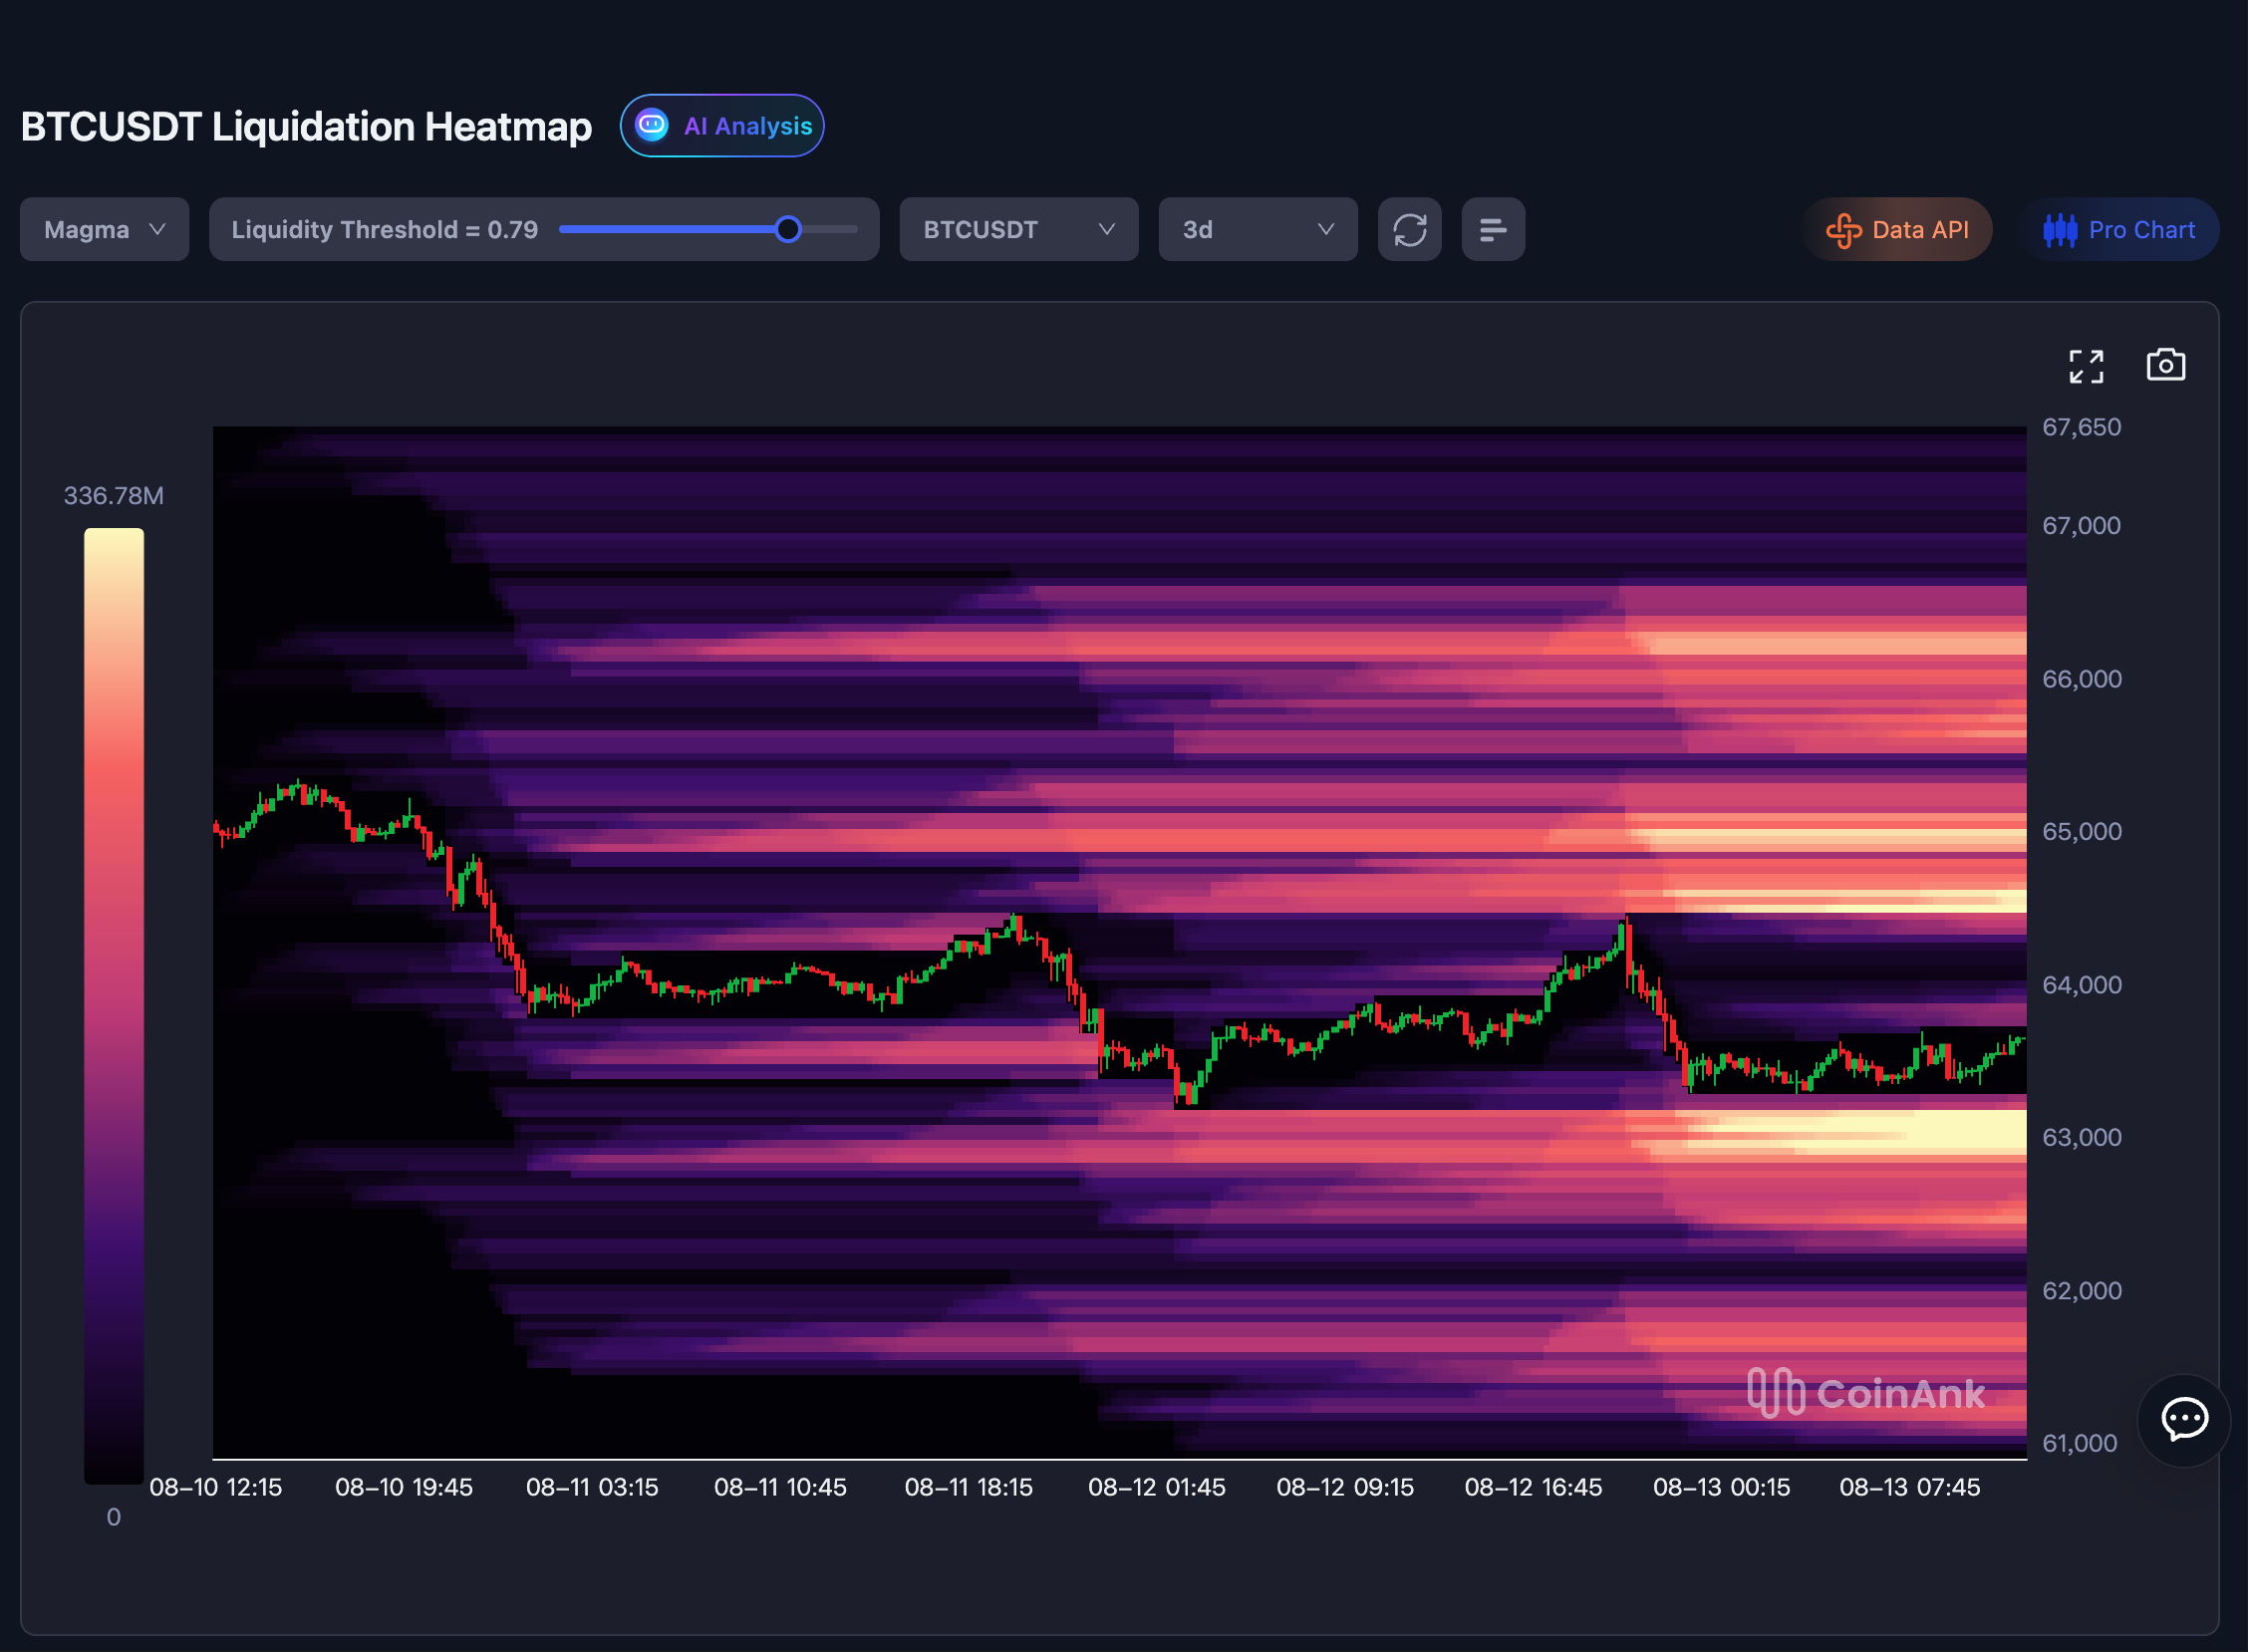
- Bitcoin is coiled between two dense liquidation clusters: $64,800–$65,500 (short liquidations above) and $62,800–$63,200 (long liquidations below) — a setup primed for a sharp directional move.
Bitcoin absorbed the July CPI print on August 13 and did exactly what a market caught between conflicting signals does — nothing. Price held in the $63,500–$63,700 range as traders weighed a cooler-than-feared inflation reading against a derivatives structure that has compressed BTC into one of its tightest liquidation squeeze setups of recent months.
But beneath the flat price action, one of the most historically significant on-chain metrics in Bitcoin analysis has just fired a signal that has not appeared in this form since the major cycle bottoms of 2018, 2020, and 2022.
July CPI — What the Data Actually Said
The July 2026 CPI release delivered what markets broadly classified as a soft but not transformative inflation print:
Headline CPI rose 0.1% month-over-month on a seasonally adjusted basis and 3.4% year-over-year — a modest step down from June’s 3.5% annual reading. Core CPI (excluding food and energy) increased 0.2% monthly and 2.5% annually, matching market expectations and continuing the gradual moderation trend that has characterized inflation data through 2026.
The reading is constructive for risk assets in the sense that it does not add pressure for additional Federal Reserve tightening — the higher-for-longer rate narrative does not get meaningfully reinforced by a 3.4% YoY print trending toward 3.5%. But it is also not the kind of definitively dovish surprise that historically triggers immediate risk-on positioning into assets like Bitcoin.
The net result: macro pressure eased marginally, but not enough to independently catalyze a directional break. The CPI print cleared the immediate hurdle without providing the catalyst. That leaves the on-chain and derivatives picture as the dominant framework for the sessions ahead.
As covered in our Bitcoin pre-CPI whale accumulation and Hyperliquid leverage analysis, the setup heading into the CPI was already defined by a specific tension between whale-level accumulation and concentrated high-leverage positioning. The post-CPI consolidation has not resolved that tension — it has preserved it.
Long-Term Holder Profitability — A Signal That Has Only Appeared at Cycle Bottoms
The most historically significant development in today’s Bitcoin data is not the CPI reaction — it is what the Long-Term Holder Percent Supply in Profit chart is now showing.
This metric, sourced from @randgroup (X), tracks the percentage of Bitcoin held by long-term holders (typically defined as wallets that have not moved their coins for 155 days or more) that is currently in an unrealized profit position. It is one of the most reliable macro-level sentiment and positioning indicators in Bitcoin’s on-chain toolkit — precisely because long-term holders are the most conviction-driven cohort in the ecosystem, and when even they are largely underwater, it marks a specific and historically rare condition.
The Historical Track Record
The chart tells the story with striking visual clarity. The Long-Term Holder Percent Supply in Profit has dropped to approximately the 60% zone — and every prior instance of a reading at this level has aligned with a major Bitcoin cycle bottom:
| Date | LTH Profit % Reading | What Followed |
|---|---|---|
| Late 2018 | ~60% zone | Multi-month base → major recovery rally |
| Early 2020 | ~60% zone | COVID low → explosive recovery and new ATH |
| Mid-2022 | ~60% zone | Cycle bottom → 2023 recovery and new ATH cycle |
| August 2026 | ~60% zone | Current — pending |
Each prior instance of the LTH Percent Supply in Profit dropping to the ~60% level was followed by a significant and sustained price recovery — not immediately, but within the weeks and months that followed. The metric’s value is not as a precise timing tool but as a macro positioning indicator: when the long-term holder cohort — the most patient and informed participants in the Bitcoin market — is this broadly underwater, the historical pattern strongly suggests the later stages of a corrective period rather than the early stages of a deeper decline.
What This Reading Means Structurally
A ~60% LTH profit reading means that approximately 40% of all Bitcoin held by long-term holders is currently at an unrealized loss at today’s price near $63,700. These are holders who have not sold through the entire 2026 corrective phase — they are by definition the highest-conviction participants in the market. The fact that 40% of them are underwater reflects how significant the correction from 2025 highs has been.
But it also creates a specific supply dynamic: long-term holders who are underwater are overwhelmingly unlikely to sell at current prices — they have already demonstrated that by holding through the decline. This means the supply overhang from this cohort is lower than it might appear, because the holders most likely to have sold have already done so. What remains is a concentrated group of high-conviction holders absorbing rather than adding to downward price pressure.
As documented in our Bitcoin macro bottom signals analysis and Bitcoin network activity 12-month high analysis, the current on-chain environment has been accumulating bottom-formation signals across multiple independent frameworks. The LTH Percent Supply in Profit dropping to the ~60% zone is among the most historically grounded additions to that body of evidence.
Liquidation Heatmap — Bitcoin Coiled Between Two High-Density Zones
While the on-chain picture points toward the later stages of a corrective period, the derivatives market is presenting a more immediate structural challenge: Bitcoin is currently sandwiched between two of the most concentrated liquidation clusters visible on the 3-day BTCUSDT heatmap.
(X)
The Squeeze Setup
Upper liquidation zone — $64,800 to $65,500:
This band represents a high-intensity cluster of short position liquidations. A sustained move into this zone would force short sellers to buy back their positions — creating forced buying that amplifies upward momentum beyond what organic demand alone would produce. This is the classic short squeeze setup: price moves up, short liquidations cascade, momentum accelerates.
Lower liquidation zone — $62,800 to $63,200:
This band represents a concentrated cluster of long position liquidations. A sustained move into this zone would force long holders to exit — creating forced selling that amplifies downward momentum. This is the long liquidation cascade: price moves down, longs get stopped out, selling pressure accelerates.
What the Setup Means for the Next Move
Bitcoin at $63,700 is positioned approximately $1,100 above the lower long liquidation zone and approximately $1,100–$1,800 below the upper short liquidation zone — nearly equidistant between the two clusters.
This geometric positioning creates a specific market dynamic: the next directional move, once initiated, is likely to be amplified by whichever liquidation cluster it reaches first. A move toward $64,800–$65,500 triggers short covering. A move toward $62,800–$63,200 triggers long liquidations. In either case, the concentration of leverage at these specific levels means the initial move is unlikely to stop cleanly at the liquidation zone boundaries — it will tend to overshoot as cascading liquidations add momentum.
The cooler CPI print has not resolved this tension — it has preserved the coiled structure by removing the most bearish macro scenario (a surprise hot print forcing a sharp risk-off move) without providing enough bullish catalyst to immediately push price into the upper short liquidation zone.
What Happens Next — Two Scenarios
Bullish Scenario — Break Toward $64,800–$65,500
Spot demand strengthens following the soft CPI confirmation, pushing BTC above the immediate $64,000 resistance. Price enters the $64,800–$65,500 short liquidation cluster, triggering cascading short covering that amplifies the move. The LTH profitability signal at the ~60% zone begins to play out as it has at prior cycle bottoms — with accumulation by the highest-conviction holders providing a structural bid under price. The combination of macro relief (soft CPI), on-chain bottom signal (LTH ~60%), and short squeeze dynamics creates conditions for a move toward the $66,000–$68,000 range as the immediate post-squeeze target.
Bearish Scenario — Break Toward $62,800–$63,200
Selling pressure overwhelms the post-CPI equilibrium, pushing BTC below $63,200 and into the $62,800–$63,200 long liquidation zone. Cascading long liquidations amplify the move below $63,000, with the next meaningful support sitting in the $61,000–$61,500 range. In this scenario, the LTH profitability signal provides a macro-level floor thesis but not an immediate price floor — the metric indicates the later stages of a correction, not its precise end date. Lower prices would push the LTH profit reading even further below 60%, potentially creating an even stronger longer-term accumulation signal while testing short-term holder conviction.
Bottom Line
August 13 delivered a CPI print that removed the worst-case macro scenario without providing an independent bullish catalyst — leaving Bitcoin exactly where it was, caught between two powerful and opposing forces.
On-chain, the Long-Term Holder Percent Supply in Profit at ~60% is the most historically grounded bottom signal Bitcoin has produced in this corrective cycle — a reading that has aligned with the 2018, 2020, and 2022 cycle lows with striking consistency. In derivatives, the $64,800–$65,500 short liquidation cluster above and the $62,800–$63,200 long liquidation zone below define a coiled setup where the next directional break will be amplified rather than absorbed.
The on-chain signal says the macro picture is constructive. The derivatives structure says the next move will be sharp. The CPI data says the worst macro pressure has eased. Put together: Bitcoin is positioned for a significant directional move — the question of timing and direction is what the $62,800–$65,500 range will answer in the sessions ahead.
Frequently Asked Questions
What did the July 2026 CPI print show?
July CPI rose 0.1% month-over-month and 3.4% year-over-year — slightly cooler than June’s 3.5% annual reading. Core CPI came in at 0.2% monthly and 2.5% annually, matching expectations and continuing the gradual moderation trend in U.S. inflation data.
What is the Bitcoin’s Long-Term Holder Percent Supply in Profit signal?
This Checkonchain metric tracks what percentage of Bitcoin held by long-term holders is currently in unrealized profit. The current reading of approximately 60% matches levels seen at the late 2018, early 2020, and mid-2022 cycle bottoms — each of which preceded significant multi-month Bitcoin recoveries.
The opinions and market insights shared on CoinsProbe represent the views of individual authors based on prevailing market conditions at the time of publication. Cryptocurrency investments carry significant risk and volatility. Readers are encouraged to conduct their own research and seek professional financial advice before making investment decisions. CoinsProbe and its contributors do not accept responsibility for financial losses or decisions made based on published content.
CoinsProbe may publish sponsored articles, affiliate links, or promotional collaborations. All sponsored material is clearly labeled to maintain transparency with our audience. Our editorial decisions remain fully independent, and advertising partnerships do not influence reviews, rankings, or published opinions.
Since 2023, CoinsProbe has delivered reliable insights on cryptocurrency, blockchain, and digital assets. Our content is created by experienced researchers and analysts who follow strict editorial standards focused on accuracy, transparency, and credibility. Every article is carefully reviewed and verified using trusted sources and current market data. We provide unbiased analysis and timely updates covering everything from emerging crypto projects to major industry developments.