
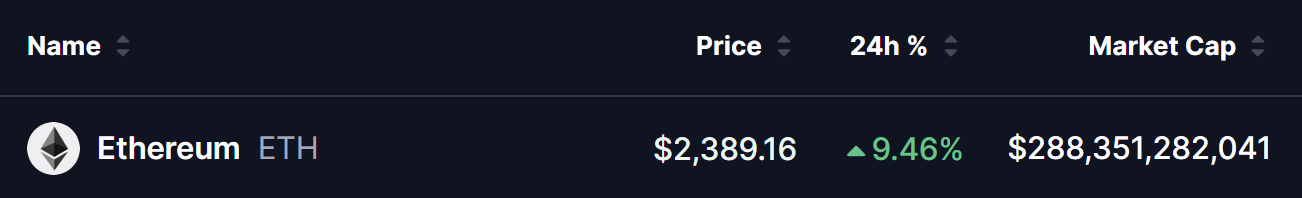
- Ethereum (ETH) at $2,389 — Surging +9.46% in the last 24 hours with a market cap of $288.35 billion as of April 14, 2026.
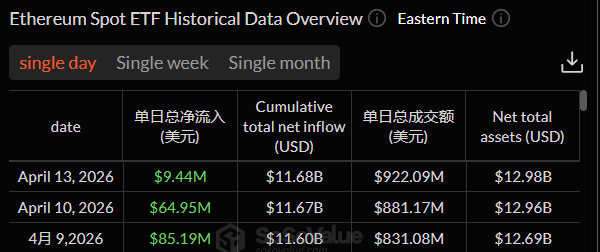
- Spot Ethereum ETFs show steady institutional demand: +$9.44M (Apr 13), +$64.95M (Apr 10), and +$85.19M (Apr 9), driving cumulative net inflows to $11.68 billion.
- Ascending Triangle Pattern in play on the daily chart since February 2026, with rising support and resistance firmly at $2,395.
- Bullish Breakout Target: A decisive close above $2,395 could trigger a measured move toward $3,036 (~27% upside), potentially pushing ETH past $3,000.
- Bearish Risk: Rejection at $2,395 may lead to a short-term pullback toward the rising support near $2,115 (or $2,038), though the overall higher-low structure would remain intact if support holds.
As of April 14, 2026, Ethereum (ETH) is trading at $2,389.16, marking a strong +9.46% gain in the last 24 hours. The cryptocurrency’s market capitalization stands at approximately $288.35 billion, reflecting renewed bullish momentum across the broader crypto market.
ETH has reclaimed key levels after a volatile start to 2026, with buyers stepping in aggressively near recent lows. The 4-hour and daily charts show ETH pushing toward a critical horizontal resistance zone near $2,395, setting the stage for a potential major breakout.
Ethereum Spot ETF Inflows: Steady Institutional Demand
U.S. spot Ethereum ETFs continue to attract consistent capital, underscoring growing institutional confidence even amid price volatility. Recent daily net inflows (in USD millions):
- April 13, 2026: +$9.44M
- April 10, 2026: +$64.95M (BlackRock’s ETHA led with a significant portion)
- April 9, 2026: +$85.19M
Cumulative total net inflows have now reached approximately $11.68 billion as of April 13. Total net assets across the Ethereum spot ETFs stand at around $12.98 billion.
Earlier in April, spot ETFs also saw a standout $120 million net inflow on April 6, highlighting periodic surges in institutional buying.
Can ETH Breakout Past $3,000? — Ascending Triangle in Play
On the 4H chart, Ethereum is forming a classic ascending triangle pattern that has been developing since February 2026. This bullish continuation structure is defined by a series of higher lows pressing upward against a well-established horizontal resistance zone near $2,395.
Price action shows ETH consistently respecting the rising support trendline, with buyers stepping in on every dip. Most recently, ETH bounced cleanly from this ascending support at $2,038 and has once again pushed back toward the upper boundary of the triangle around the $2,390 region.
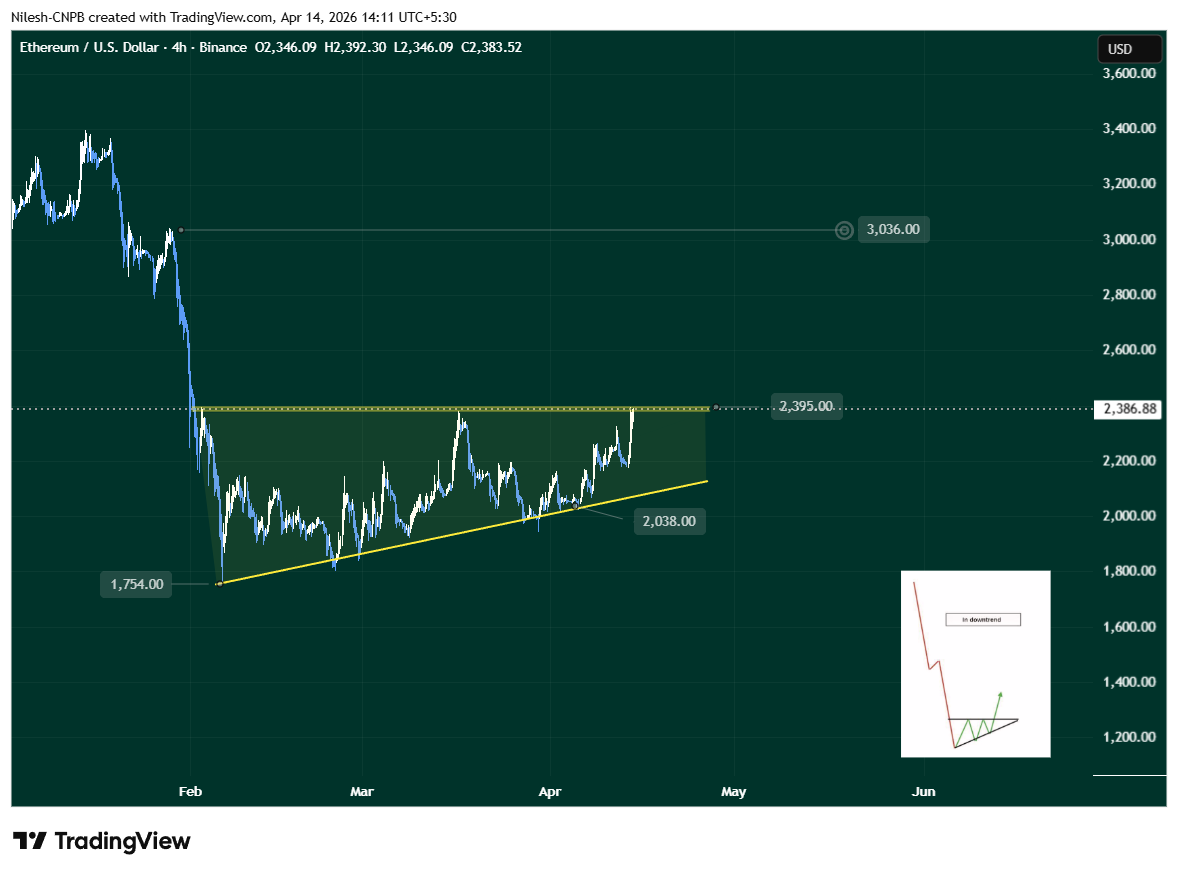
The pattern is textbook: higher lows signal increasing buyer strength, while the flat resistance reflects sellers defending the same level. A breakout from this setup often precedes strong upside moves in trending markets.
What’s Next for ETH?
From current levels near $2,389, the immediate focus is on the $2,395 resistance.
Bullish Scenario:
A clean daily close above the $2,395 level — ideally followed by a successful retest — would be a major technical signal, confirming the ascending triangle breakout. If that occurs, the measured move projection of the pattern points toward a potential upside target near $3,036. From current levels, this represents roughly 27% upside, aligning with the projected extension visible on the chart. A move past $3,000 would mark a significant psychological and technical milestone, potentially opening the door to further gains in a broader bull cycle.
Bearish Caution:
If ETH faces rejection at resistance, a short-term dip toward the rising support trendline near $2,115 (or even retesting the $2,038 area) remains possible. Importantly, such a pullback would still keep the overall bullish structure intact, provided the higher-low formation continues to hold.
Bottom Line
Ethereum is at a pivotal technical juncture. With spot ETF inflows providing institutional backing and a clear ascending triangle pattern forming on the daily chart, the setup favors bulls if resistance at $2,395 gives way. A confirmed breakout could propel ETH toward the $3,000–$3,036 zone in the coming weeks, while the supportive ETF flows add fundamental conviction to any technical upside.
Traders will be watching the $2,395 level closely in the days ahead. A decisive move here could define Ethereum’s trajectory for the rest of Q2 2026.
The opinions and market insights shared on CoinsProbe represent the views of individual authors based on prevailing market conditions at the time of publication. Cryptocurrency investments carry significant risk and volatility. Readers are encouraged to conduct their own research and seek professional financial advice before making investment decisions. CoinsProbe and its contributors do not accept responsibility for financial losses or decisions made based on published content.
CoinsProbe may publish sponsored articles, affiliate links, or promotional collaborations. All sponsored material is clearly labeled to maintain transparency with our audience. Our editorial decisions remain fully independent, and advertising partnerships do not influence reviews, rankings, or published opinions.
Since 2023, CoinsProbe has delivered reliable insights on cryptocurrency, blockchain, and digital assets. Our content is created by experienced researchers and analysts who follow strict editorial standards focused on accuracy, transparency, and credibility. Every article is carefully reviewed and verified using trusted sources and current market data. We provide unbiased analysis and timely updates covering everything from emerging crypto projects to major industry developments.