
- CryptoQuant flags accelerating profit-taking from short-term holders alongside cooling demand metrics as pullback risk rises
- STH-SOPR elevation historically preceded 21%–53% corrections in prior Bitcoin cycles before trend resumption
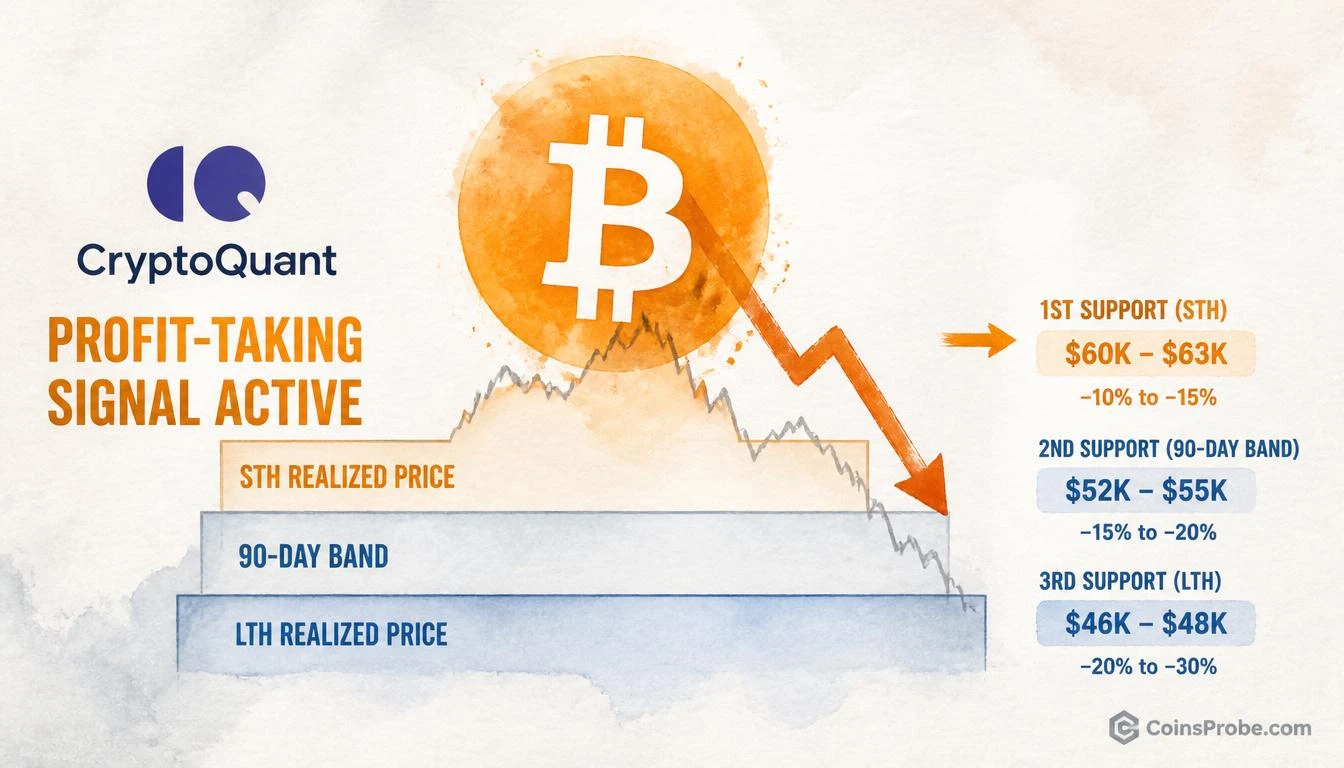
- Three on-chain support tiers identified: STH realized price, 90-day realized price band, and LTH realized price macro floor
- LTH realized price has never been sustainably breached during a confirmed Bitcoin bull market — only in 2018 and 2022 bear markets
Bitcoin is flashing caution signals at the on-chain level — and the data platform CryptoQuant (@cryptoquant_com) has published a dedicated report quantifying exactly how deep any corrective move could reach. Profit-taking is accelerating, demand metrics are cooling, and three specific price levels now define the structural floor traders need to watch.
CryptoQuant, the Seoul-based on-chain analytics firm founded by Ki Young Ju (@ki_young_ju), flagged the setup directly: “Our latest report breaks down the profit-taking signals, cooling demand, and key Bitcoin support levels.” The report is not a bearish call — it is a structured framework for understanding where a pullback would find genuine on-chain demand if current elevated prices trigger sustained distribution.
Signal 1 — Profit-Taking Is Accelerating
The primary on-chain warning is the behavior of short-term holders (STHs) — wallets that have held Bitcoin for fewer than 155 days. This cohort is the most sensitive to price, and during prior cycle peaks they have been the dominant source of sell-side pressure.
CryptoQuant’s Spent Output Profit Ratio (SOPR) for short-term holders measures the average ratio of the sale price to the acquisition price across all coins moved on a given day. When SOPR exceeds 1.0, coins are being sold at a profit. When it spikes significantly above 1.0, it indicates that a large portion of recently acquired supply is being distributed into strength — a classic late-stage or correction-preceding behavior.
CryptoQuant’s report identifies this exact condition as active. The read-across is straightforward: when STH-SOPR reaches elevated levels during an uptrend, it historically precedes either a consolidation phase or a 10%–30% corrective move before trend resumption. In the May 2021 correction, STH-SOPR spiked sharply before Bitcoin declined approximately 53% from its $64,000 high to $29,000. In the January–February 2024 period, a milder STH-SOPR elevation preceded a roughly 21% pullback from $48,000 to $38,000 before the March 2024 breakout to $73,800.
The key distinction in CryptoQuant’s current assessment: the profit-taking is present but not yet at blow-off levels. That nuance matters — it suggests correction risk, not cycle-end risk.
Signal 2 — Demand Metrics Are Cooling
Beyond profit-taking, CryptoQuant’s report highlights a deceleration in apparent demand — the net change in Bitcoin held across all known addresses versus the net issuance from miners. When apparent demand shrinks, it means the rate at which new buyers are absorbing supply is declining even if it has not reversed.
This metric ran strongly positive during Bitcoin’s rally from the $80,000 zone through the Q2 2026 acceleration phase. The current cooling does not represent outright net selling — it represents a demand-supply equilibrium that is less favorable than the conditions that drove the prior leg higher. Historically, demand deceleration without outright reversal has corresponded to 10%–20% consolidation phases rather than structural breakdowns.
For context on why this cycle’s demand picture matters, prior CoinsProbe analysis documented the period when Bitcoin profit-taking hit its 2026 high and $80K emerged as the critical line — a level that ultimately held as structural support during that phase of the cycle.
Signal 3 — Key Support Levels Identified
The third element of CryptoQuant’s report is the most actionable: a breakdown of the specific price levels where on-chain cost-basis clusters — realized price bands — create genuine buy-side support.
CryptoQuant uses realized price segmented by cohort to identify these zones. The realized price of the short-term holder cohort represents the average acquisition cost of coins that have moved in the past 155 days. When Bitcoin’s spot price approaches this level, STHs move from profit to break-even — historically a zone where selling pressure exhausts and accumulation resumes.
Three tiers of support are flagged in the report:
- First support tier — the short-term holder realized price, representing the average cost basis of the most recent buyer cohort. A test of this level would constitute a moderate corrective move and has historically represented a buy zone in ongoing bull markets.
- Second support tier — the 90-day realized price band, a deeper but still cycle-consistent level. A test here would represent a more significant correction but would not alter the macro bull structure if held with volume.
- Macro floor — the long-term holder (LTH) realized price, which represents the aggregate cost basis of wallets holding for 155+ days. In every prior cycle, Bitcoin has not sustained trade below this level during a bull market. A breach of LTH realized price has only occurred during confirmed bear markets — the 2018–2019 drawdown and the 2022 capitulation.
CryptoQuant’s report implicitly frames the current setup as operating between the first and second tiers — a correction scenario, not a macro breakdown scenario, unless conditions deteriorate materially.
What the Data Says — and What It Doesn’t
The CryptoQuant report is explicit about its scope. Profit-taking signals and cooling demand describe the current on-chain state. They do not predict the magnitude of a drawdown with precision, and they do not indicate whether a correction has already begun or is still ahead. The signals are leading indicators of increased pullback risk, not confirmations that a specific price has been reached.
What the data does confirm with certainty: the conditions that produced Bitcoin’s prior strong directional moves — low STH-SOPR, strong apparent demand, and price well above all realized price bands — are currently less favorable than they were at the outset of the 2026 rally leg.
Bullish Scenario
If Bitcoin holds the short-term holder realized price on any pullback and apparent demand stabilizes, the corrective phase is shallow — historically consistent with a 10%–15% drawdown followed by trend resumption. In the analogous 2024 setup, Bitcoin corrected 21% before printing a new all-time high within six weeks.
Bearish Scenario
A sustained break below the short-term holder realized price, accompanied by a continued decline in apparent demand and rising exchange inflows from long-term holders, would escalate the risk profile. The second support tier would then become the critical test. A failure there — with LTH-SOPR turning negative — would represent a structural signal that CryptoQuant’s prior bull market frameworks would no longer apply.
CryptoQuant’s on-chain regime is currently in a profit-taking and demand-cooling phase — a condition that has historically produced corrections of 10%–30% in ongoing bull markets before trend resumption. The STH realized price is the first structural defense. The LTH realized price is the line that separates a bull market correction from something more consequential. Watch both levels closely as price discovers the depth of the current pullback.
Source: x.comFrequently Asked Questions
What is the short-term holder realized price and why does it matter for Bitcoin’s pullback?
Has Bitcoin’s bull market structure been broken by the current profit-taking signals?
What does cooling apparent demand mean for Bitcoin’s price in the near term?
What specific on-chain condition would escalate the pullback from a correction to a structural breakdown?
Source: CryptoQuant · Published by CoinsProbe Markets Desk
The opinions and market insights shared on CoinsProbe represent the views of individual authors based on prevailing market conditions at the time of publication. Cryptocurrency investments carry significant risk and volatility. Readers are encouraged to conduct their own research and seek professional financial advice before making investment decisions. CoinsProbe and its contributors do not accept responsibility for financial losses or decisions made based on published content.
CoinsProbe may publish sponsored articles, affiliate links, or promotional collaborations. All sponsored material is clearly labeled to maintain transparency with our audience. Our editorial decisions remain fully independent, and advertising partnerships do not influence reviews, rankings, or published opinions.
Since 2023, CoinsProbe has delivered reliable insights on cryptocurrency, blockchain, and digital assets. Our content is created by experienced researchers and analysts who follow strict editorial standards focused on accuracy, transparency, and credibility. Every article is carefully reviewed and verified using trusted sources and current market data. We provide unbiased analysis and timely updates covering everything from emerging crypto projects to major industry developments.