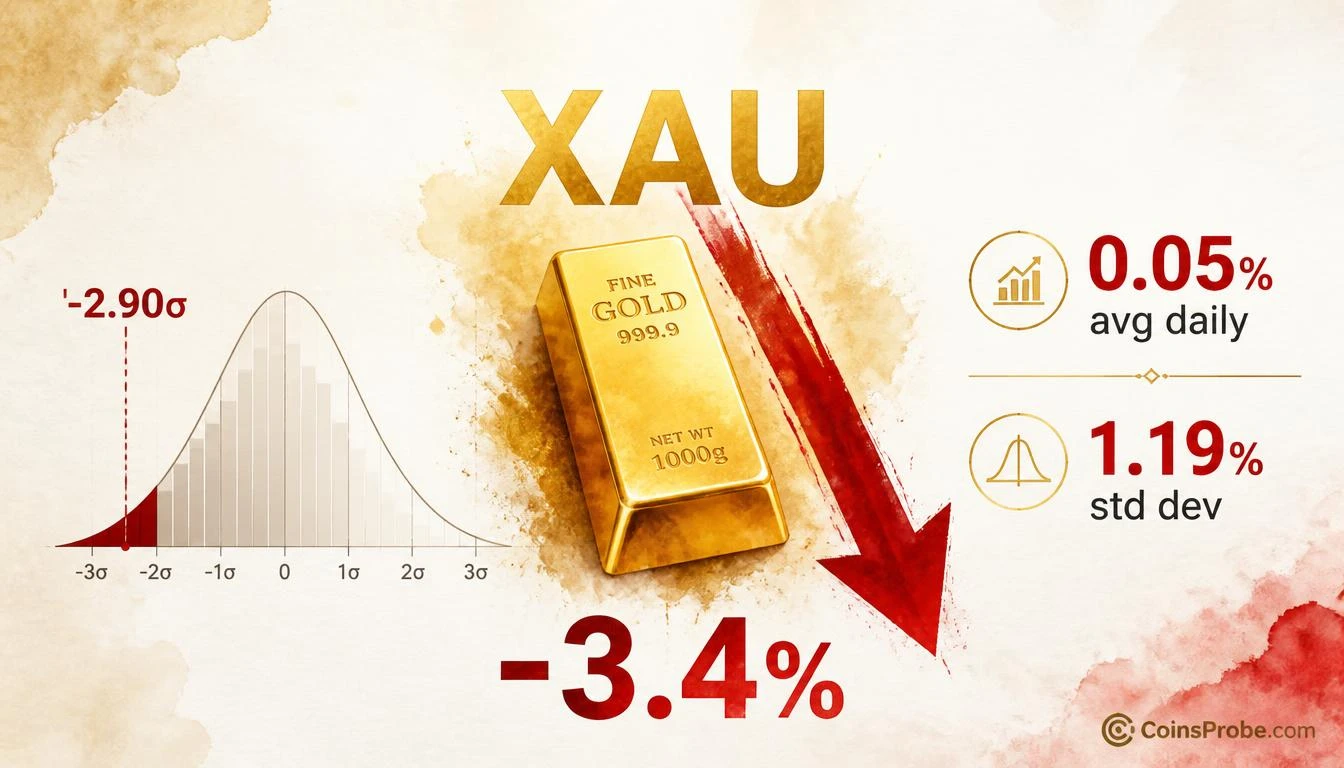
- Gold fell -3.4% on Sept 29, 2026 — one of the largest single-day drops in two decades per The Kobeissi Letter
- The move registered a Z-score of -2.90σ against a 20-year mean of +0.05% and standard deviation of 1.19%
- A -2.90σ daily event occurs on approximately 0.2% of trading days under normal distribution assumptions
Gold recorded a -3.4% single-day decline on September 29, 2026 — one of the rarest price drops in the past twenty years, according to The Kobeissi Letter.
The scale of the move becomes clear against the historical baseline. Since 2006, gold has averaged a daily change of just +0.05%, with a standard deviation of 1.19%. Today’s -3.4% selloff registered a Z-score of -2.90σ — placing it deep into the left tail of the historical distribution. Under normal distribution assumptions, a move this extreme occurs on roughly 0.2% of all trading days.
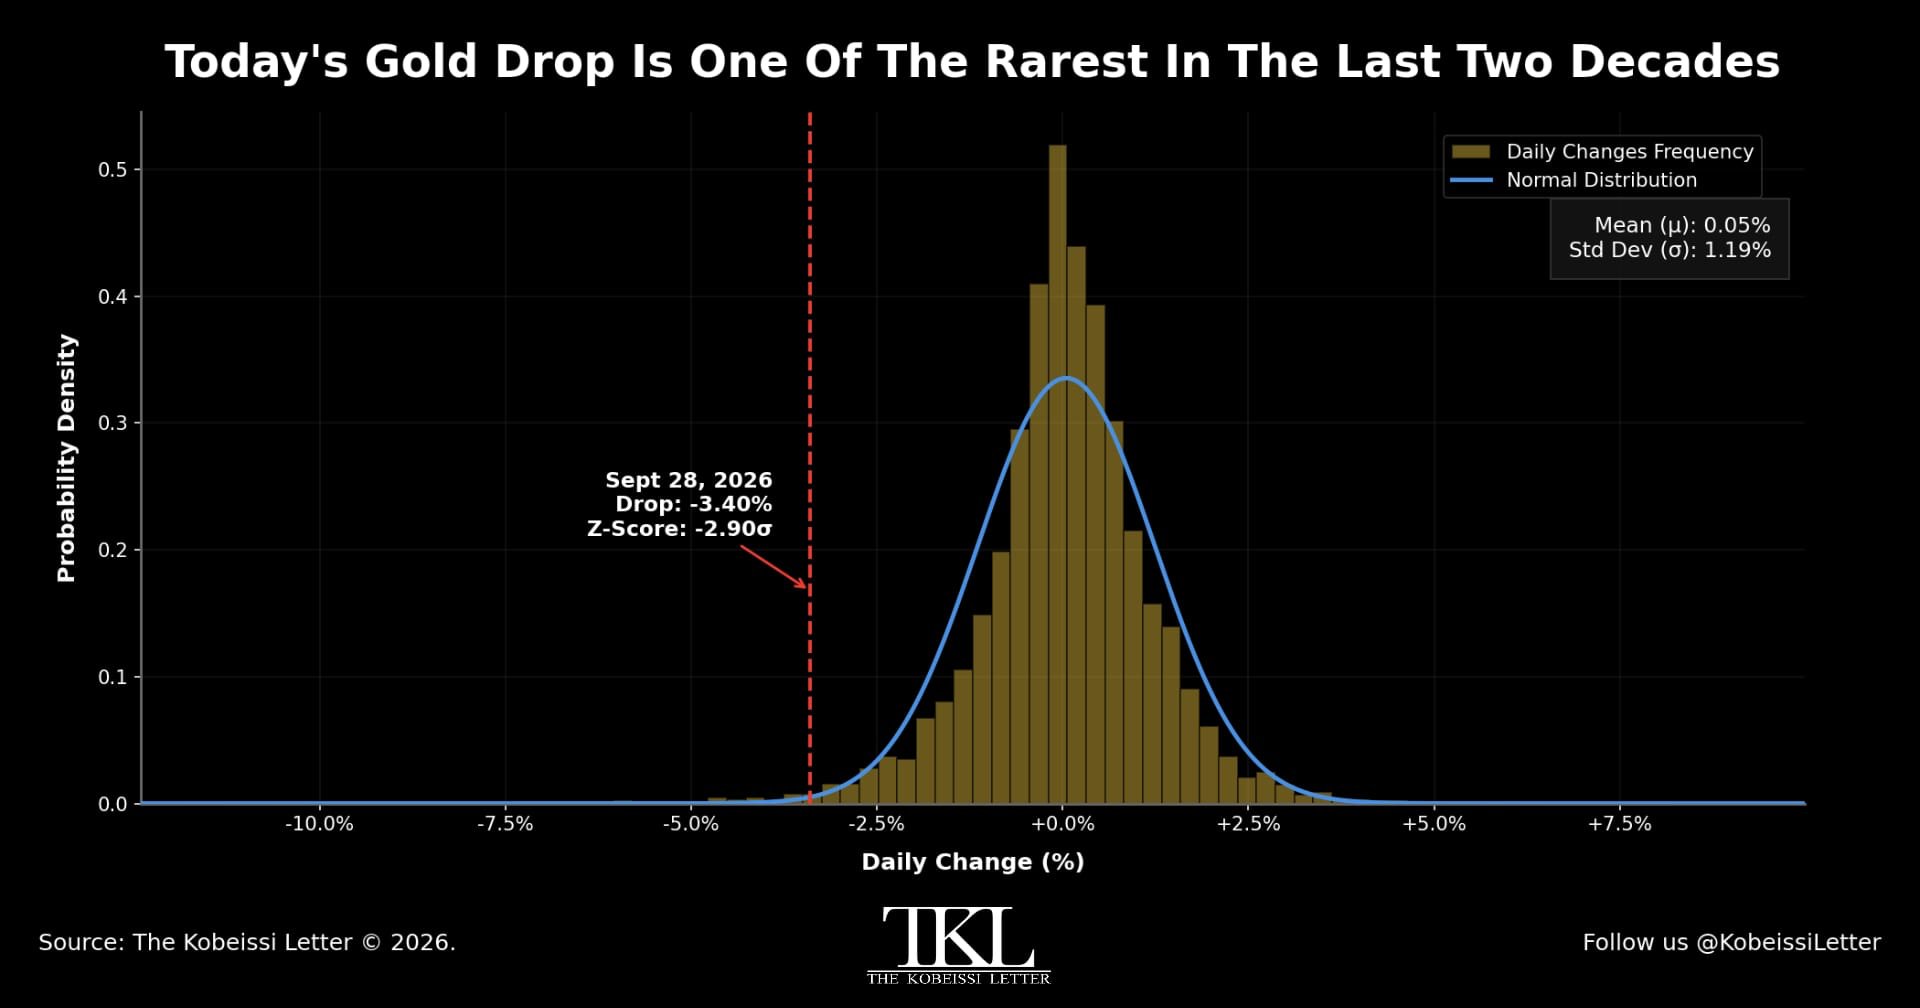
The distribution chart published by The Kobeissi Letter shows gold’s daily return frequency across two decades. The September 29 drop falls well outside the normal range of approximately -2.5% to +2.5%, with the histogram confirming it as a genuine statistical outlier — not a gradual drift to the edge of the bell curve but a hard break into tail territory.
Moves registering at -2.90σ are typically associated with forced or capitulatory selling rather than a measured fundamental repricing. That distinction matters: capitulation-driven moves of this magnitude have historically seen partial mean reversion, though fat-tail behavior in commodities means extreme events can cluster rather than immediately reverse.
The Kobeissi Letter has been tracking institutional capital rotation across macro assets in recent weeks — a period that has also seen aggressive treasury accumulation in digital assets, including SharpLink Gaming staking 42,074 ETH worth $112.8M and Strive purchasing 1,107 Bitcoin for $94 million. Whether today’s gold selloff accelerates that rotation or represents an isolated deleveraging event remains the key open question.
Watch the daily close over the next two sessions — historically, -2.90σ events either begin reverting within 48 hours or extend as forced selling continues to clear the market.
Frequently Asked Questions
How rare is a -2.90σ daily move in gold historically?
Does a -3.4% single-day drop in gold typically signal further downside or a reversal?
What is gold’s average daily return over the past two decades?
Source: Kobeissiletter · Published by CoinsProbe Markets Desk
The opinions and market insights shared on CoinsProbe represent the views of individual authors based on prevailing market conditions at the time of publication. Cryptocurrency investments carry significant risk and volatility. Readers are encouraged to conduct their own research and seek professional financial advice before making investment decisions. CoinsProbe and its contributors do not accept responsibility for financial losses or decisions made based on published content.
CoinsProbe may publish sponsored articles, affiliate links, or promotional collaborations. All sponsored material is clearly labeled to maintain transparency with our audience. Our editorial decisions remain fully independent, and advertising partnerships do not influence reviews, rankings, or published opinions.
Since 2023, CoinsProbe has delivered reliable insights on cryptocurrency, blockchain, and digital assets. Our content is created by experienced researchers and analysts who follow strict editorial standards focused on accuracy, transparency, and credibility. Every article is carefully reviewed and verified using trusted sources and current market data. We provide unbiased analysis and timely updates covering everything from emerging crypto projects to major industry developments.