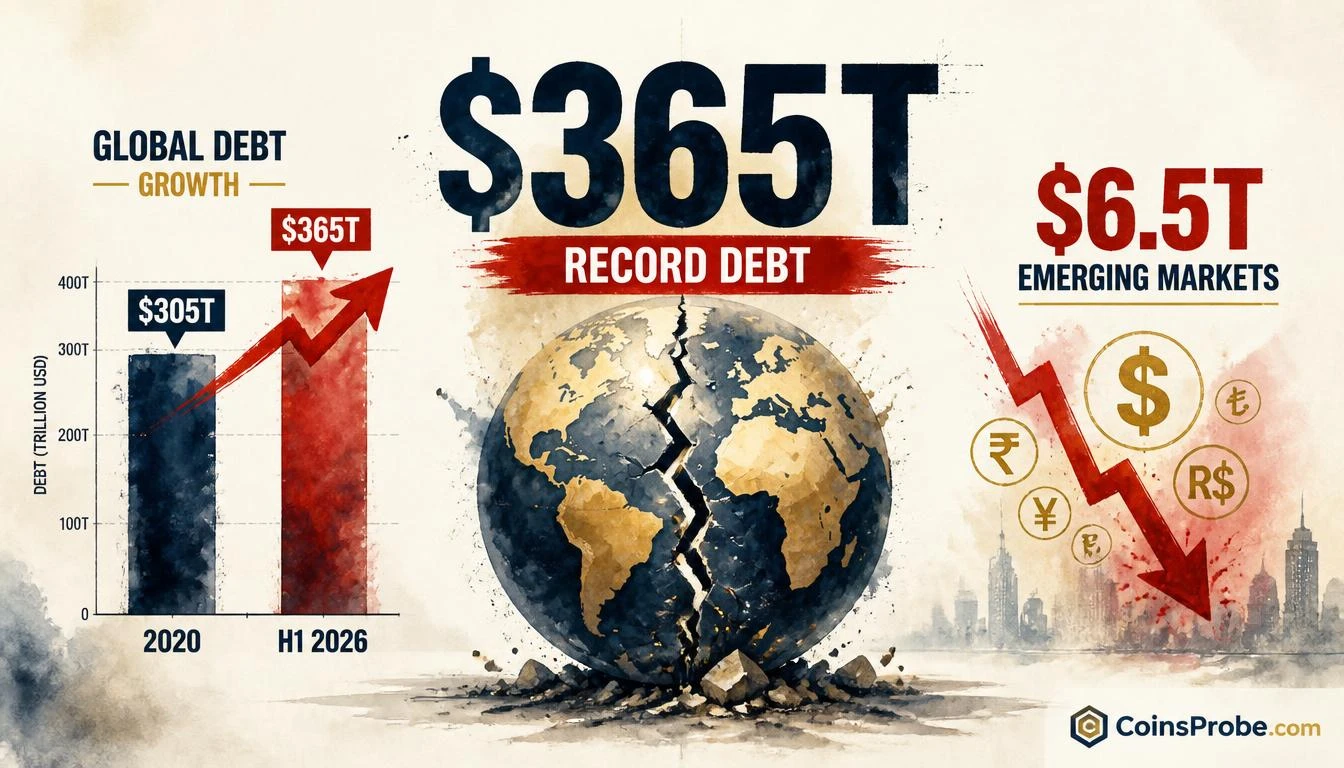

- Global debt hit a record $365 trillion in H1 2026 — a $10T+ increase in a single half-year per The Kobeissi Letter
- Emerging-market debt surged $6.5T to a record $110T, driven by government and non-financial corporate borrowing
- Debt-to-GDP ratio sits at ~311% — 26 percentage points below the 2021 peak — as inflation distorts the denominator
- Bitcoin trades at $84,076 (+0.33%) as debt-debasement hedge narrative gains fresh macro context
Global debt crossed a new all-time high of $365 trillion in the first half of 2026 — a single-half-year increase of more than $10 trillion, according to data shared by The Kobeissi Letter.
Emerging-market debt was the primary driver, surging $6.5 trillion to a record $110 trillion. Governments and non-financial corporations accounted for the bulk of that increase — a pattern that historically signals sovereign stress and currency pressure across developing economies. Our earlier coverage of emerging market debt hitting 78% of GDP — its highest level since 1880 — provides direct context for this acceleration.
What the Chart Confirms — and What It Obscures
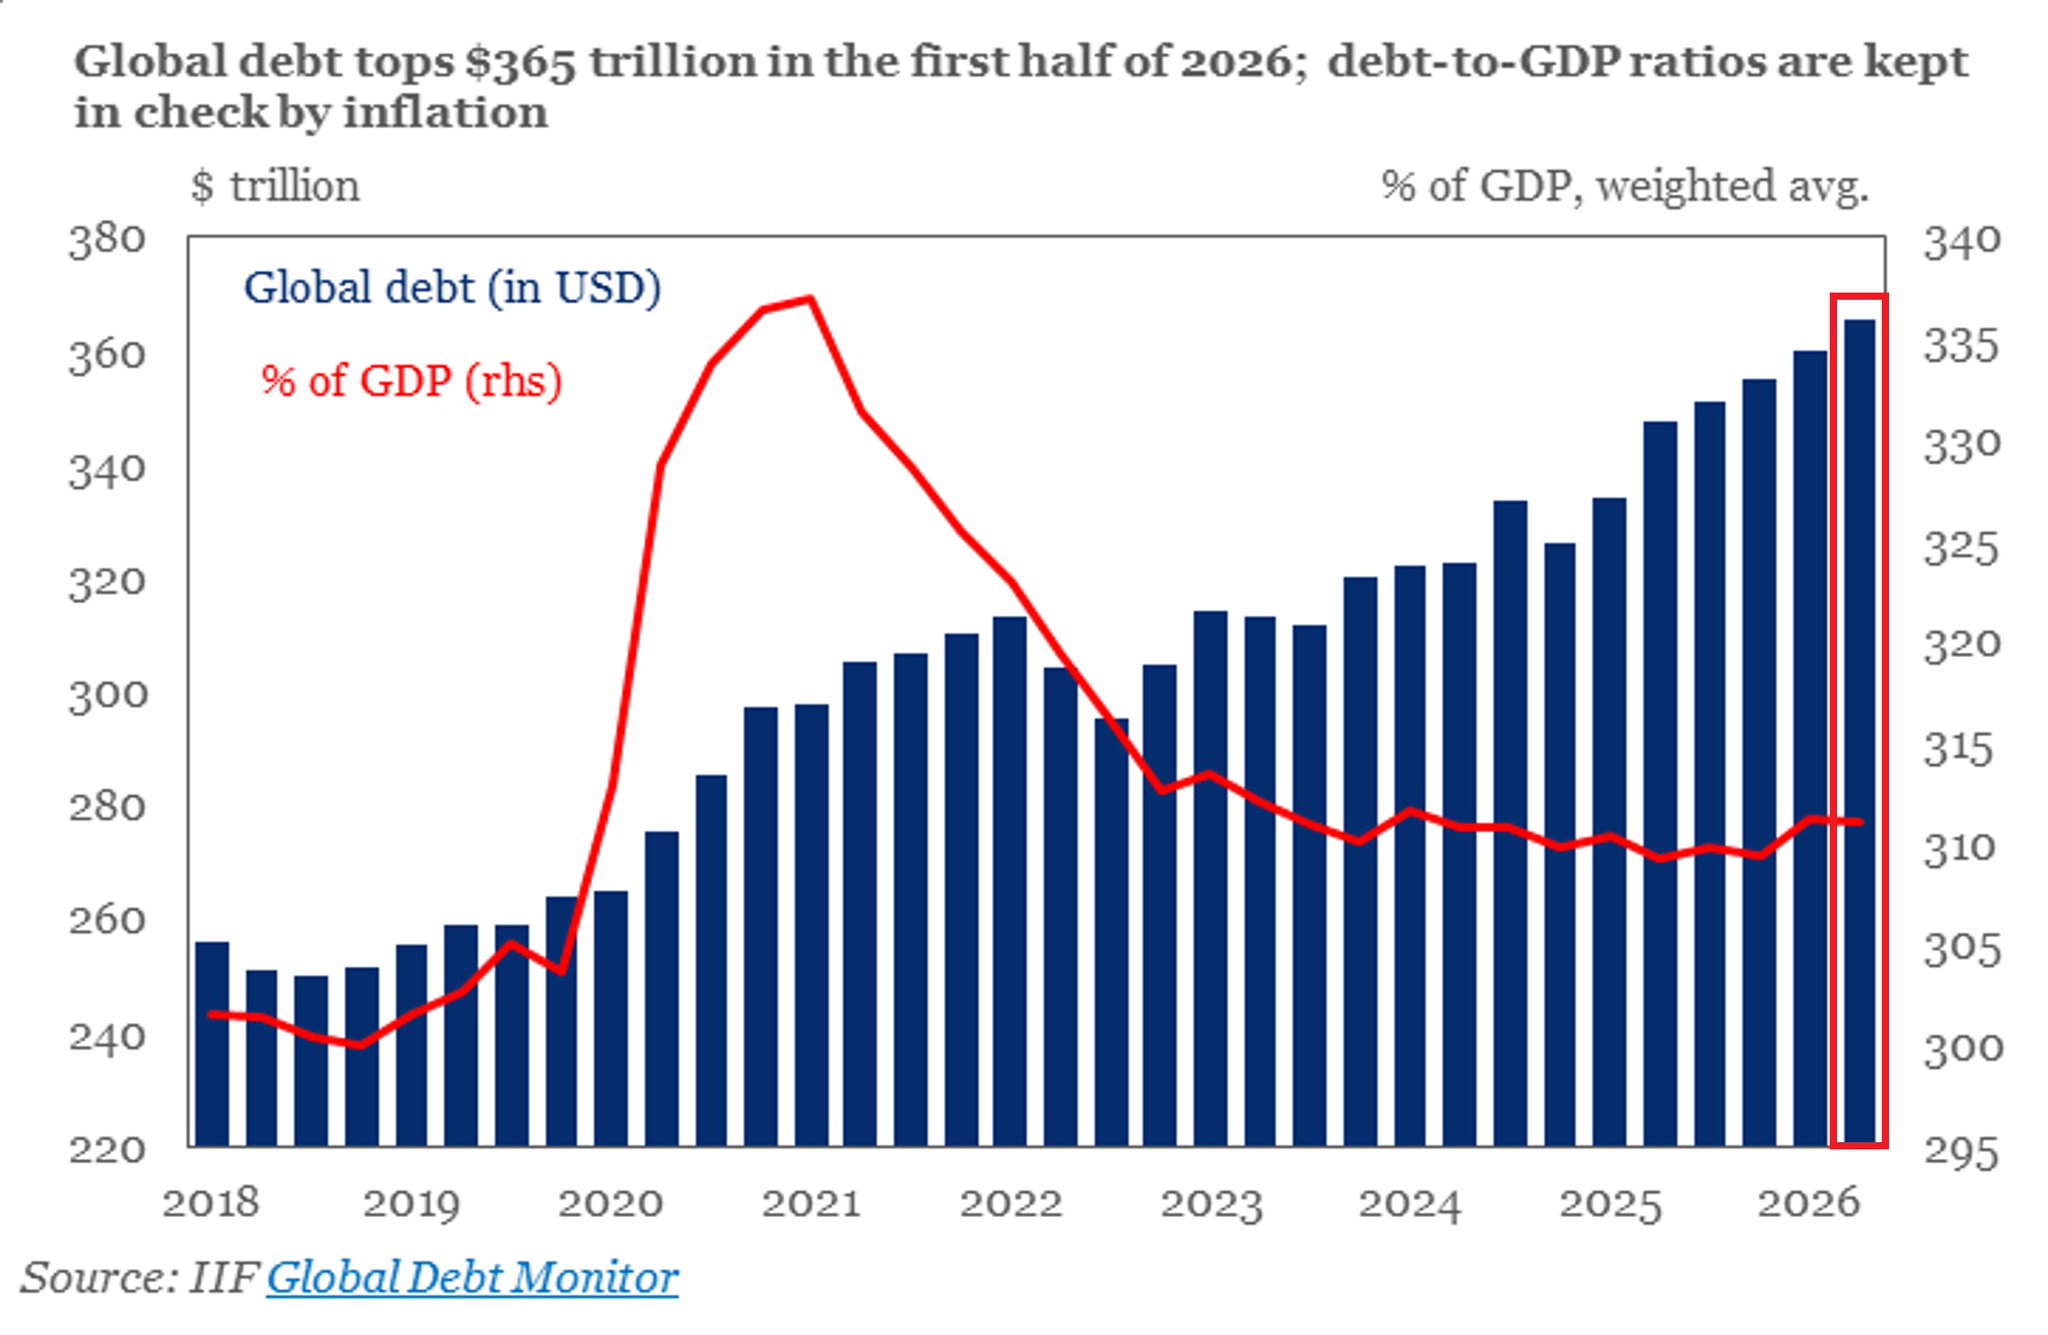
The IIF data charted by The Kobeissi Letter covers quarterly global aggregate debt from 2018 through H1 2026, with a debt-to-GDP ratio overlay. The chart reveals a critical divergence: nominal debt is at an all-time high of $365 trillion, yet the debt-to-GDP ratio sits at approximately 311% of GDP — roughly 26 percentage points below its 2021 peak of ~337%.
That gap is not organic deleveraging. It reflects inflation mathematically expanding the GDP denominator while nominal debt continues to compound. In real purchasing-power terms, the global debt burden has not shrunk — it has been partially obscured by price-level expansion.
The $10 trillion single-half-year jump is the steepest nominal increase visible on the chart. For context, total global debt stood at approximately $305 trillion before the COVID-era spending surge in 2020.
Macro Implications
The composition of the increase matters as much as the size. Emerging-market government and corporate debt expanding at this pace creates acute vulnerability to any tightening of global financing conditions. Dollar strength, rising US Treasury yields, or a risk-off episode could rapidly expose overleveraged sovereign and corporate balance sheets across EM economies.
At the time of writing, Bitcoin is trading at approximately $84,076 (+0.33% in the past 24 hours). Historically, episodes of extreme global liquidity expansion — debt-financed fiscal spending at scale — have supported Bitcoin as a debt-debasement hedge. Whether this cycle follows that pattern depends on whether the debt expansion is accompanied by continued monetary accommodation or eventually forces a tightening response.
Watch emerging-market currency indices and EM sovereign credit spreads as the immediate stress indicators. If the $6.5 trillion EM debt surge is accompanied by widening spreads rather than contained borrowing costs, the macro risk-off scenario accelerates faster than the nominal figures alone suggest.
Source: x.comFrequently Asked Questions
What is driving the $10 trillion global debt increase in H1 2026?
Why is the debt-to-GDP ratio falling even as nominal debt hits record highs?
How does a $365 trillion global debt record affect Bitcoin?
What is the key risk for emerging markets from this debt surge?
Source: Kobeissiletter · Published by CoinsProbe Markets Desk
The opinions and market insights shared on CoinsProbe represent the views of individual authors based on prevailing market conditions at the time of publication. Cryptocurrency investments carry significant risk and volatility. Readers are encouraged to conduct their own research and seek professional financial advice before making investment decisions. CoinsProbe and its contributors do not accept responsibility for financial losses or decisions made based on published content.
CoinsProbe may publish sponsored articles, affiliate links, or promotional collaborations. All sponsored material is clearly labeled to maintain transparency with our audience. Our editorial decisions remain fully independent, and advertising partnerships do not influence reviews, rankings, or published opinions.
Since 2023, CoinsProbe has delivered reliable insights on cryptocurrency, blockchain, and digital assets. Our content is created by experienced researchers and analysts who follow strict editorial standards focused on accuracy, transparency, and credibility. Every article is carefully reviewed and verified using trusted sources and current market data. We provide unbiased analysis and timely updates covering everything from emerging crypto projects to major industry developments.