
- Bitcoin trades at $84,488 (-2.02% 24h) as CryptoQuant flags demand recovering from a June 2026 low of -500,000 BTC
- Futures demand has already flipped positive — spot demand remains negative but is visibly contracting toward zero per @CW8900
- Spot demand crossing zero is the confirmed signal; failure to hold $75,000 support reopens the path to $57,000–$58,000
Bitcoin is trading at approximately $84,488 — down 2.02% in the past 24 hours — with a market capitalization of $1.69 trillion. Beneath the surface, a structural shift is underway: Bitcoin’s demand metric, which collapsed to its deepest negative reading of 2026, is now recovering, and the sequencing of that recovery carries a historically significant implication.
CryptoQuant analyst @CW8900 published the call on September 24, 2026, writing: “The trend is shifting toward the positive. If the current momentum persists, spot demand will also flip to positive.” This is not a price prediction — it is a demand-side structural observation, and the distinction matters enormously for how traders should interpret the current consolidation between $75,000 and $90,000.
What Bitcoin Demand Actually Measures
Before interpreting the reading, the mechanic matters. CryptoQuant’s demand metric tracks the 30-day rolling net change in BTC quantity across both spot and perpetual futures markets. A negative reading means more Bitcoin is flowing out of demand channels than into them — sellers and indifferent holders are outpacing new buyers. A positive reading reversal, by contrast, signals net accumulation is dominant. The metric is measured in BTC quantity, not dollar value, which makes it immune to price-inflation distortion.
Crucially, the metric splits demand into two sub-components: spot demand (gray line) and futures demand (blue line). These move at different speeds. Futures demand responds faster — it reflects leveraged positioning, which can shift within days. Spot demand is slower — it reflects genuine buy-and-hold conviction from wallets that take physical BTC delivery.
The June 2026 Capitulation and the Recovery That Followed
The CryptoQuant chart covering January through September 2026 shows the full arc of this cycle’s demand destruction and subsequent recovery. In June 2026, both spot and futures demand plunged to approximately -500,000 BTC on a 30-day rolling basis — the deepest negative reading of the year, coinciding with Bitcoin’s capitulation to the $57,000–$58,000 range. That was the structural low.
Since that June floor, two things have happened simultaneously. Bitcoin’s price recovered from approximately $57,000 to $84,488 — a +47% move. And the demand bars began compressing back toward zero. The futures demand component has already crossed the threshold: it has flipped positive in recent weeks. Spot demand remains negative but is visibly contracting toward zero at an accelerating pace.
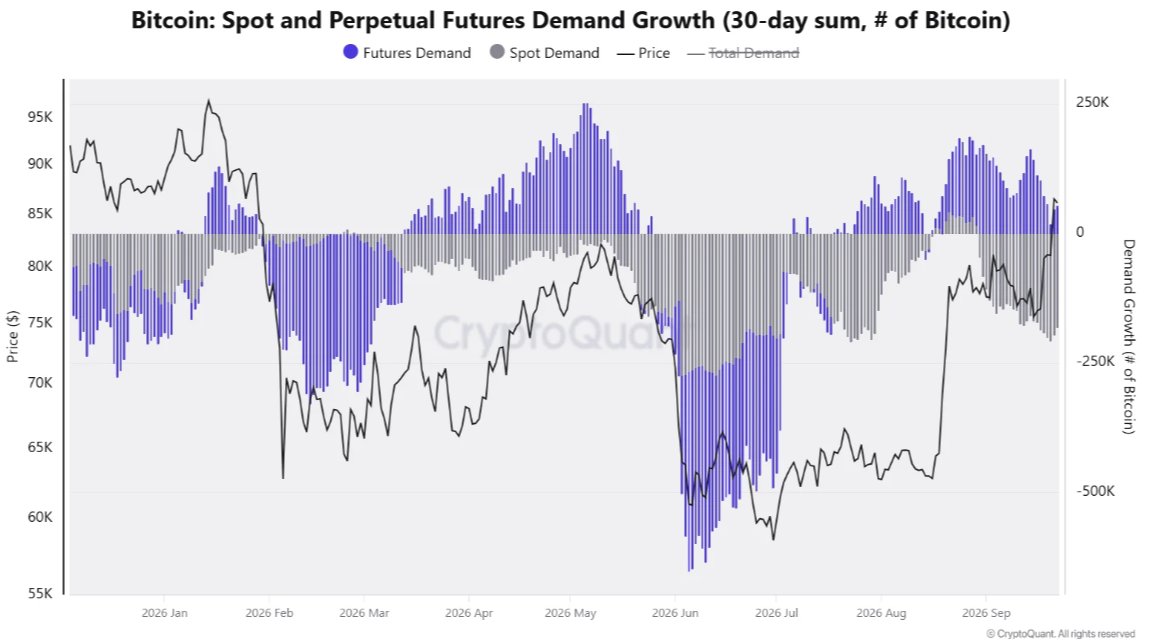
This sequencing — futures leading, spot following — is the key structural observation. Futures leading spot is not a red flag. It is the historically consistent order of operations in Bitcoin demand recoveries. Leveraged participants position first; spot conviction buyers confirm later. The current setup has futures already confirmed and spot approaching the line.
Why the Spot Demand Flip Is the Only Number That Matters Now
Futures demand flipping positive is encouraging but not sufficient on its own. Futures positions can unwind rapidly — they do not represent the same structural weight as spot accumulation. The confirmation that matters, per @CW8900’s analysis, is spot demand crossing from negative to positive.
When spot demand turns positive, it means on-chain wallets are taking more BTC off exchanges than they are depositing. Supply tightens. The market is no longer absorbing seller pressure — it is beginning to generate its own scarcity. That is the regime change that has historically preceded sustained price appreciation, not just relief bounces.
The current consolidation between $75,000 and $95,000 should be read in this context. Bitcoin is not in free fall. It is consolidating at a level consistent with a demand recovery in progress — but not yet complete. The $82,500 double bottom neckline that has been flagged by technical analysts aligns closely with CryptoQuant’s on-chain support zone of $75,000–$80,000, which is where demand recovery would need to hold to remain valid.
It is also worth noting that stablecoin inflows to exchanges have recently hit $6 billion — a separate on-chain signal that dry powder is accumulating on the sidelines. Stablecoin inflows precede spot buying. Combined with the futures demand flip already confirmed, the setup is pointing in one direction — but confirmation via spot demand remains outstanding.
What the Chart Confirms — And What It Doesn’t
The CryptoQuant visualization confirms three things with certainty: the demand bottom was June 2026 at approximately -500,000 BTC; the recovery is underway with futures already positive; and spot demand is approaching zero but has not crossed. What the chart does not confirm is the timing of the spot flip, the magnitude of the subsequent move, or whether a retest of $75,000 support will occur before spot turns positive.
The current leverage flush across major assets adds a specific near-term risk: overleveraged futures positions being liquidated can temporarily suppress the demand reading before the underlying accumulation reasserts itself. This is the mechanism that would explain a dip toward $75,000–$80,000 support before the spot flip materializes.
Bullish Scenario
Spot demand crosses from negative to positive on CryptoQuant’s 30-day rolling metric while Bitcoin holds above $80,000. This would confirm the full demand recovery sequence — futures led, spot followed — and historically that regime shift has preceded multi-month appreciation phases. The next resistance cluster sits at $90,000–$95,000, representing the recent highs from earlier in 2026.
Bearish Scenario
Spot demand fails to recover and reverses downward from current levels, re-approaching the -500,000 BTC floor. A failure at this juncture — particularly if Bitcoin loses $75,000 on a weekly close — would suggest the June capitulation was not a genuine demand bottom but a temporary stabilization. That scenario reopens the path to the $57,000–$58,000 range tested in June 2026.
The Verdict
Bitcoin’s demand metric is executing the textbook post-capitulation recovery sequence: a June 2026 floor at -500,000 BTC, a futures demand flip already confirmed, and spot demand trending toward zero. CryptoQuant analyst @CW8900 identified the inflection point directly: the trend is shifting, and if momentum holds, spot demand flips positive. That spot flip is the single most important on-chain development Bitcoin needs right now — more important than any price level, pattern, or leverage metric. At $84,488 with price holding above the $75,000–$80,000 on-chain support band, the setup is in the late stages of base-building. Watch spot demand on CryptoQuant’s 30-day rolling BTC quantity chart — a confirmed positive cross is the signal that separates recovery from regime change.
Frequently Asked Questions
What does a spot demand flip to positive mean for Bitcoin’s price?
Why is futures demand flipping positive before spot demand significant?
What price level would invalidate Bitcoin’s current demand recovery?
Where can I track Bitcoin’s spot demand in real time?
Source: CryptoQuant · Published by CoinsProbe Markets Desk
The opinions and market insights shared on CoinsProbe represent the views of individual authors based on prevailing market conditions at the time of publication. Cryptocurrency investments carry significant risk and volatility. Readers are encouraged to conduct their own research and seek professional financial advice before making investment decisions. CoinsProbe and its contributors do not accept responsibility for financial losses or decisions made based on published content.
CoinsProbe may publish sponsored articles, affiliate links, or promotional collaborations. All sponsored material is clearly labeled to maintain transparency with our audience. Our editorial decisions remain fully independent, and advertising partnerships do not influence reviews, rankings, or published opinions.
Since 2023, CoinsProbe has delivered reliable insights on cryptocurrency, blockchain, and digital assets. Our content is created by experienced researchers and analysts who follow strict editorial standards focused on accuracy, transparency, and credibility. Every article is carefully reviewed and verified using trusted sources and current market data. We provide unbiased analysis and timely updates covering everything from emerging crypto projects to major industry developments.