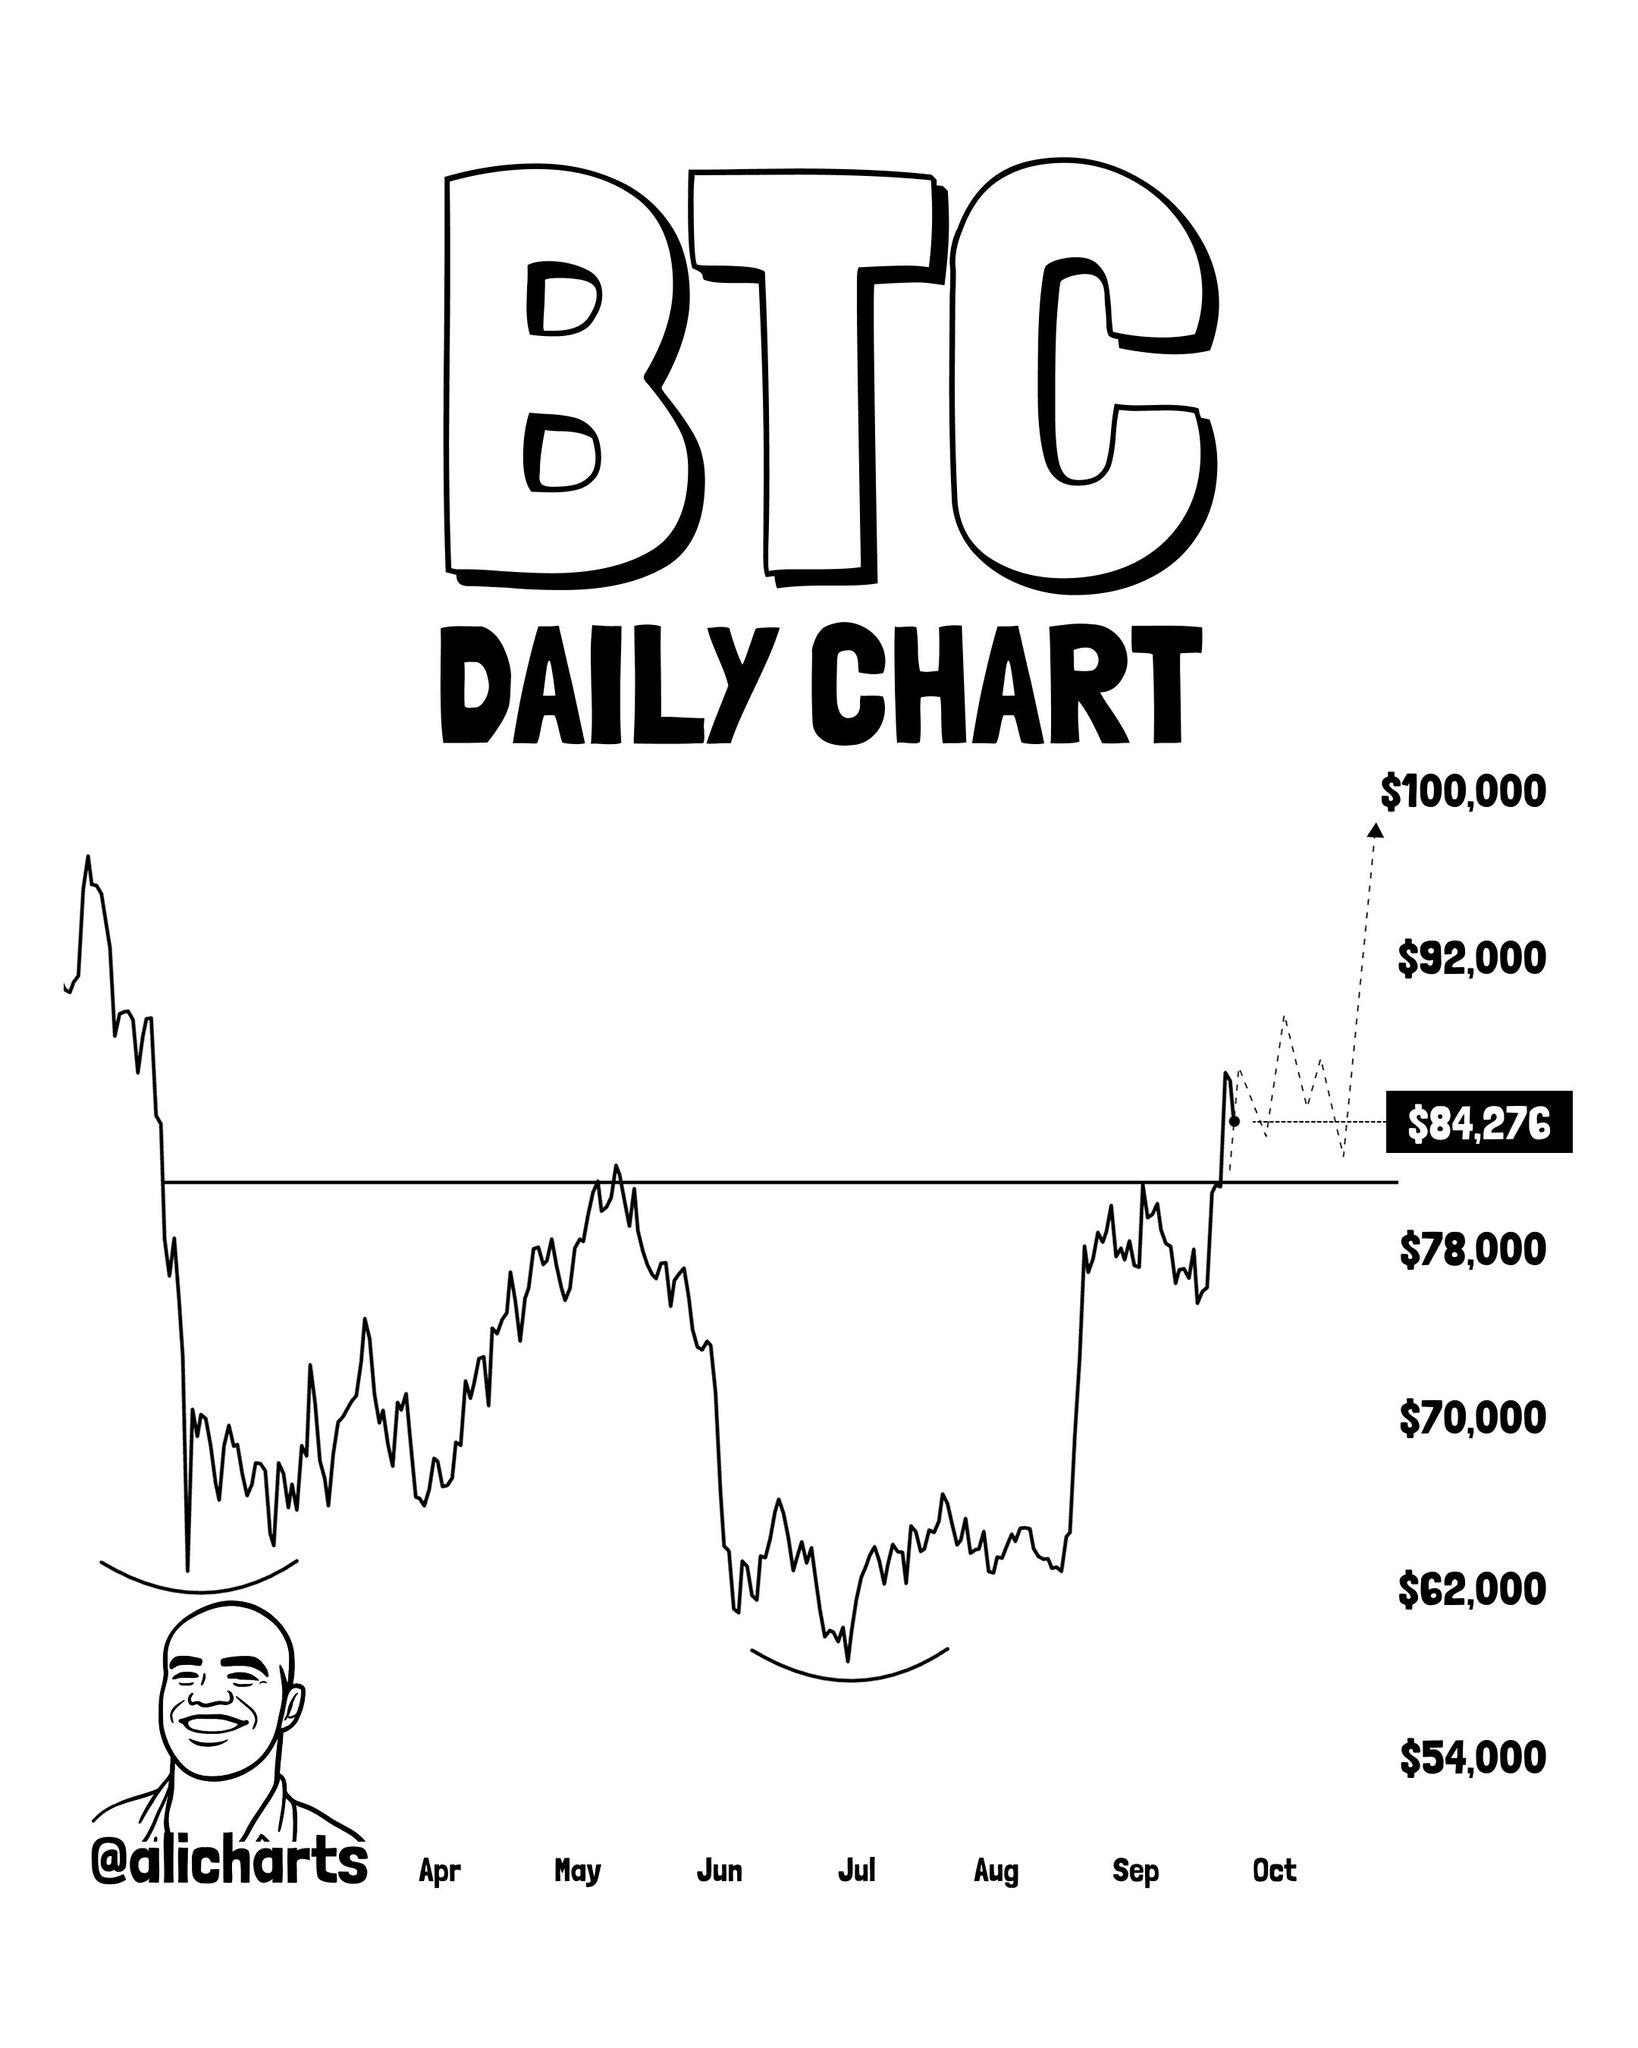
- Bitcoin trades at $84,103 — down 2.65% — consolidating just above the $82,500 double bottom neckline per @alicharts
- Double bottom trough formed near $62,000 twice; ~$20,000 pattern depth projects a measured move to $100,000
- $82,500 is the sole invalidation level — a daily close below negates the entire pattern and opens $74,000–$76,000
- 24-hour volume at $41.8B confirms active participation during the neckline retest, a structural positive
Bitcoin is trading at $84,103 — down 2.65% over the last 24 hours — with a market cap of approximately $1.69 trillion. The pullback is not negating the dominant chart structure. It is testing it.
Analyst Ali Martinez (@alicharts) has flagged a textbook double bottom formation on Bitcoin’s daily chart, with a clear structural conclusion: “Bitcoin $BTC double bottom suggests the $82,500 neckline will hold as support. The target remains $100,000.” That is not a speculative thesis — it is a pattern-based measured move with a defined invalidation level and a specific price target.
The Double Bottom — What the Pattern Actually Measures
A double bottom is a two-trough reversal pattern that forms when price tests the same demand zone twice, fails to break below it, and then surges through a horizontal resistance level — the neckline — converting that level into support. It is among the most reliable bullish reversal structures in classical technical analysis because it requires two consecutive failures by sellers to push price lower.
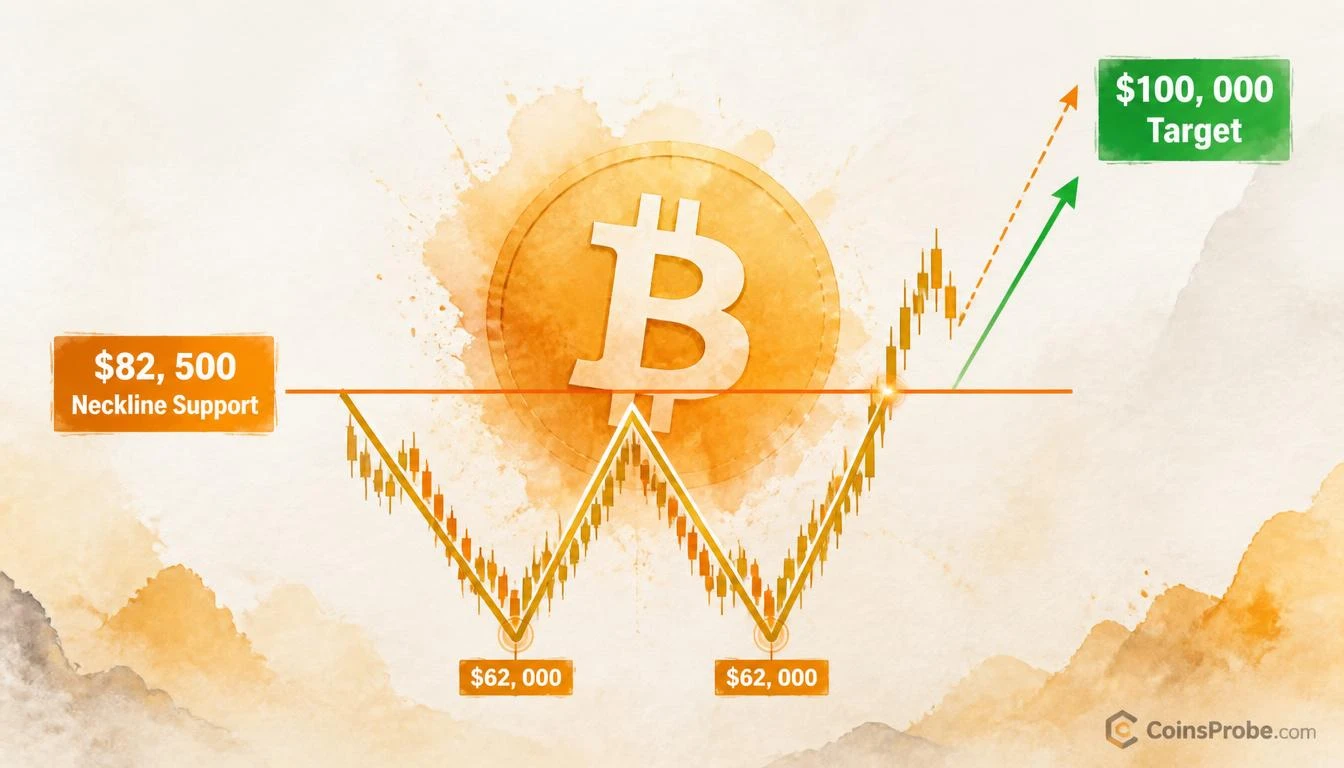
On Bitcoin’s daily chart, the two troughs formed near $62,000 — once in approximately May/June and a second time in July — creating the classic “W” shape. Price subsequently broke above the neckline at ~$82,500, which now functions as support. Bitcoin is currently consolidating just above that level at $84,103, representing a ~$1,600 cushion above the critical line.
Ali Martinez shared the daily chart marking the $62,000 trough zone, the $82,500 neckline, and the $100,000 projected target via a dashed measured-move arrow. The pattern depth — from the $62,000 trough to the $82,500 neckline — is approximately $20,000. Added to the neckline breakout, that projects directly to $100,000.
Why $82,500 Is the Only Number That Matters Right Now
In any double bottom analysis, the neckline flip is the structural event. The breakout above $82,500 was the signal. The retest of $82,500 from above is the confirmation. Bitcoin is currently in that retest window — which is why the current 2.65% pullback is structurally constructive rather than alarming.
The measured move arithmetic is straightforward:
| Level | Role | Price |
|---|---|---|
| Double Bottom Trough | Pattern base | ~$62,000 |
| Neckline | Breakout / support | ~$82,500 |
| Pattern Depth | Measured move input | ~$20,000 |
| Projected Target | Neckline + depth | $100,000 |
Source: @alicharts (X)
The $100,000 level is not arbitrary. It is the mathematically derived measured move from the pattern structure — the same methodology used by institutional desks to set price objectives on classical formations. This also aligns with the psychological round-number significance Bitcoin has tested and retested repeatedly, making it both a technical and sentiment-driven target simultaneously.
Recent on-chain data adds structural context here: Bitcoin stablecoin inflows have hit $6 billion, suggesting capital is positioned nearby and waiting for directional conviction — precisely the kind of fuel a double bottom retest resolution requires.
The Current Consolidation — Retest or Breakdown?
Bitcoin at $84,103 is sitting 1.94% above the $82,500 neckline. The current price action reflects consolidation following the breakout — a standard behavior as the market determines whether the neckline will absorb selling pressure or surrender to it.
Two conditions define the next directional phase:
- Hold above $82,500 on a daily closing basis → pattern validated, bull thesis intact, $100,000 remains the objective
- Daily close decisively below $82,500 → double bottom negated, pattern-based thesis invalidated, price discovers new demand lower
It is worth noting that the recent leverage flush across crypto markets has already contributed to the current pullback — as covered in our earlier analysis, leverage has been clearing across major assets. Paradoxically, that deleveraging reduces the overhang of forced selling, making a clean support hold at $82,500 more probable than it would be in a highly leveraged environment.
Bullish Scenario — $82,500 Holds
A daily close at or above $82,500 with subsequent momentum confirms the neckline-as-support thesis. The next intermediate resistance levels between current price and target are $88,000–$90,000 (prior range highs) and $95,000. The measured move target of $100,000 becomes the primary objective on any sustained move through $90,000.
Bearish Scenario — Loss of $82,500
A convincing daily close below $82,500 — not an intraday wick but a sustained candle close — negates the entire double bottom structure. Without pattern support, Bitcoin would face open air down to the next identifiable demand zone near the $74,000–$76,000 region, representing a potential ~12% decline from current levels. This scenario would force a reassessment of the macro structure entirely.
Broader Market Context
The double bottom did not form in isolation. It emerged against a broader backdrop of market cycle uncertainty — a question that remains genuinely open. As we examined separately, whether crypto is in a disbelief phase has direct implications for how a pattern like this gets resolved: disbelief phases are precisely when technically valid structures get ignored until they suddenly aren’t.
Bitcoin’s 24-hour volume stands at $41.8 billion — above typical consolidation readings — suggesting the current price compression near $82,500 is being watched and traded actively, not ignored. High volume during a retest of support is a confirmatory signal, not a warning sign.
The double bottom on Bitcoin’s daily chart is structurally intact. The neckline at $82,500 has been broken upward and is now being tested as support — the exact sequence the pattern requires for full confirmation. Ali Martinez’s measured move to $100,000 is derived directly from the ~$20,000 pattern depth, not from sentiment or projection bias. Bitcoin is trading at $84,103, approximately $1,603 above the line that determines whether this pattern succeeds or fails. The resolution will not be ambiguous: a daily close above $82,500 keeps the $100,000 target live; a sustained close below it ends the thesis. Watch $82,500 as the singular defining level in the sessions ahead.
Frequently Asked Questions
What is the $82,500 neckline and why does it matter for Bitcoin?
How is the $100,000 Bitcoin price target calculated from the double bottom?
Is Bitcoin’s current pullback to $84,103 invalidating the double bottom pattern?
What would happen to Bitcoin’s price if the $82,500 level fails as support?
Source: Ali Charts · Published by CoinsProbe Markets Desk
The opinions and market insights shared on CoinsProbe represent the views of individual authors based on prevailing market conditions at the time of publication. Cryptocurrency investments carry significant risk and volatility. Readers are encouraged to conduct their own research and seek professional financial advice before making investment decisions. CoinsProbe and its contributors do not accept responsibility for financial losses or decisions made based on published content.
CoinsProbe may publish sponsored articles, affiliate links, or promotional collaborations. All sponsored material is clearly labeled to maintain transparency with our audience. Our editorial decisions remain fully independent, and advertising partnerships do not influence reviews, rankings, or published opinions.
Since 2023, CoinsProbe has delivered reliable insights on cryptocurrency, blockchain, and digital assets. Our content is created by experienced researchers and analysts who follow strict editorial standards focused on accuracy, transparency, and credibility. Every article is carefully reviewed and verified using trusted sources and current market data. We provide unbiased analysis and timely updates covering everything from emerging crypto projects to major industry developments.