
- ETH is trading at $2,659.35 — up 3.36% in 24 hours — after confirming a breakout-and-retest above $2,560
- Analyst Ali Martinez (@alicharts) flags $2,760 as the next major target — 3.8% above current price
- $2,560 is the critical support level — a sustained 4H close below invalidates the bullish structure
- 24-hour trading volume of $14.07 billion supports the validity of the breakout hold
Ethereum is trading at $2,659.35 — up 3.36% in the last 24 hours — with a market cap of $324.6 billion. The move is not noise. ETH has completed a textbook breakout-and-retest sequence above $2,560, a structure that technical analysts classify as one of the most reliable continuation signals in price action.
That structure is flagged by crypto analyst Ali Martinez (@alicharts), who states directly: “ETH broke above $2,560, successfully retested it as support, and is now pushing higher. With the breakout holding, I’m watching $2,760 as the next major target.”
The declaration is not speculative — it is a technically validated conclusion grounded in a confirmed support flip at a key prior resistance level.
The 4-Hour Chart — What the Structure Actually Shows
The 4-hour ETH/USD chart shared by @alicharts covers late August through September 21, 2026, and reveals a clean three-phase sequence:
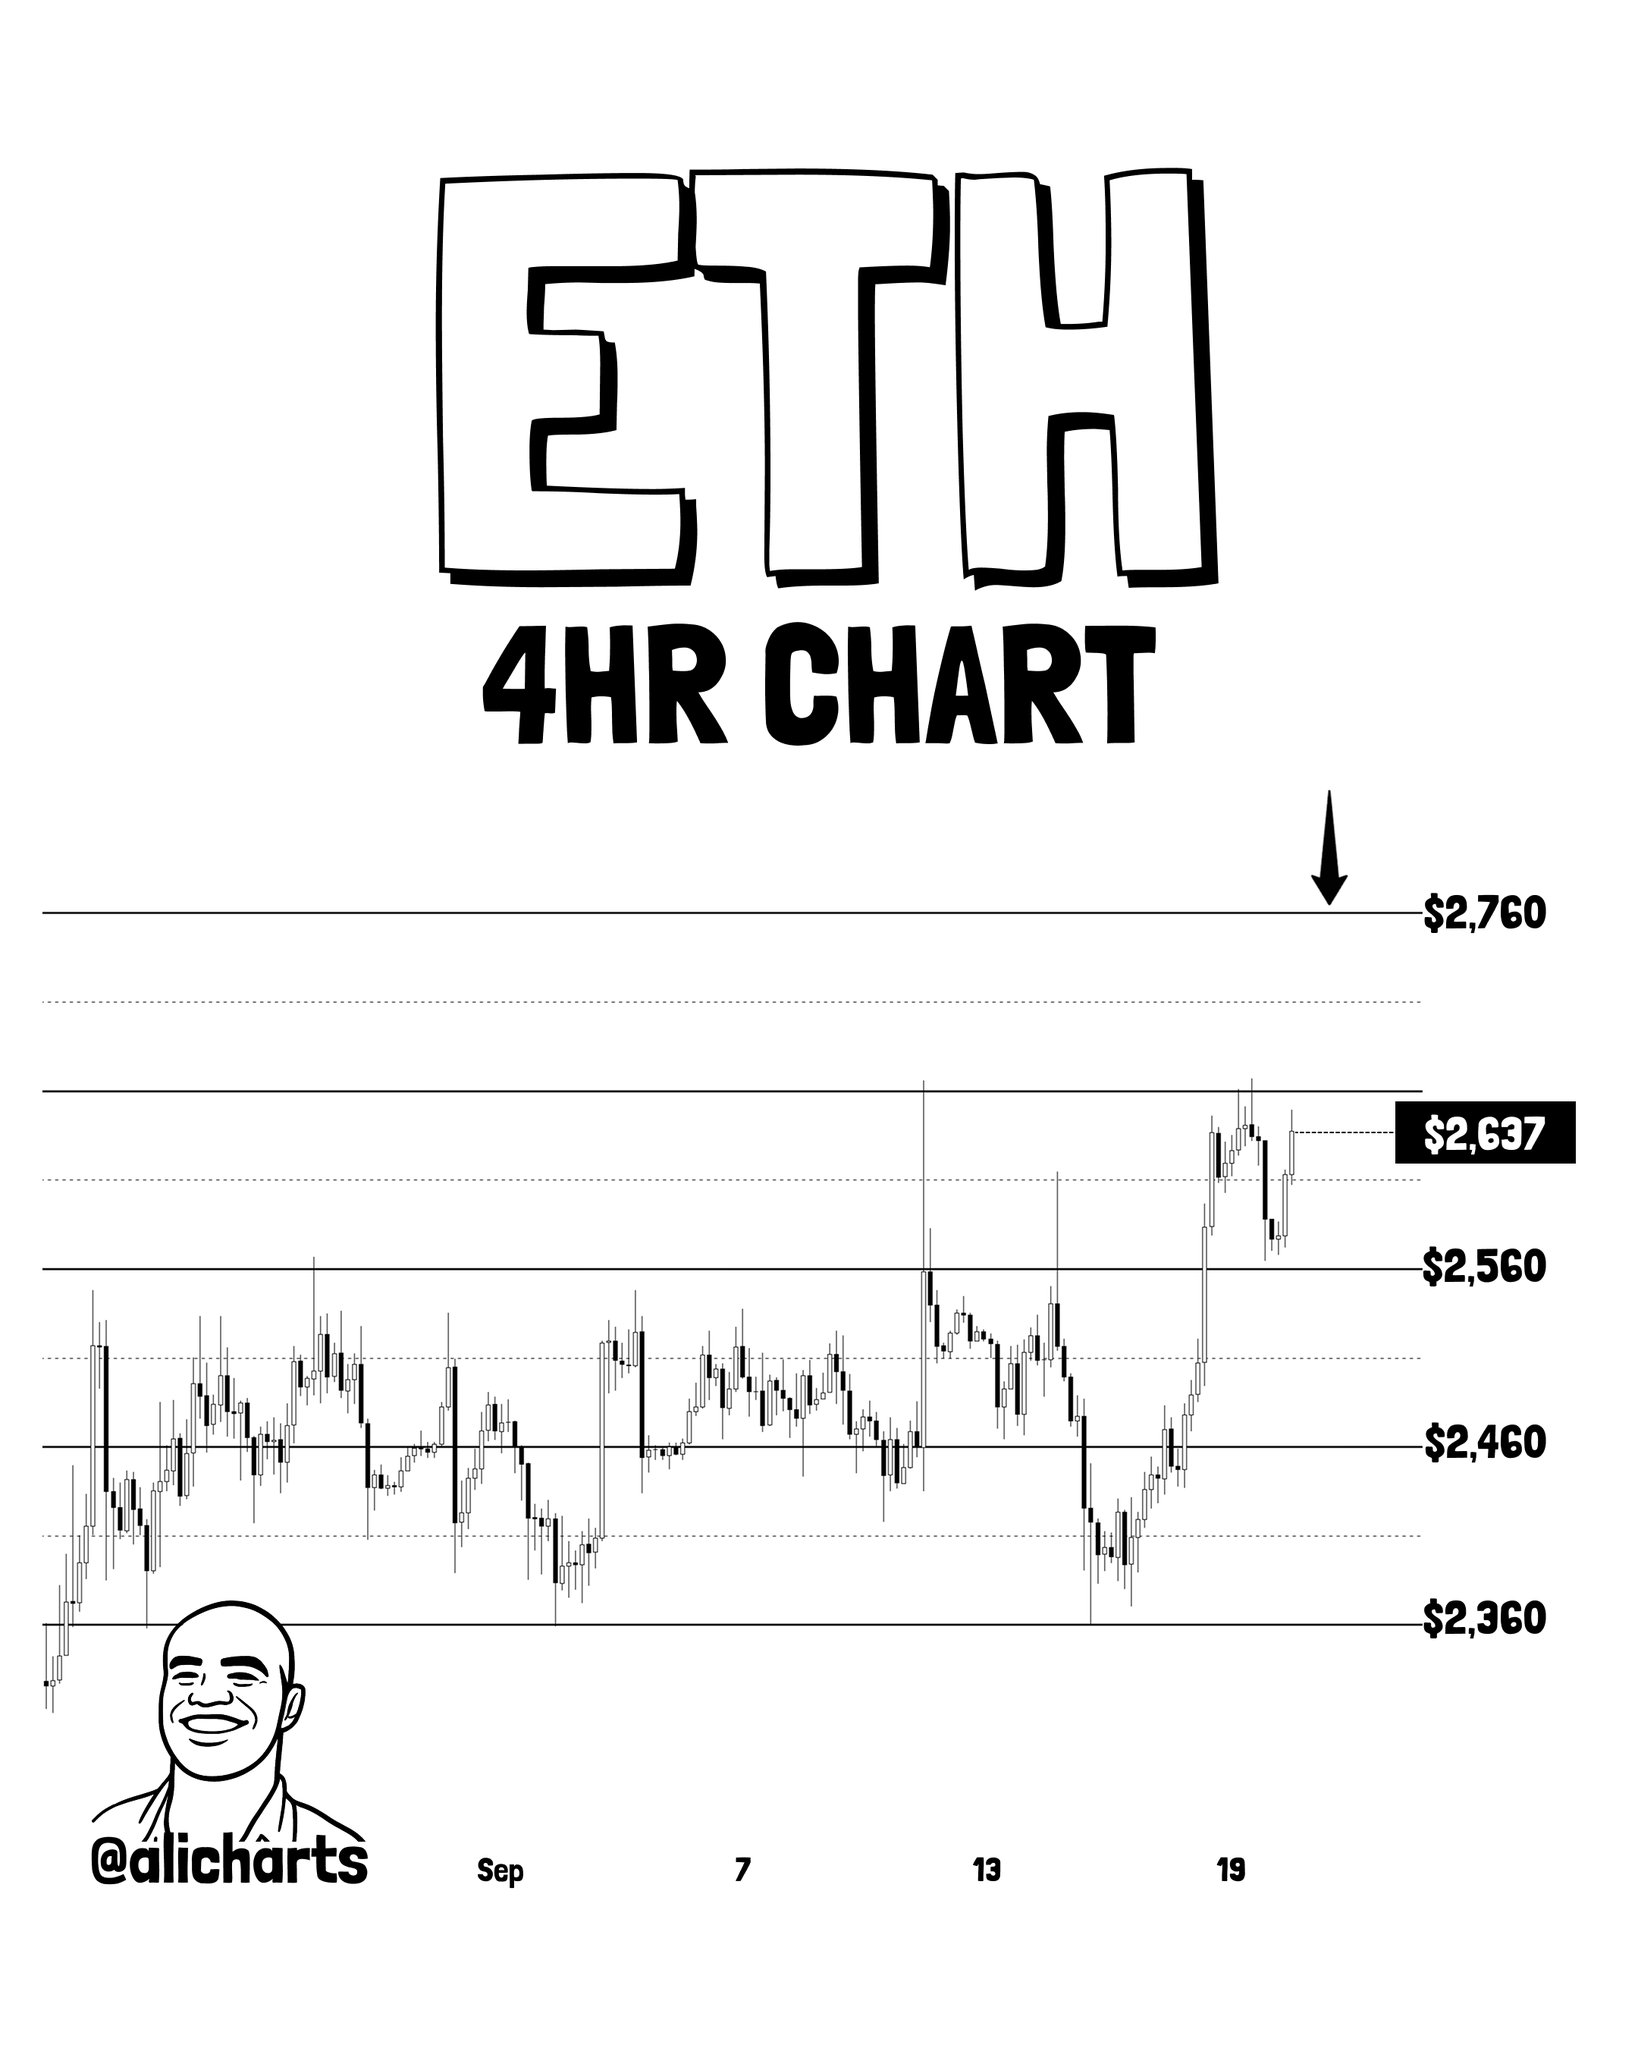
Phase 1 — Consolidation: ETH ranged between $2,360 (major support floor) and $2,560 (resistance ceiling) for multiple weeks. This compression built the energy required for a directional break.
Phase 2 — Breakout: Price breached $2,560 with conviction, converting a multi-week ceiling into a new structural level. Resistance flipped to support — the defining characteristic of a valid breakout.
Phase 3 — Retest and Bounce: Near September 19, ETH returned to $2,560, tested it as support, and held. Price is now at $2,659.35 — approximately $77 above the retest low — with momentum carrying it toward the next resistance cluster.
The chart marks $2,760 as the primary upside target, $2,460 as a mid-range support, and $2,360 as the macro support floor. Current price sits at $2,637 per the chart’s highlighted box, with the directional bias firmly long so long as $2,560 holds.
ETH 4-Hour Breakout Structure | Source: @alicharts (X)
What a Breakout-and-Retest Pattern Actually Measures
Before citing the signal’s implication, it is worth being precise about what this pattern confirms — and what it does not.
A breakout-and-retest is a confirmation pattern, not a prediction tool. It measures one specific thing: whether a previously resistant price level has genuinely shifted to support. When price breaks a level, retraces to it, and finds buyers there — the level has demonstrably changed function. Sellers who previously defended $2,560 have been absorbed; buyers are now defending it.
What it confirms: Structural demand at $2,560.
What it does not confirm: Time to target, or whether $2,760 will hold on the first approach.
What to watch for continuation: $2,560 must hold on any subsequent retest.
The 24-hour trading volume of $14.07 billion supports the reading — a breakout held with this volume level is not a low-liquidity false move.
Why $2,560 Is the Structural Pivot — Not Just a Number
The $2,560 level earned its significance through weeks of supply-demand interaction. Every approach to that ceiling during the consolidation phase was met with selling pressure — meaning that level represented where sellers were confident and buyers were not. The breakout above it means that aggregate of sellers was exhausted or absorbed.
The retest is what transforms a breakout from a possibility into a confirmation. Price returning to $2,560 after the initial break gave remaining sellers a second opportunity to reassert control. They did not. Buyers stepped in, held the level, and price resumed higher. That sequence — break, return, hold, advance — is the highest-confidence version of a bullish continuation setup in classical technical analysis.
This context matters for understanding the current Ethereum macro setup. As BlackRock’s approach toward a Spot Ethereum ETF has demonstrated, structural demand for ETH extends beyond technical setups into institutional appetite — which adds a fundamental dimension to the technical breakout now confirmed on the 4-hour chart.
Bullish and Bearish Scenarios
Bullish Scenario — Continuation to $2,760
If $2,560 continues to hold as support on any retests over the coming sessions, the measured move from the breakout projects ETH toward $2,760 — approximately 3.8% above current price. A clean approach to $2,760 without a loss of $2,560 confirms the breakout thesis in full. A close above $2,760 on the 4-hour chart would open the next structural layer.
Bearish Scenario — Loss of $2,560
A sustained 4-hour close below $2,560 invalidates the breakout thesis. Per @alicharts’ own structure, the stop-loss zone sits beneath this level. A confirmed break below $2,560 would shift the next focus to $2,460 mid-range support, and a failure there reopens $2,360 — the macro support floor that defined the base of the entire prior consolidation range. That scenario would represent a -11.3% decline from current price and would reset the technical structure to neutral.
Broader Context — What This Breakout Fits Into
The ETH breakout comes against a broader backdrop of improving market structure across major assets. Bitcoin’s 14-indicator heatmap recently registered zero bear signals — a composite reading that historically precedes sustained risk-on conditions. When Bitcoin’s on-chain structure is bullish and Ethereum is printing confirmed technical breakouts, the combination is not coincidental — it reflects a macro regime where capital is flowing back into the asset class with structural conviction rather than speculative rotation.
The $14.07 billion in 24-hour ETH volume further validates the current move. Breakouts accompanied by elevated volume are structurally more durable than those occurring in thin conditions — the buying pressure absorbing supply at $2,560 during the retest was real, not illusory.
Bottom Line
Ethereum has completed a textbook breakout-and-retest sequence above $2,560 — a level that resisted price for multiple weeks before being converted to support on a confirmed retest near September 19. Analyst Ali Martinez (@alicharts) identifies $2,760 as the next major target, representing 3.8% upside from current levels of $2,659.35. The bullish thesis remains intact so long as $2,560 holds on any subsequent retest — a loss of that level on a sustained 4-hour close invalidates the structure and reopens $2,460 and $2,360. The technical setup is confirmed. The only question the market must now answer is whether $2,560 holds. Watch that level with precision.
Frequently Asked Questions
What does the ETH $2,560 breakout-and-retest mean?
What is the analyst’s price target for Ethereum after this breakout?
What level would invalidate the Ethereum breakout thesis?
How long did ETH consolidate before breaking out above $2,560?
Source: Ali Charts · Published by CoinsProbe Markets Desk
The opinions and market insights shared on CoinsProbe represent the views of individual authors based on prevailing market conditions at the time of publication. Cryptocurrency investments carry significant risk and volatility. Readers are encouraged to conduct their own research and seek professional financial advice before making investment decisions. CoinsProbe and its contributors do not accept responsibility for financial losses or decisions made based on published content.
CoinsProbe may publish sponsored articles, affiliate links, or promotional collaborations. All sponsored material is clearly labeled to maintain transparency with our audience. Our editorial decisions remain fully independent, and advertising partnerships do not influence reviews, rankings, or published opinions.
Since 2023, CoinsProbe has delivered reliable insights on cryptocurrency, blockchain, and digital assets. Our content is created by experienced researchers and analysts who follow strict editorial standards focused on accuracy, transparency, and credibility. Every article is carefully reviewed and verified using trusted sources and current market data. We provide unbiased analysis and timely updates covering everything from emerging crypto projects to major industry developments.