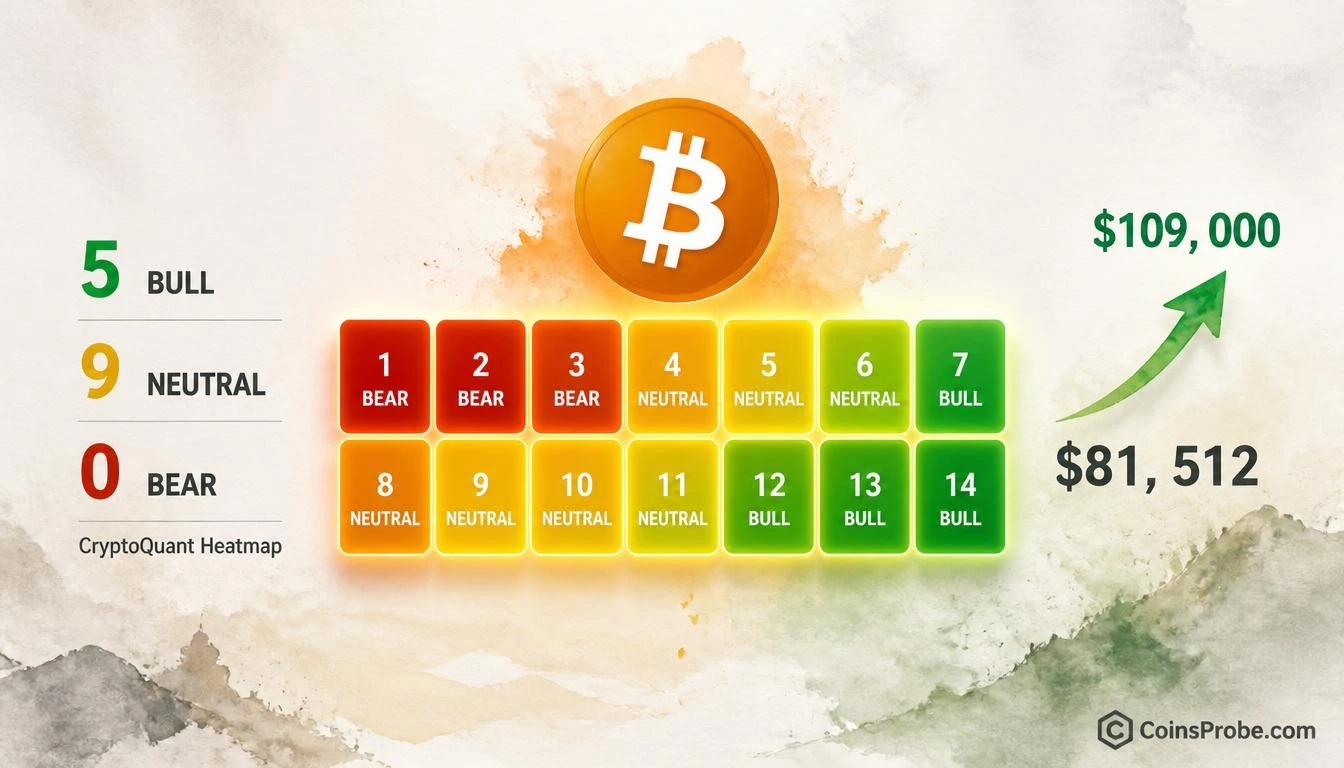

- Bitcoin trades at $81,512 (+1.18% 24h) as CryptoQuant's 14-indicator heatmap shows 5 BULL, 9 NEUTRAL, 0 BEAR readings
- CryptoQuant CEO Ki Young Ju flags indicators "turning from red to green" — a configuration last seen in Q1 2019, Q4 2020, and Q1 2023
- Prior zero-bear inflections preceded rallies of +340%, +600%, and +450% respectively from each transition point
- Watch $74,000 as the critical invalidation level — a sustained close below would signal a failed inflection
Bitcoin is trading at $81,512 — up 1.18% in the last 24 hours — with a market capitalization of $1.637 trillion. Beneath the surface, a composite on-chain heatmap spanning 14 independent indicators has reached a historically significant configuration: five indicators registering BULL, nine reading NEUTRAL, and zero showing BEAR. That last number — zero — is the one that matters.
The signal was flagged on September 19, 2026, by Ki Young Ju (@ki_young_ju), founder and CEO of CryptoQuant, whose exact words were: “Bitcoin indicators are turning from red to green.” Terse by design — but the heatmap behind that statement carries a decade of historical weight.
The CryptoQuant Heatmap — What It Actually Measures
Before citing the reading, the mechanics matter. CryptoQuant’s Bitcoin indicator heatmap aggregates 14 independent signals across five structural categories: Valuation, Behavior, Liquidity, Technical, and Sentiment. Each indicator is assigned a discrete status — BULL, NEUTRAL, or BEAR — based on its current reading relative to its own historical range. The composite view eliminates single-indicator noise by requiring broad-based agreement before a directional regime is declared.
This is not an RSI. It is not a funding rate. It is a cross-category on-chain regime indicator built from wallet behavior, realized price mechanics, miner activity, and market structure simultaneously.
The current reading across all five categories as of September 19, 2026:
| Category | Indicators in BULL | Status |
|---|---|---|
| Valuation | Pi Cycle Top, MVRV Z-Score (Neutral) | Mixed — room for upside |
| Behavior | Trader NUPL, Adjusted SOPR | BULL |
| Liquidity | Neutral readings | NEUTRAL |
| Technical | Bull/Bear Indicator | BULL |
| Sentiment | Analyst Consensus Index | BULL |
Source: CryptoQuant heatmap, September 19, 2026
Signal — 5 BULL, 9 NEUTRAL, 0 BEAR: What the Heatmap Chart Reveals
The heatmap shared by @ki_young_ju covers approximately ten years of Bitcoin history (2016–2026), plotting all 14 indicators simultaneously across time. Three structural observations stand out:
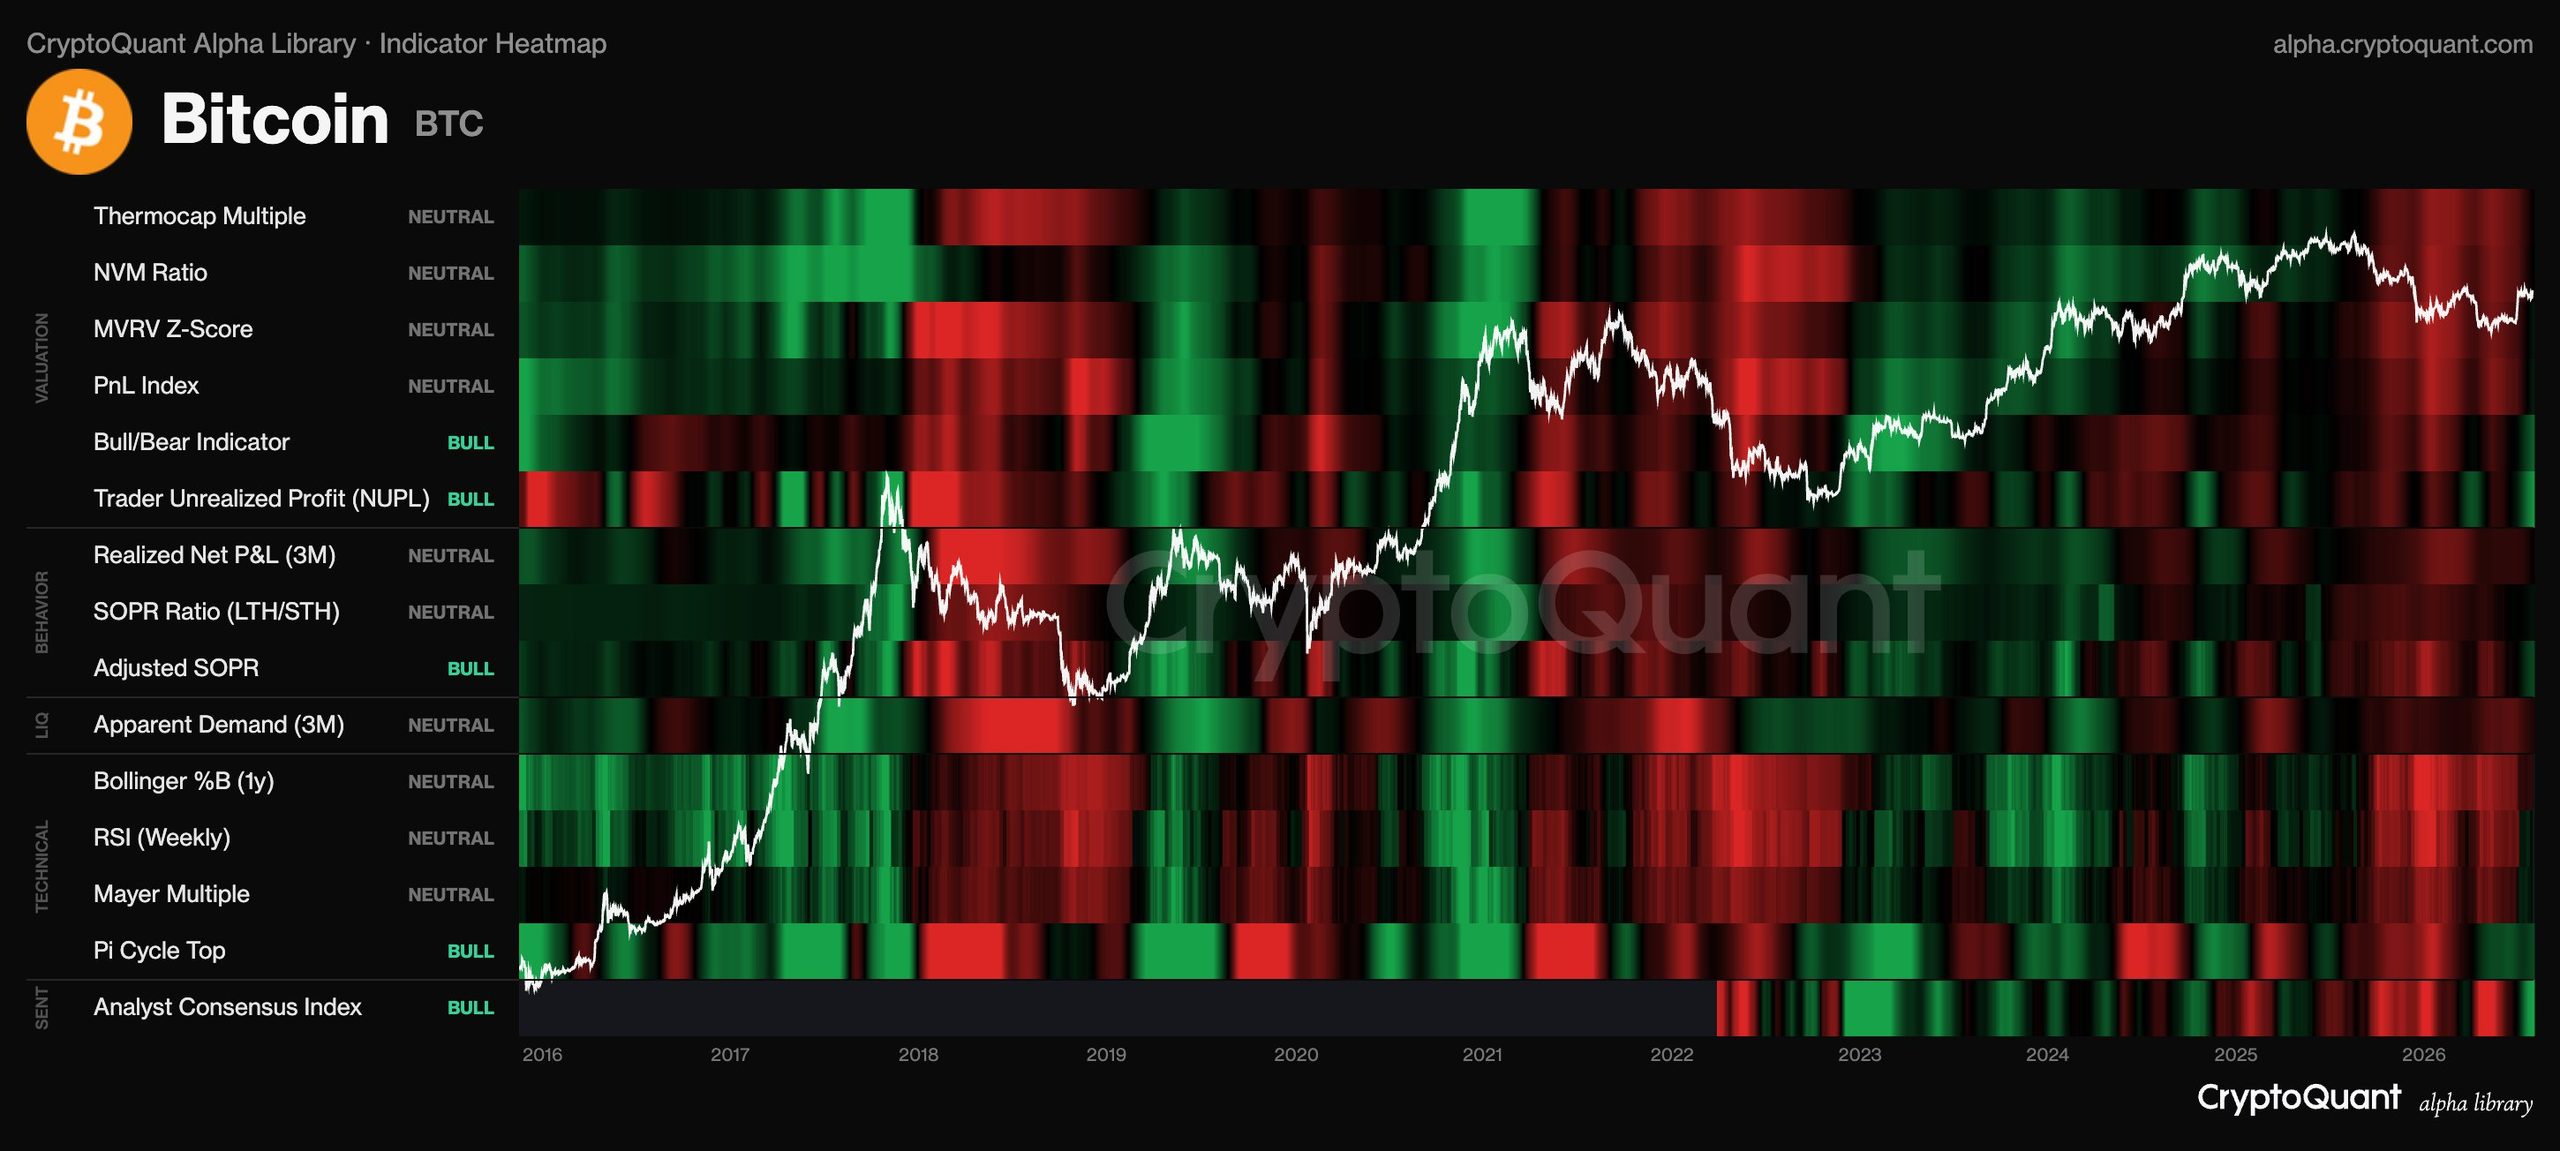
First: The rightmost columns of the heatmap — representing current readings — are transitioning from red dominance toward green. This pattern is visually identical to the 2019–2020 recovery phase and the early 2020–2021 bull continuation phase, both of which preceded sustained upside moves of +1,000%+ and +600%+ respectively from their own red-to-green inflection points.
Second: The MVRV Z-Score and Mayer Multiple — two of the most reliable valuation ceiling indicators — remain in NEUTRAL territory. Historically, these indicators move into BEAR only near cycle tops. Their current neutral status implies Bitcoin is in mid-cycle positioning, not peak territory. This is a structurally meaningful distinction: the market has upside runway before valuation exhaustion signals emerge.
Third: Trader NUPL (Net Unrealized Profit/Loss) and Adjusted SOPR (Spent Output Profit Ratio) are both registering BULL. These are behavioral indicators — they measure whether the aggregate holder base is in profit and whether coins being moved on-chain are being sold at a gain or loss. Both reading BULL simultaneously confirms that realized selling pressure is not at a level consistent with distribution.
Historical Context — What Zero Bear Readings Have Preceded
The heatmap’s decade-long history provides three directly comparable periods where the indicator distribution shifted from red-dominated to zero-bear configurations:
| Period | Configuration at Shift | Subsequent BTC Performance |
|---|---|---|
| Q1 2019 | Red → Neutral/Green transition, 0 Bear | +340% over 7 months to ~$14,000 |
| Q4 2020 | Full green phase initiated, 0 Bear | +600% to ~$65,000 peak (April 2021) |
| Q1 2023 | Red-to-green inflection, 0 Bear | +450% to ~$73,000 peak (March 2024) |
Source: CryptoQuant historical heatmap data
In each prior instance, the transition to zero-bear status did not mark an immediate vertical move — it marked the beginning of a sustained regime shift. The NEUTRAL majority in current readings is consistent with early-to-mid phase positioning in all three historical analogues above. That is not a weakness of the signal; it is precisely what those prior setups looked like before the larger moves developed.
This is also consistent with broader institutional accumulation documented in recent weeks. Morgan Stanley’s Bitcoin ETF registered $51.5M in BTC purchases over 20 days with zero outflows — structural demand that aligns with an on-chain environment showing no distributional stress. Separately, BlackRock moved $285.5M in ETH and BTC to Coinbase Prime, a custody action consistent with active portfolio positioning rather than liquidation.
What This Signal Says — And What It Doesn’t
What it says: Bitcoin’s on-chain regime, as measured across 14 independent indicators spanning valuation, behavior, liquidity, technicals, and sentiment, has exited the red (bearish) zone. Zero of 14 indicators are currently registering conditions associated with bear markets or cycle tops.
What it doesn’t say: It does not specify direction over the next 24–72 hours. It does not guarantee a specific price target. Five of 14 indicators are in BULL, which means nine remain in transition — the green phase is beginning, not complete.
What to watch for continuation: A sustained move of NEUTRAL indicators — particularly the MVRV Z-Score and Mayer Multiple — into BULL territory would represent full heatmap confirmation. Historically, the most aggressive price appreciation phases have occurred when 8 or more of 14 indicators register BULL simultaneously.
The One Risk the Heatmap Introduces
Nine NEUTRAL readings represent a specific risk: neutrals can revert to red. If Bitcoin loses key realized price support levels and on-chain spending behavior deteriorates — specifically if Adjusted SOPR drops below 1.0 on a sustained basis — the five BULL readings could fade back toward neutral before full green confirmation is achieved. That scenario would constitute a failed inflection, not an unprecedented one. It occurred briefly in July 2019 during the mid-cycle correction from $14,000 to $6,500 before the 2020–2021 bull fully initiated.
The $131M long book held by Machi Big Brother across ETH, BTC, and HYPE reflects similar mid-cycle conviction from sophisticated participants — but concentrated long positioning also amplifies volatility risk if the heatmap’s NEUTRAL indicators fail to confirm.
Bullish Scenario — Heatmap Reaches 8+ BULL Indicators
If MVRV Z-Score and Mayer Multiple transition from NEUTRAL to BULL — consistent with Bitcoin sustaining above its realized price and 200-day moving average — the heatmap enters a configuration that in prior cycles (2020–2021, 2023–2024) preceded the most aggressive appreciation phases. The immediate structural target based on the 2023 analogue is a retest of $109,000, Bitcoin’s prior all-time high. Full green confirmation with 10+ BULL readings has historically corresponded with prices 40%–200% above the inflection point.
Bearish Scenario — NEUTRAL Indicators Reverse to Red
A deterioration in Adjusted SOPR below 1.0 sustained for more than 14 days, combined with MVRV Z-Score declining toward its bear market floor, would signal that the red-to-green transition is failing. In that scenario, the heatmap reverts toward a configuration last seen in late 2022 near $16,000 lows. The first structural warning level is a confirmed daily close below $74,000 — the most recent demand zone established in the current cycle.
Bottom Line
CryptoQuant’s 14-indicator Bitcoin heatmap has reached a configuration that has appeared three times in the past decade — Q1 2019, Q4 2020, and Q1 2023 — each time preceding multi-hundred-percent appreciation phases. The current reading: 5 BULL, 9 NEUTRAL, 0 BEAR. The zero is the signal. Ki Young Ju’s declaration that “Bitcoin indicators are turning from red to green” is not a price prediction — it is a regime classification. On-chain behavior (Trader NUPL, Adjusted SOPR), technicals (Bull/Bear Indicator), and sentiment (Analyst Consensus Index) are all confirming the shift.
Valuation indicators remain neutral, confirming mid-cycle rather than peak positioning. The transition is not complete — nine indicators must still move from neutral to green for full confirmation. Watch $74,000 as the level whose loss would challenge the inflection thesis, and watch the MVRV Z-Score and Mayer Multiple for the next directional confirmation as Bitcoin trades at $81,512.
Frequently Asked Questions
What does CryptoQuant’s indicator heatmap currently show for Bitcoin?
Has Bitcoin seen this zero-bear heatmap configuration before, and what happened next?
What level must Bitcoin hold to keep the bullish heatmap thesis intact?
What would confirm the heatmap’s bullish signal is fully validated?
Source: Ki Young Ju · Published by CoinsProbe Markets Desk
The opinions and market insights shared on CoinsProbe represent the views of individual authors based on prevailing market conditions at the time of publication. Cryptocurrency investments carry significant risk and volatility. Readers are encouraged to conduct their own research and seek professional financial advice before making investment decisions. CoinsProbe and its contributors do not accept responsibility for financial losses or decisions made based on published content.
CoinsProbe may publish sponsored articles, affiliate links, or promotional collaborations. All sponsored material is clearly labeled to maintain transparency with our audience. Our editorial decisions remain fully independent, and advertising partnerships do not influence reviews, rankings, or published opinions.
Since 2023, CoinsProbe has delivered reliable insights on cryptocurrency, blockchain, and digital assets. Our content is created by experienced researchers and analysts who follow strict editorial standards focused on accuracy, transparency, and credibility. Every article is carefully reviewed and verified using trusted sources and current market data. We provide unbiased analysis and timely updates covering everything from emerging crypto projects to major industry developments.