- SPCX breaks ascending triangle resistance near $155 — analyst target at $179.61 per @alicharts thread
- Elon Musk named co-director of Project Meridian, a Pentagon initiative — marks return to official Trump administration advisory role
- TSLA inside descending channel at $379.85 — upper channel breakout trigger zone at $399.76–$423.14
- SpaceX-related assets up roughly 15% since Thursday per @alicharts — SPCX breakout confirmation depends on $155 holding
Elon Musk’s return to an official advisory role in the Trump administration has sent two assets directly tied to his business empire into focus — the SpaceX-linked ETF SPCX and Tesla stock TSLA. The catalyst is specific and named: Musk has been appointed co-director of Project Meridian, a Pentagon initiative studying the future of warfare, according to analyst Ali Martinez (@alicharts), who flagged both chart breakouts in a five-part thread on October 6, 2026.
The market response has been immediate. SpaceX-related assets are up roughly 15% since Thursday, per Martinez’s note, with SPCX printing a technical breakout above a well-defined ascending triangle on its daily chart. TSLA, meanwhile, remains inside a descending channel — with the key question being whether the Musk catalyst is sufficient to force a channel breakout. At the time of writing, SPCX is trading at approximately $0.00177, down 2.29% over 24 hours, reflecting ongoing crypto-market volatility in the token that tracks SpaceX exposure.
The Catalyst — Project Meridian and What It Means for SpaceX
Musk’s appointment as co-director of Project Meridian is not a symbolic role. Pentagon advisory positions carry procurement influence, and SpaceX’s existing Department of Defense contracts — spanning Starlink communications, satellite launch services, and transport logistics — stand to be materially reinforced by Musk’s direct presence at the decision-making table. This is a structural, contractual development, not a sentiment trade. The mechanism is straightforward: Pentagon proximity → accelerated contract pipeline → SpaceX revenue visibility → SPCX pricing in that forward expectation. For further context on Musk’s expanding influence across technology and government, see our earlier coverage of Elon Musk’s AI projections through 2027–2028.
Signal 1 — SPCX Ascending Triangle Breakout
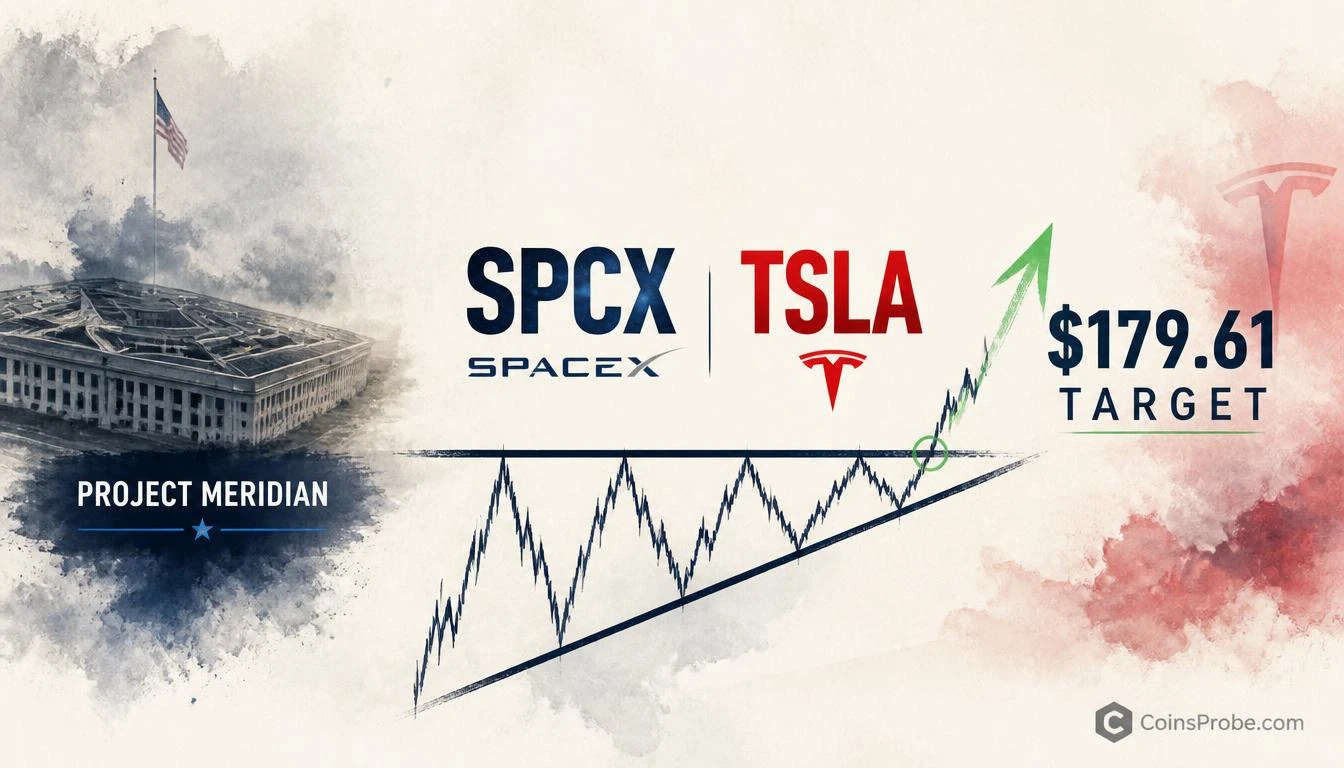
The SPCX daily chart shared by @alicharts reveals a textbook ascending triangle formation spanning approximately mid-September through late October. The structure is defined by a flat horizontal resistance zone near the $155 area and a rising trendline connecting a sequence of higher lows from left to right — a classic setup that compresses price into an increasingly narrow range until a directional resolution is forced.
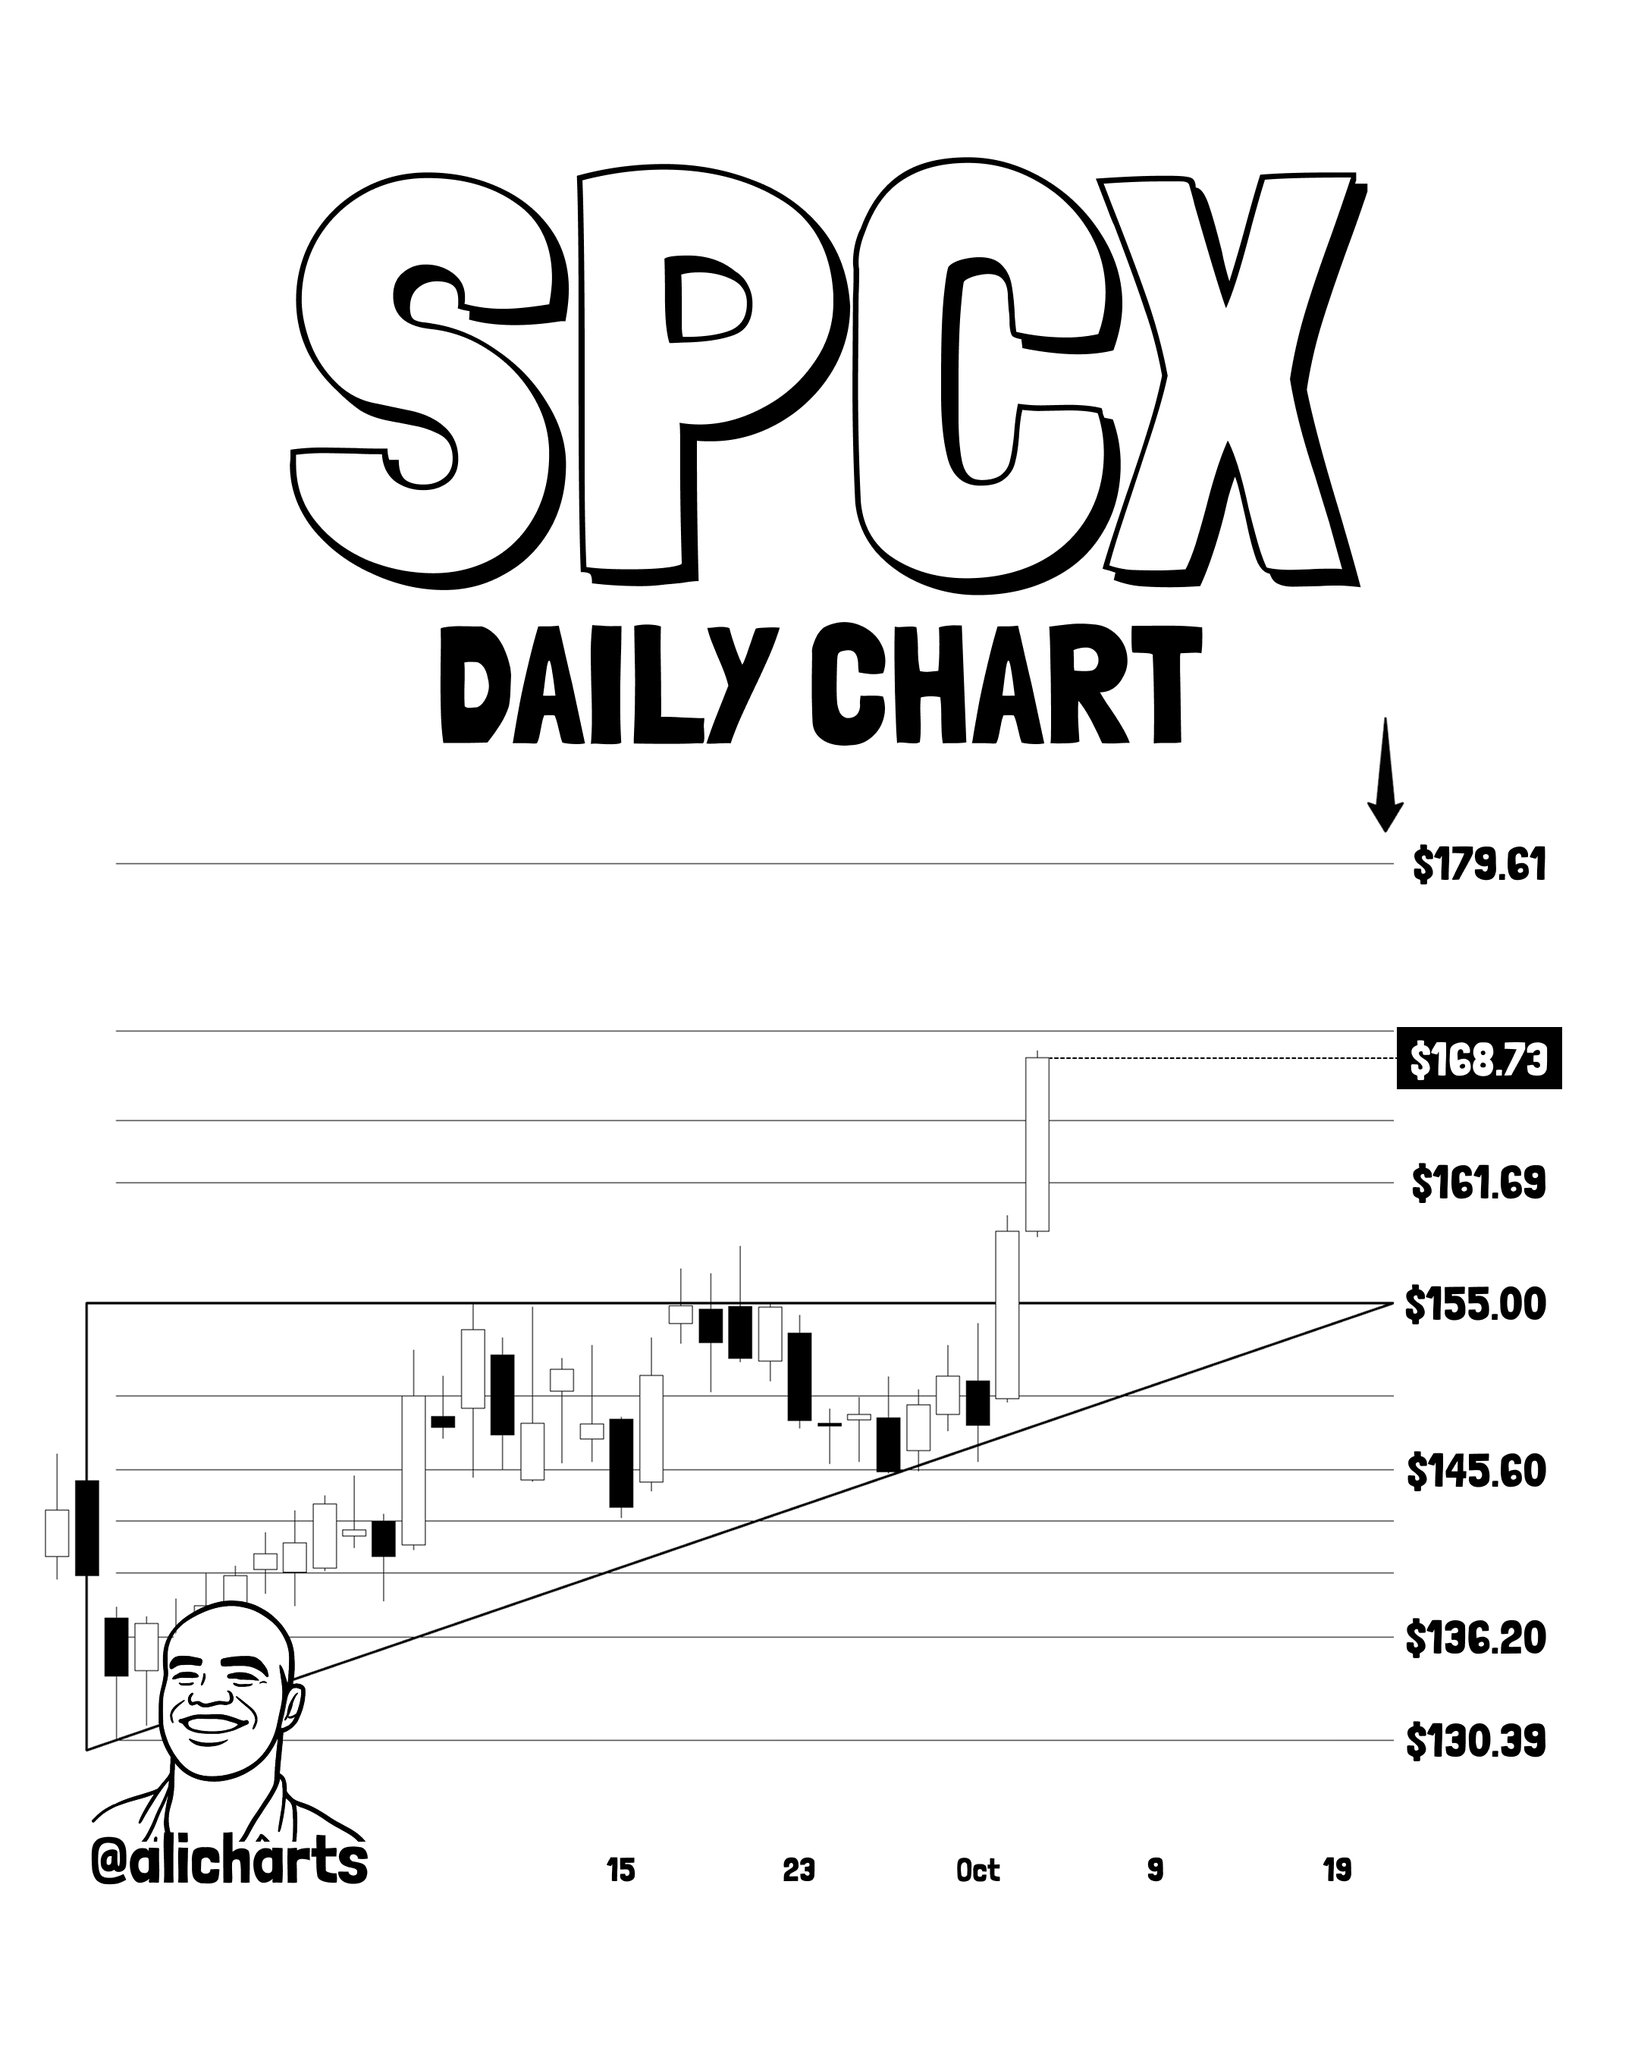
Price has broken upward through the flat resistance with a sharp bullish candle, reaching toward the $168.73 level marked on the chart as the current high. Critically, the $179.61 label sits above current price with a downward arrow — indicating the analyst’s measured-move target if the breakout holds. The ascending triangle’s measured move is calculated by adding the height of the widest part of the triangle to the breakout point, a standard technical methodology. Key levels visible on the chart: $136.20 and $145.60 as prior support structure, $155.00 as the broken resistance (now potential support), $168.73 as the current high, and $179.61 as the projected upside target.
Martinez notes that SpaceX is already up roughly 15% since Thursday — meaning the initial momentum is confirmed. Whether $179.61 is reached depends on whether the $155 breakout level holds on any retest.
Bullish Scenario
SPCX sustains above $155 on a daily closing basis → ascending triangle breakout confirmed → measured-move target of $179.61 opens as the primary upside objective.
Bearish Scenario
A daily close back below $155 would constitute a failed breakout → price risks returning to the $145.60–$136.20 support zone → Musk catalyst priced as temporary rather than structural.
Signal 2 — TSLA Descending Channel and the Breakout Trigger
Tesla’s daily chart presents a different technical picture. @alicharts’ chart shows TSLA trading within a clearly defined descending channel spanning approximately March through November, with two parallel downward-sloping boundary lines and a dashed midline. Price is currently near the $379.85 level, which is boxed on the chart as the current reference point.
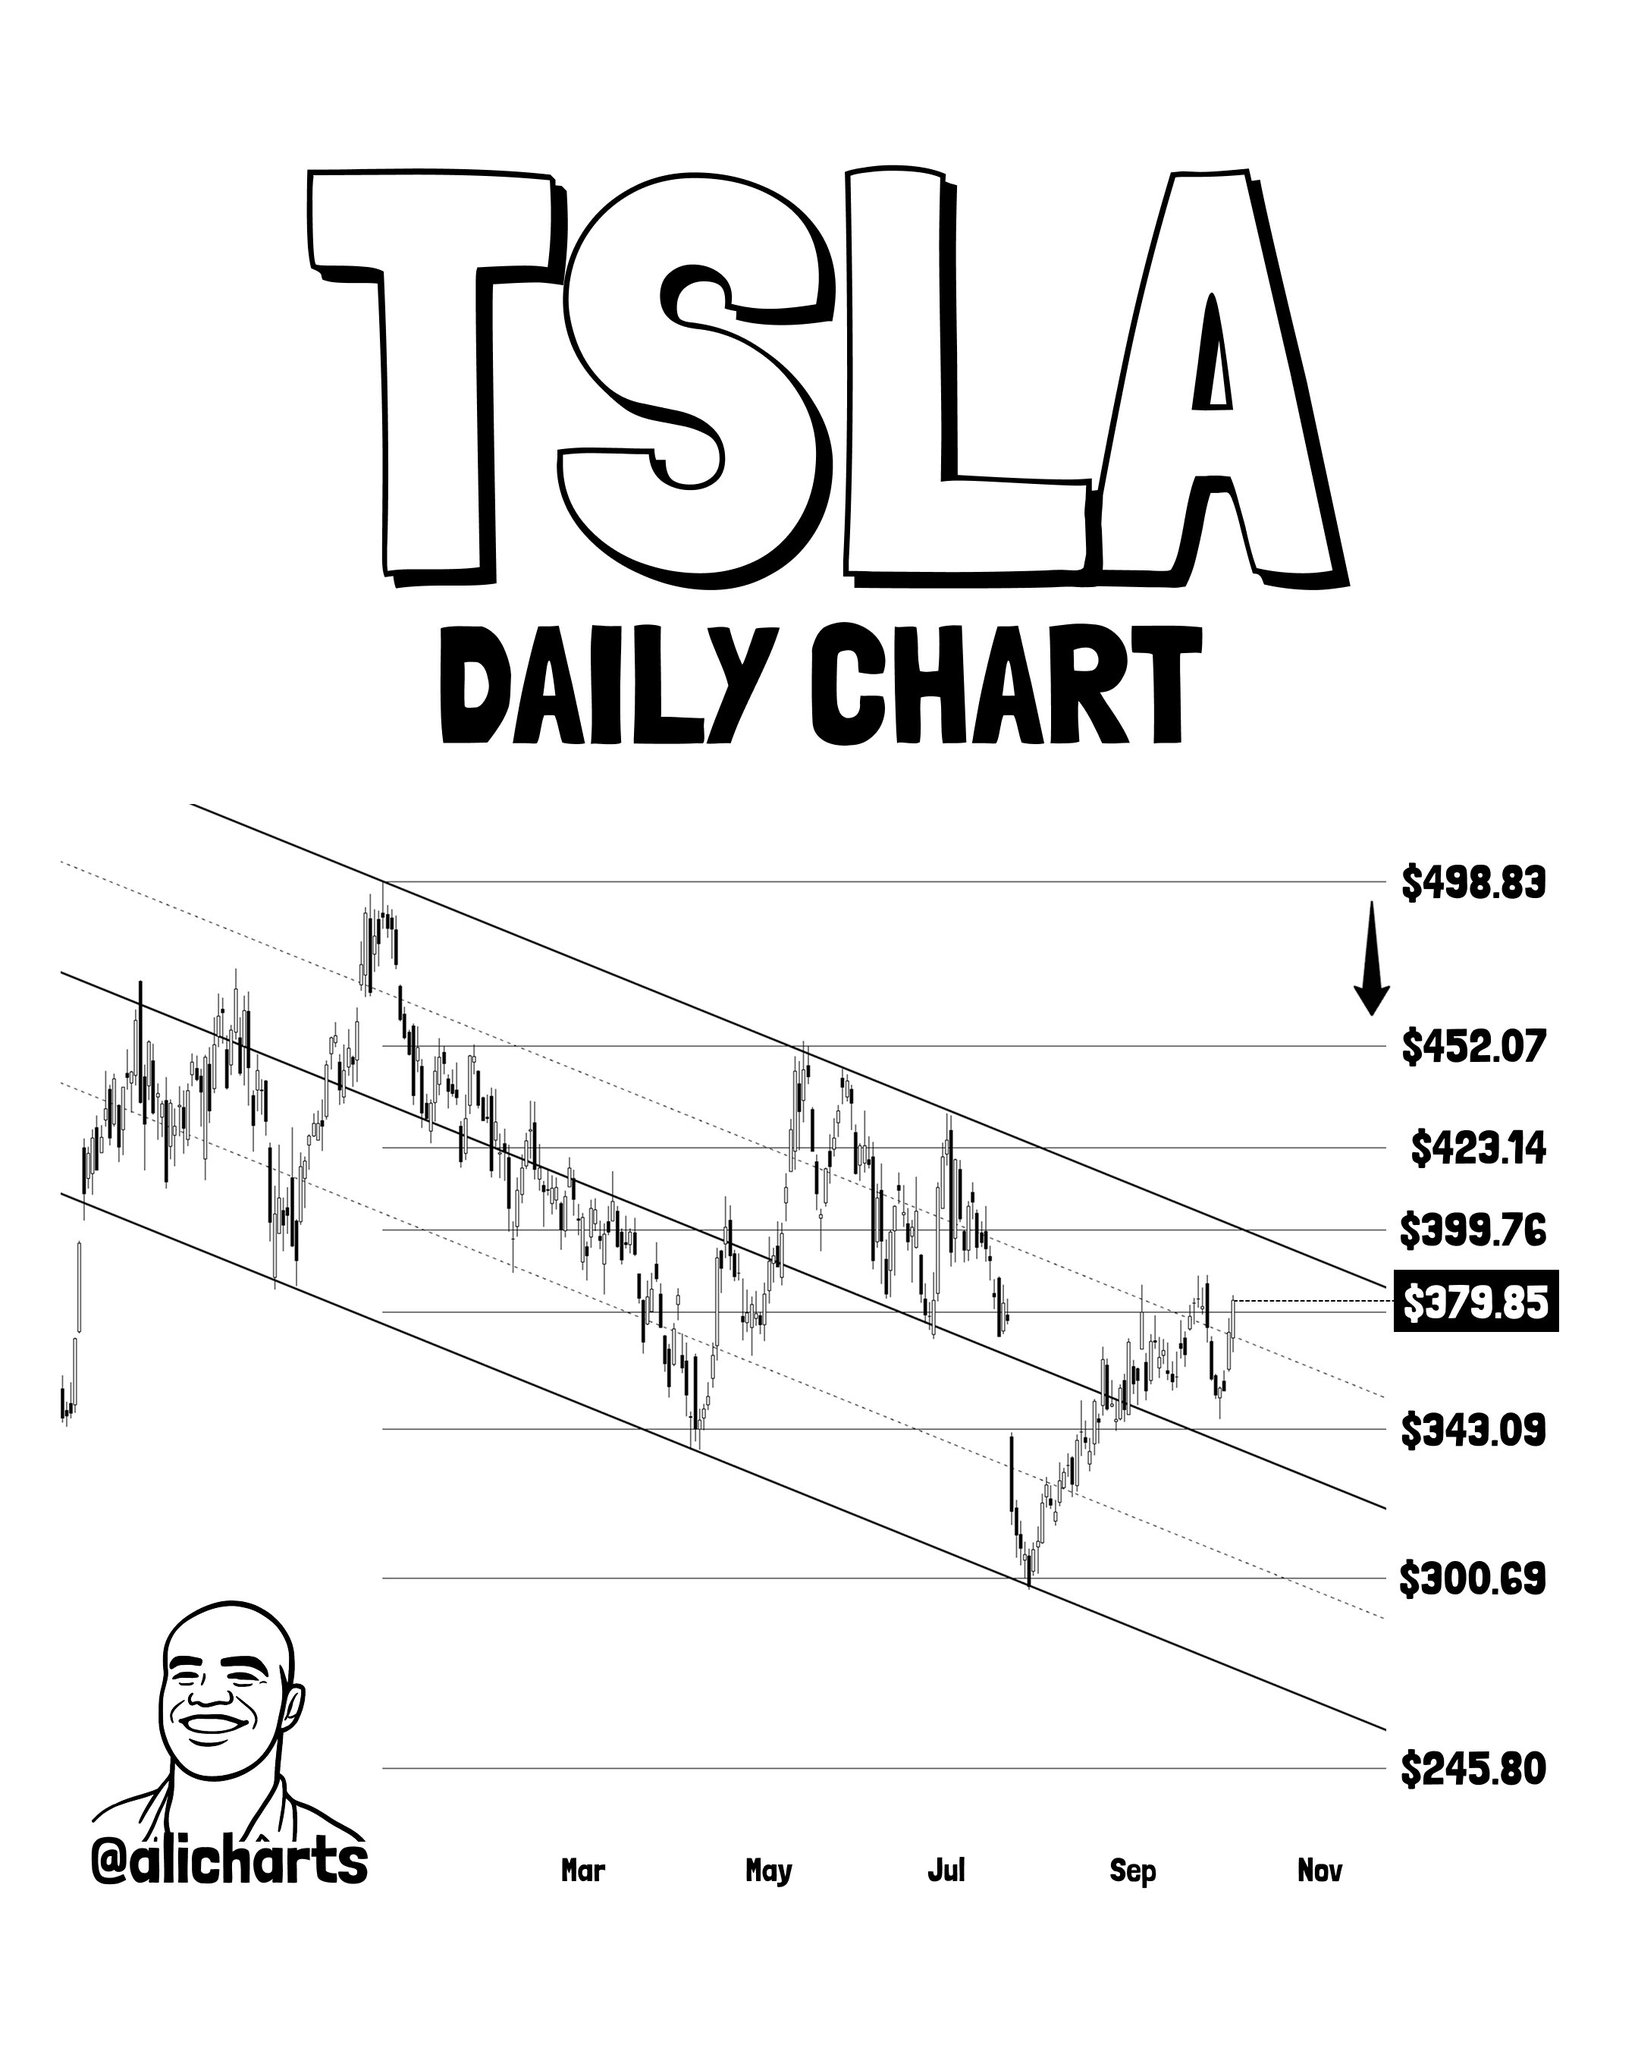
A downward arrow drawn near the upper right of the chart indicates that bearish channel continuation remains the primary visual scenario. However, the analyst’s framing of the thread — “SpaceX and Tesla Break Out” — suggests Martinez is watching for a potential break above the upper channel boundary, which falls in the $399.76–$423.14 zone based on the chart’s labeled price levels. A sustained close above that zone would be required to invalidate the descending channel structure. The chart labels additional levels for context: $452.07, $498.83 above, and $343.09, $300.69, $245.80 as deeper downside references within the channel.
It is important to note the distinction between the two assets: SPCX’s breakout appears confirmed by price action already clearing resistance. TSLA’s situation, per the chart, shows the Musk catalyst in focus but the descending channel still technically intact — the breakout is anticipated, not yet confirmed.
Bullish Scenario
TSLA closes above the upper channel boundary near $399.76–$423.14 on a daily basis → descending channel structure invalidated → opens path toward $452.07 and the $498.83 zone.
Bearish Scenario
TSLA fails to reclaim $399.76 and continues lower within the channel → $343.09 becomes the next structural reference → $300.69 and below remain viable within channel math.
Putting the Catalyst in Context
Political appointments carry a specific risk profile. Musk’s previous government adjacency — via the Department of Government Efficiency — generated an initial market premium that partially unwound as the operational reality of that role clarified. Project Meridian, as a Pentagon initiative focused on the future of warfare, is a different category of engagement: it sits closer to SpaceX’s core defense revenue streams than DOGE’s cost-cutting mandate did. That said, the history of government-adjacent trades suggests the initial spike is often faster than the fundamental delivery timeline. For a related example of how Musk-adjacent market events can overcorrect, see our coverage of the $SLINK memecoin collapse following an Elon reply. The macro backdrop also matters — US 30-year bond yields are at their highest since 2002, which creates a risk-appetite headwind for growth-oriented positions including speculative defense-tech exposure.
The technical setups flagged by @alicharts are real and measurable. The ascending triangle breakout in SPCX is a confirmed pattern with a defined target at $179.61. The TSLA descending channel remains intact with $399.76–$423.14 as the breakout trigger zone. Whether Musk’s Pentagon role translates into durable upside for both assets, or whether the political premium fades before the fundamentals arrive, will be answered at $155 for SPCX and $399.76 for TSLA in the sessions ahead.
Frequently Asked Questions
What is Project Meridian and why does it matter for SpaceX?
What is the SPCX ascending triangle target price?
What level must TSLA reclaim to exit its descending channel?
Why is SPCX’s live price near $0.0018 when the chart shows $155–$179?
Source: Ali Charts · Published by CoinsProbe Markets Desk
The opinions and market insights shared on CoinsProbe represent the views of individual authors based on prevailing market conditions at the time of publication. Cryptocurrency investments carry significant risk and volatility. Readers are encouraged to conduct their own research and seek professional financial advice before making investment decisions. CoinsProbe and its contributors do not accept responsibility for financial losses or decisions made based on published content.
CoinsProbe may publish sponsored articles, affiliate links, or promotional collaborations. All sponsored material is clearly labeled to maintain transparency with our audience. Our editorial decisions remain fully independent, and advertising partnerships do not influence reviews, rankings, or published opinions.
Since 2023, CoinsProbe has delivered reliable insights on cryptocurrency, blockchain, and digital assets. Our content is created by experienced researchers and analysts who follow strict editorial standards focused on accuracy, transparency, and credibility. Every article is carefully reviewed and verified using trusted sources and current market data. We provide unbiased analysis and timely updates covering everything from emerging crypto projects to major industry developments.