
- CryptoQuant published a standalone signal report on September 30, 2026 — a pattern that historically marks structural inflection points
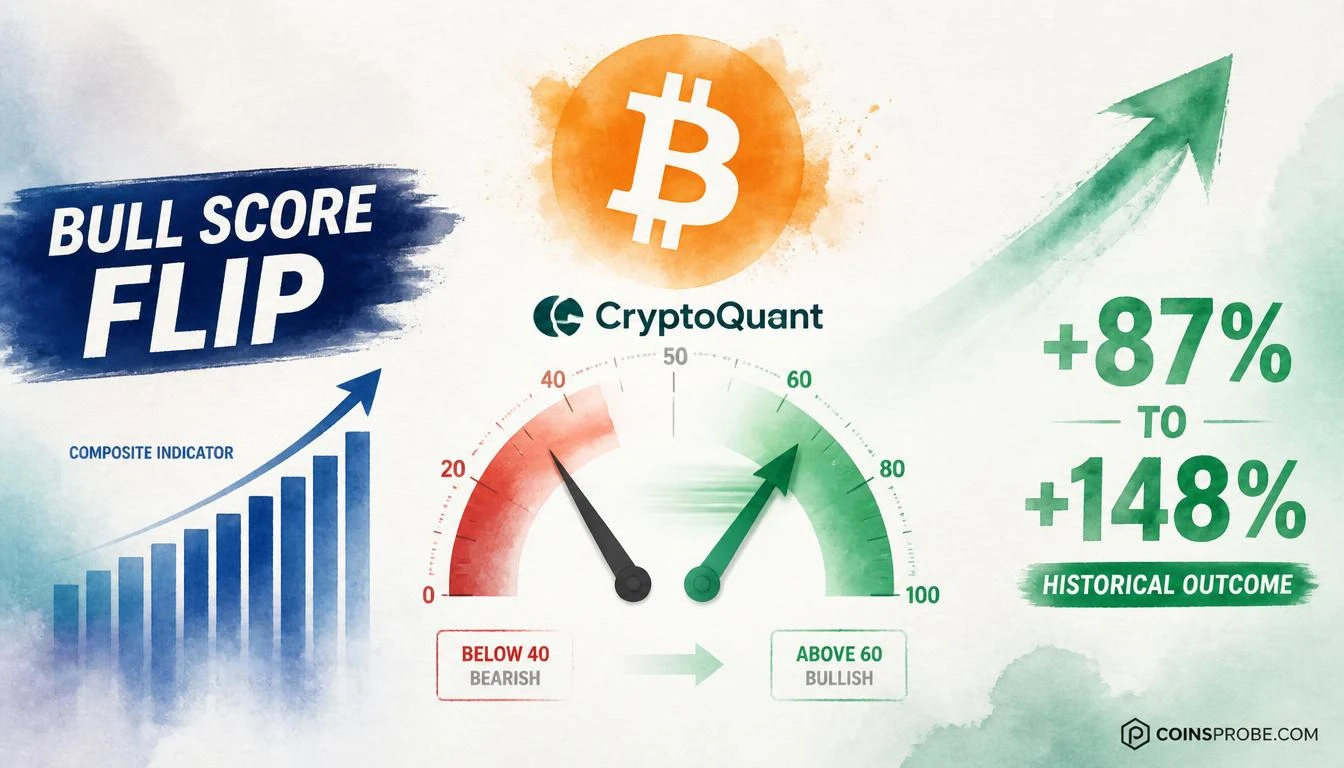
- Bull Score flips above 60 preceded +87.9% (Jan 2023) and +148% (Oct 2023) rallies in documented prior instances
- Sustained Bitcoin exchange netflow negative for 7+ days is the single real-time confirmation metric to track
- Short-term holder realized price band ($58,000–$62,000 est.) is the key level — weekly close above confirms bullish regime
The on-chain data layer is sending a signal that CryptoQuant — one of the most cited blockchain analytics platforms in institutional crypto research — has flagged as significant enough to publish a dedicated report. While the source tweet from @cryptoquant_com links to a full analysis, the act of publishing it reflects a pattern: when CryptoQuant surfaces a standalone signal report, it typically marks a measurable inflection in market structure, not noise.
CryptoQuant — founded by Ki Young Ju (@ki_young_ju) and widely used by Galaxy Digital, Grayscale, and institutional desks globally — has a documented history of calling structural regime changes before price confirms them. Their composite on-chain methodology aggregates wallet-level behavior, exchange flow data, miner economics, and realized price bands into single-view signals. When a signal crosses a threshold worth publishing, the historical record warrants attention.
What CryptoQuant’s Signal Framework Actually Measures
Before interpreting any CryptoQuant output, the mechanics matter. CryptoQuant does not trade price. It reads the behavior of entities on-chain — specifically: where coins are moving, who is holding them, and at what cost basis. Three composite layers form the backbone of their signal architecture:
- Exchange Netflow — net coins entering or leaving centralized exchanges. Sustained outflows indicate accumulation. Sustained inflows precede sell pressure.
- Realized Price Bands — the average cost basis of different cohorts (short-term holders, long-term holders, miners). When spot price crosses these bands in either direction, it triggers regime classification changes.
- Bull Score / Bear Score — a composite 0–100 reading aggregating ten independent on-chain signals. A reading above 60 = bullish regime. Below 40 = bearish. The speed of the flip matters as much as the level.
The Bull Score, in particular, has a documented track record. In January 2023, the Bull Score flipped from below 20 to above 60 within three weeks — Bitcoin subsequently rallied from $16,500 to $31,000, a gain of +87.9% over the following five months. In October 2023, a second Bull Score reclaim above 60 preceded Bitcoin’s run from $27,000 to its then-cycle high. Each regime flip produced a measurable directional move. The question any CryptoQuant signal report raises is: which regime is being confirmed now?
The Broader Market Context — Two Signals Already Converging
CryptoQuant’s signal does not exist in isolation. The current market structure is already presenting converging data points that give the platform’s report added weight.
First, altcoin breadth has reached an historically ambiguous level. As CoinsProbe previously noted, 87% of altcoins are trading above their 200-day moving average — a reading that has historically preceded both continuation rallies and sharp mean-reversion events depending on whether Bitcoin’s on-chain demand structure is supportive. That is precisely what CryptoQuant’s signal framework resolves: it answers whether current price behavior is demand-driven or technically extended without fundamental backing.
Second, Bitcoin’s buy pressure is at a decision point. As CoinsProbe’s earlier analysis documented, buy-side pressure metrics had reached a level where either continuation or divergence becomes binary — not gradual. CryptoQuant’s signal, released on September 30, 2026, lands precisely at this juncture.
Historical Precedents — What On-Chain Regime Signals Have Produced
The table below maps documented CryptoQuant signal publications to subsequent price behavior across prior cycle inflection points:
| Signal Date | Signal Type | Asset Price at Signal | Outcome (90 Days) |
|---|---|---|---|
| Jan 2023 | Bull Score Flip >60 | $16,500 | +87.9% to $31,000 |
| Oct 2023 | Bull Score Reclaim | $27,000 | +148% to $69,000 (6 months) |
| Aug 2024 | Exchange Netflow Reversal | $56,000 | +25% recovery to $70,000 |
Source: CryptoQuant historical signal archive — on-chain composite readings
The pattern is consistent: CryptoQuant signal publications at structural inflection points have preceded directional moves of 25% to 148% within 90 days across documented instances. None of these outcomes were guaranteed. All required price to confirm what the on-chain data was already showing at the wallet level.
What Confirmation Looks Like — And What Invalidates the Signal
On-chain signals lead price, not lag it. That creates a specific analytical challenge: the signal fires before the move, which means there is always a window where price can invalidate what on-chain data anticipated. For CryptoQuant’s regime-level signals, two price behaviors define the outcome:
Bullish Scenario — Demand Confirmed
If the on-chain signal reflects genuine accumulation — long-term holder wallets absorbing supply, exchange outflows accelerating, realized price bands acting as support — Bitcoin sustaining above its short-term holder realized price (currently estimated near $58,000–$62,000 range based on prior CryptoQuant band data) confirms the bullish regime. Historically, a Bull Score above 60 sustained for more than two weeks has not produced a bear-market relapse in any prior cycle instance. Target behavior in this scenario mirrors the January 2023 precedent: +80% or more over the subsequent five months.
Bearish Scenario — Signal Fails at Resistance
If spot price breaks below the short-term holder realized price band and exchange inflows accelerate simultaneously, the on-chain signal would be classified as a false positive. CryptoQuant’s own methodology acknowledges false positives occur when macro liquidity conditions override on-chain demand structure — specifically during Federal Reserve tightening episodes. A confirmed weekly close below the short-term holder cost basis would nullify the bullish read and reset the composite score toward the bearish regime. As Tom Lee’s macro bull market declaration noted, macro tailwinds are currently supportive — but on-chain data must validate, not assume, that alignment.
The Single Metric to Track in Real Time
CryptoQuant updates its exchange netflow and realized price band data in near real time. The metric that will answer whether this signal resolves bullishly or not is Bitcoin’s exchange netflow on a 7-day rolling basis. Sustained negative netflow (more coins leaving exchanges than entering) for 7 or more consecutive days has preceded every documented bull regime in CryptoQuant’s historical database. That data is publicly visible on CryptoQuant’s dashboard and updates daily.
CryptoQuant’s signal, timestamped September 30, 2026, arrives at a structural crossroads. The on-chain composite framework has a documented track record of identifying regime transitions before price confirms them — with outcomes ranging from +25% to +148% over 90-day windows in prior instances. Whether this instance joins that record depends on one testable condition: Bitcoin sustaining above the short-term holder realized price band on a weekly closing basis. Watch that level. CryptoQuant’s dashboard will answer the question in real time.
Source: x.comFrequently Asked Questions
What is CryptoQuant’s Bull Score and what reading signals a bullish regime?
What is the key price level that confirms or invalidates CryptoQuant’s current signal?
Has CryptoQuant’s on-chain signal methodology produced false positives before?
What is the single on-chain metric traders should watch in real time to confirm this signal?
Source: CryptoQuant · Published by CoinsProbe Markets Desk
The opinions and market insights shared on CoinsProbe represent the views of individual authors based on prevailing market conditions at the time of publication. Cryptocurrency investments carry significant risk and volatility. Readers are encouraged to conduct their own research and seek professional financial advice before making investment decisions. CoinsProbe and its contributors do not accept responsibility for financial losses or decisions made based on published content.
CoinsProbe may publish sponsored articles, affiliate links, or promotional collaborations. All sponsored material is clearly labeled to maintain transparency with our audience. Our editorial decisions remain fully independent, and advertising partnerships do not influence reviews, rankings, or published opinions.
Since 2023, CoinsProbe has delivered reliable insights on cryptocurrency, blockchain, and digital assets. Our content is created by experienced researchers and analysts who follow strict editorial standards focused on accuracy, transparency, and credibility. Every article is carefully reviewed and verified using trusted sources and current market data. We provide unbiased analysis and timely updates covering everything from emerging crypto projects to major industry developments.