
- Bitcoin trades at $82,899 (-2.17%) as Fear & Greed Index surges from 30 to 74 — CryptoQuant analyst @nocoffeenobrain flags sentiment flip
- BTC Dominance at 53.8% in confirmed downtrend since mid-2025 — a break below 52% would confirm accelerating altcoin rotation
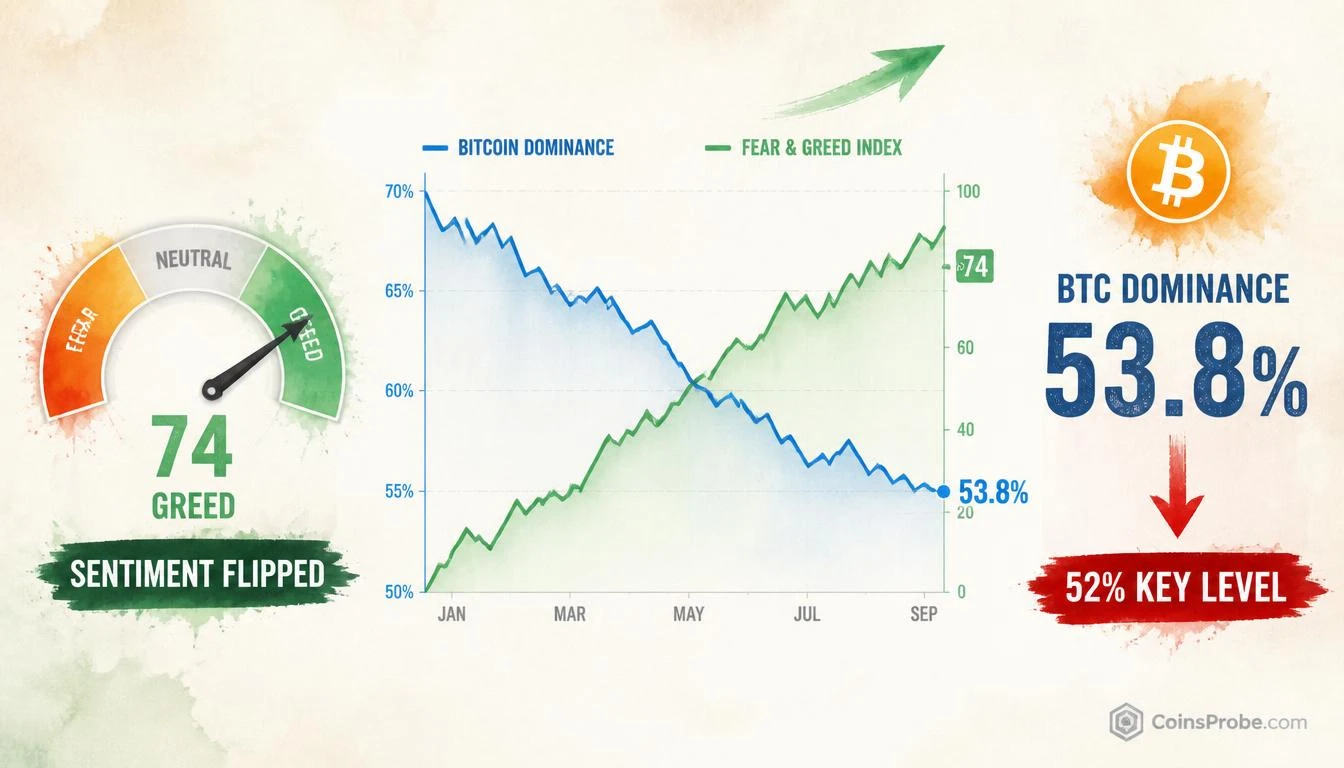
- Dual-signal (rising F&G + falling BTC.D) is the structural fingerprint of altseason capital rotation, per the Jan 2023–Sep 2026 daily chart
- F&G caution zone begins at 85–90 — current 74 reading is in Greed but not yet at historically dangerous extreme
Bitcoin is trading at approximately $82,899 — down 2.17% in 24 hours — yet the macro sentiment picture underneath that red candle tells an entirely different story. The Fear & Greed Index has completed one of its sharpest recoveries in the past three years, vaulting from roughly 30 (Fear) to 74 (Greed) in a compressed window, while Bitcoin dominance has simultaneously broken into a confirmed downtrend. This combination is not noise. It is the textbook setup for capital rotation out of Bitcoin and into altcoins.
The observation comes directly from CryptoQuant analyst @nocoffeenobrain, posted via @cryptoquant_com: “F&G has moved from around 30 to 74 in a relatively short period, while BTC.D has continued to trend lower.” The framing is deliberate — two independent signals, moving in lockstep, pointing at the same structural conclusion.
Signal 1 — Fear & Greed: From 30 to 74 in a Compressed Window
The Crypto Fear & Greed Index aggregates seven weighted data inputs — volatility (25%), market momentum/volume (25%), social media sentiment (15%), surveys (15%), Bitcoin dominance (10%), and Google Trends (10%) — into a single 0–100 composite reading. A reading of 0 represents Extreme Fear; 100 represents Extreme Greed. It is not a price predictor in isolation. What matters is the velocity and direction of change.
At approximately 30, the index was in Fear territory — a level historically associated with capitulation phases and distribution exhaustion. The current reading of 74 places it firmly in Greed. That 44-point move is significant not because 74 is a ceiling, but because of what the transition confirms: the market’s collective risk appetite has reversed sharply. Institutional and retail participants are no longer de-risking — they are actively deploying.
Historically, rapid F&G recoveries from Fear into Greed — particularly ones that cross the 60-threshold within weeks — have corresponded with the early-to-mid phase of altcoin rallies, not their peaks. The caution flag appears when the index approaches 85–90 (Extreme Greed), which is when reversal risk becomes statistically elevated. At 74, the market is in greed but has not yet reached the historically dangerous extreme.
Signal 2 — BTC Dominance: Confirmed Downtrend Since Mid-2025
Bitcoin dominance (BTC.D) measures Bitcoin’s share of total crypto market capitalization. When BTC.D falls while overall market cap is stable or rising, capital is mathematically rotating into altcoins. This is not interpretation — it is arithmetic.
The dual-indicator chart shared by @nocoffeenobrain via @cryptoquant_com, covering daily data from January 2023 through September 2026, shows BTC.D currently at 53.8% and in a confirmed declining slope since mid-2025. The previous range ceiling was the 60–62% zone — a level that served as resistance and has now flipped to overhead supply. BTC.D is not consolidating at 53.8%. It is trending.
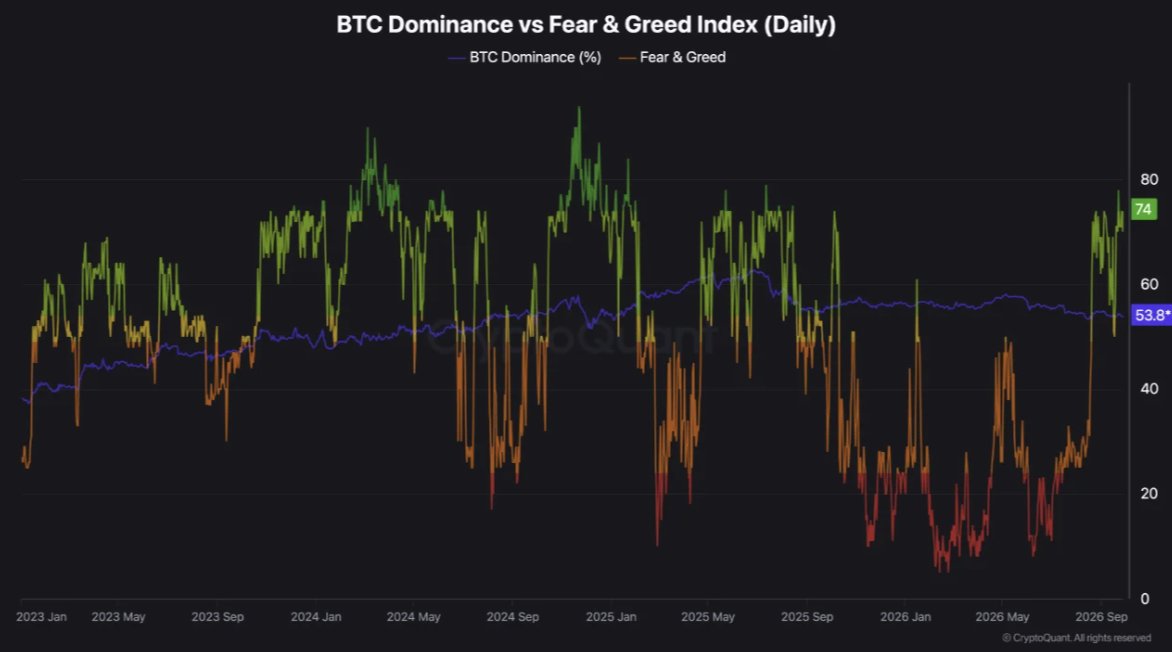
The critical threshold identified in the chart analysis is the 52% level. A sustained break below 52% would confirm accelerating altcoin rotation — the kind of move that historically has driven double and triple-digit returns across mid- and large-cap altcoins within the same cycle window. BTC.D at 53.8% is 1.8 percentage points from that confirmation trigger.
Why These Two Signals Together Matter More Than Either Alone
Falling BTC dominance in isolation can occur during broad market selloffs — when altcoins simply fall harder than Bitcoin, temporarily reducing BTC.D. That is not a rotation signal. It is a fear signal. The differentiator here is the simultaneous rise in the Fear & Greed Index to 74. When risk appetite is rising and BTC dominance is falling, the mechanism is specific: investors are moving up the risk curve deliberately, allocating to higher-beta assets. This is the structural definition of altseason rotation.
The combination maps to a well-documented market pattern. During the 2023–2024 cycle, every sustained altcoin rally of consequence was preceded by exactly this dual-signal configuration — F&G recovering above 60 while BTC.D trended below its 30-day moving average. The current reading represents the most complete version of that configuration since mid-2024. For readers tracking broader altcoin opportunities, the $864M Ethereum whale accumulation documented recently adds a third corroborating data point to this rotation thesis.
What the Data Confirms — and Where the Risk Sits
This is not a directional trade signal. It is a regime identification. The data confirms that sentiment has already shifted — the F&G move from 30 to 74 is a completed event, not a forecast. BTC.D’s downtrend is a confirmed slope, not a projected one. What remains unconfirmed is the magnitude and duration of the rotation.
The risk embedded in a F&G reading of 74 is real. Historically, sharp sentiment recoveries can reverse just as quickly as they formed, particularly when macro conditions deteriorate. A return below the 55–60 F&G zone would signal sentiment normalization — not necessarily a crash, but a pause in the rotation trade. Equally, if BTC.D stabilizes and reclaims 55%, the altseason rotation thesis loses its structural foundation.
| Indicator | Current Reading | Signal |
|---|---|---|
| Fear & Greed Index | 74 (Greed) | Sentiment recovered from Fear — rotation active |
| BTC Dominance | 53.8% | Confirmed downtrend — capital leaving BTC |
| BTC.D Key Break Level | 52.0% | Below = accelerating altcoin rotation confirmed |
| F&G Caution Zone | 85–90 | Extreme Greed — historically precedes reversals |
Source: @nocoffeenobrain via @cryptoquant_com (X)
Bullish Scenario
BTC.D breaks and closes below 52% while F&G holds above 65. This confirms accelerating capital rotation into altcoins. Mid-to-large cap altcoins with established narratives — ETH, SOL, and sector leaders — historically produce the strongest returns in this phase. The QNT multi-year wedge breakout already in motion is one example of what sustained BTC.D compression can unlock.
Bearish Scenario
F&G retreats below 55 while BTC.D reclaims 56%. This would signal that the rotation was a short-lived sentiment spike rather than a structural regime change. Bitcoin’s current $82,899 price under this scenario likely consolidates further as risk appetite contracts and capital flows back toward BTC safety.
The dual-signal read from @nocoffeenobrain is one of the cleaner regime identification calls of this cycle — not because it tells you which altcoin to buy, but because it tells you what kind of market you are in. Fear & Greed at 74, recovered from 30, with BTC dominance at 53.8% in a confirmed downtrend, is the structural fingerprint of active altseason rotation. The 52% BTC.D level is the confirmation trigger that separates an early rotation from a full-cycle altseason. Watch that level. When it breaks on daily close with conviction, the rotation trade moves from probable to confirmed.
Frequently Asked Questions
What does a Fear & Greed reading of 74 mean for altcoins right now?
At what BTC dominance level does altseason officially confirm?
Why is falling BTC dominance only a rotation signal when paired with rising F&G — not in isolation?
What would invalidate the altseason rotation thesis?
Source: CryptoQuant · Published by CoinsProbe Markets Desk
The opinions and market insights shared on CoinsProbe represent the views of individual authors based on prevailing market conditions at the time of publication. Cryptocurrency investments carry significant risk and volatility. Readers are encouraged to conduct their own research and seek professional financial advice before making investment decisions. CoinsProbe and its contributors do not accept responsibility for financial losses or decisions made based on published content.
CoinsProbe may publish sponsored articles, affiliate links, or promotional collaborations. All sponsored material is clearly labeled to maintain transparency with our audience. Our editorial decisions remain fully independent, and advertising partnerships do not influence reviews, rankings, or published opinions.
Since 2023, CoinsProbe has delivered reliable insights on cryptocurrency, blockchain, and digital assets. Our content is created by experienced researchers and analysts who follow strict editorial standards focused on accuracy, transparency, and credibility. Every article is carefully reviewed and verified using trusted sources and current market data. We provide unbiased analysis and timely updates covering everything from emerging crypto projects to major industry developments.