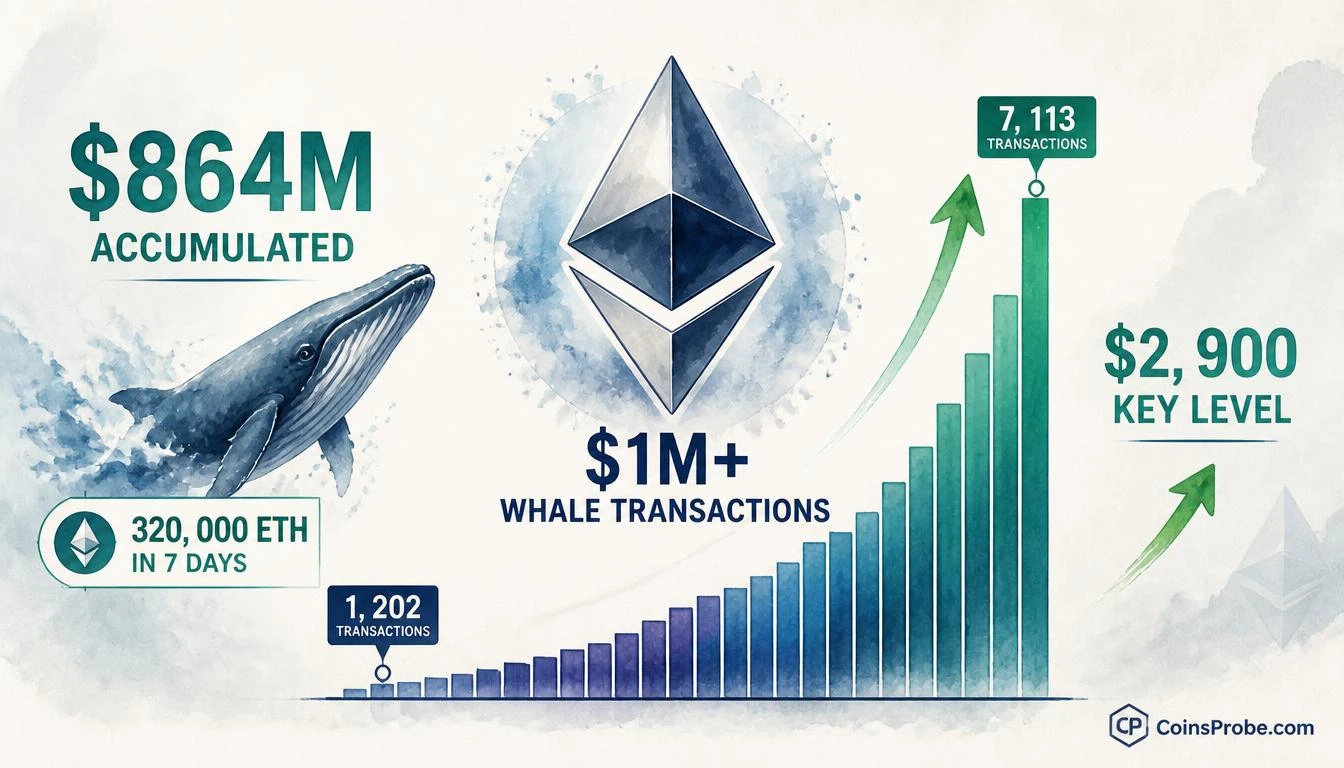

- ETH is trading at $2,702.83 (+0.59% 24h) as whale transactions worth $1M+ surge 500% in one week
- Large holders added 320,000 ETH — worth $864M — in seven days, per @alicharts citing Santiment data
- Daily $1M+ transaction count spiked from 1,202 to 7,113; sustained reading above 3,000 keeps accumulation thesis intact
- Key level to watch: $2,900 daily close — confirmation or rejection of the whale accumulation signal
Ethereum is trading at $2,702.83 — up 0.59% in the past 24 hours — with a market cap of $329.97 billion. Beneath that relatively quiet price action, one of the most aggressive whale accumulation events of this cycle has already printed.
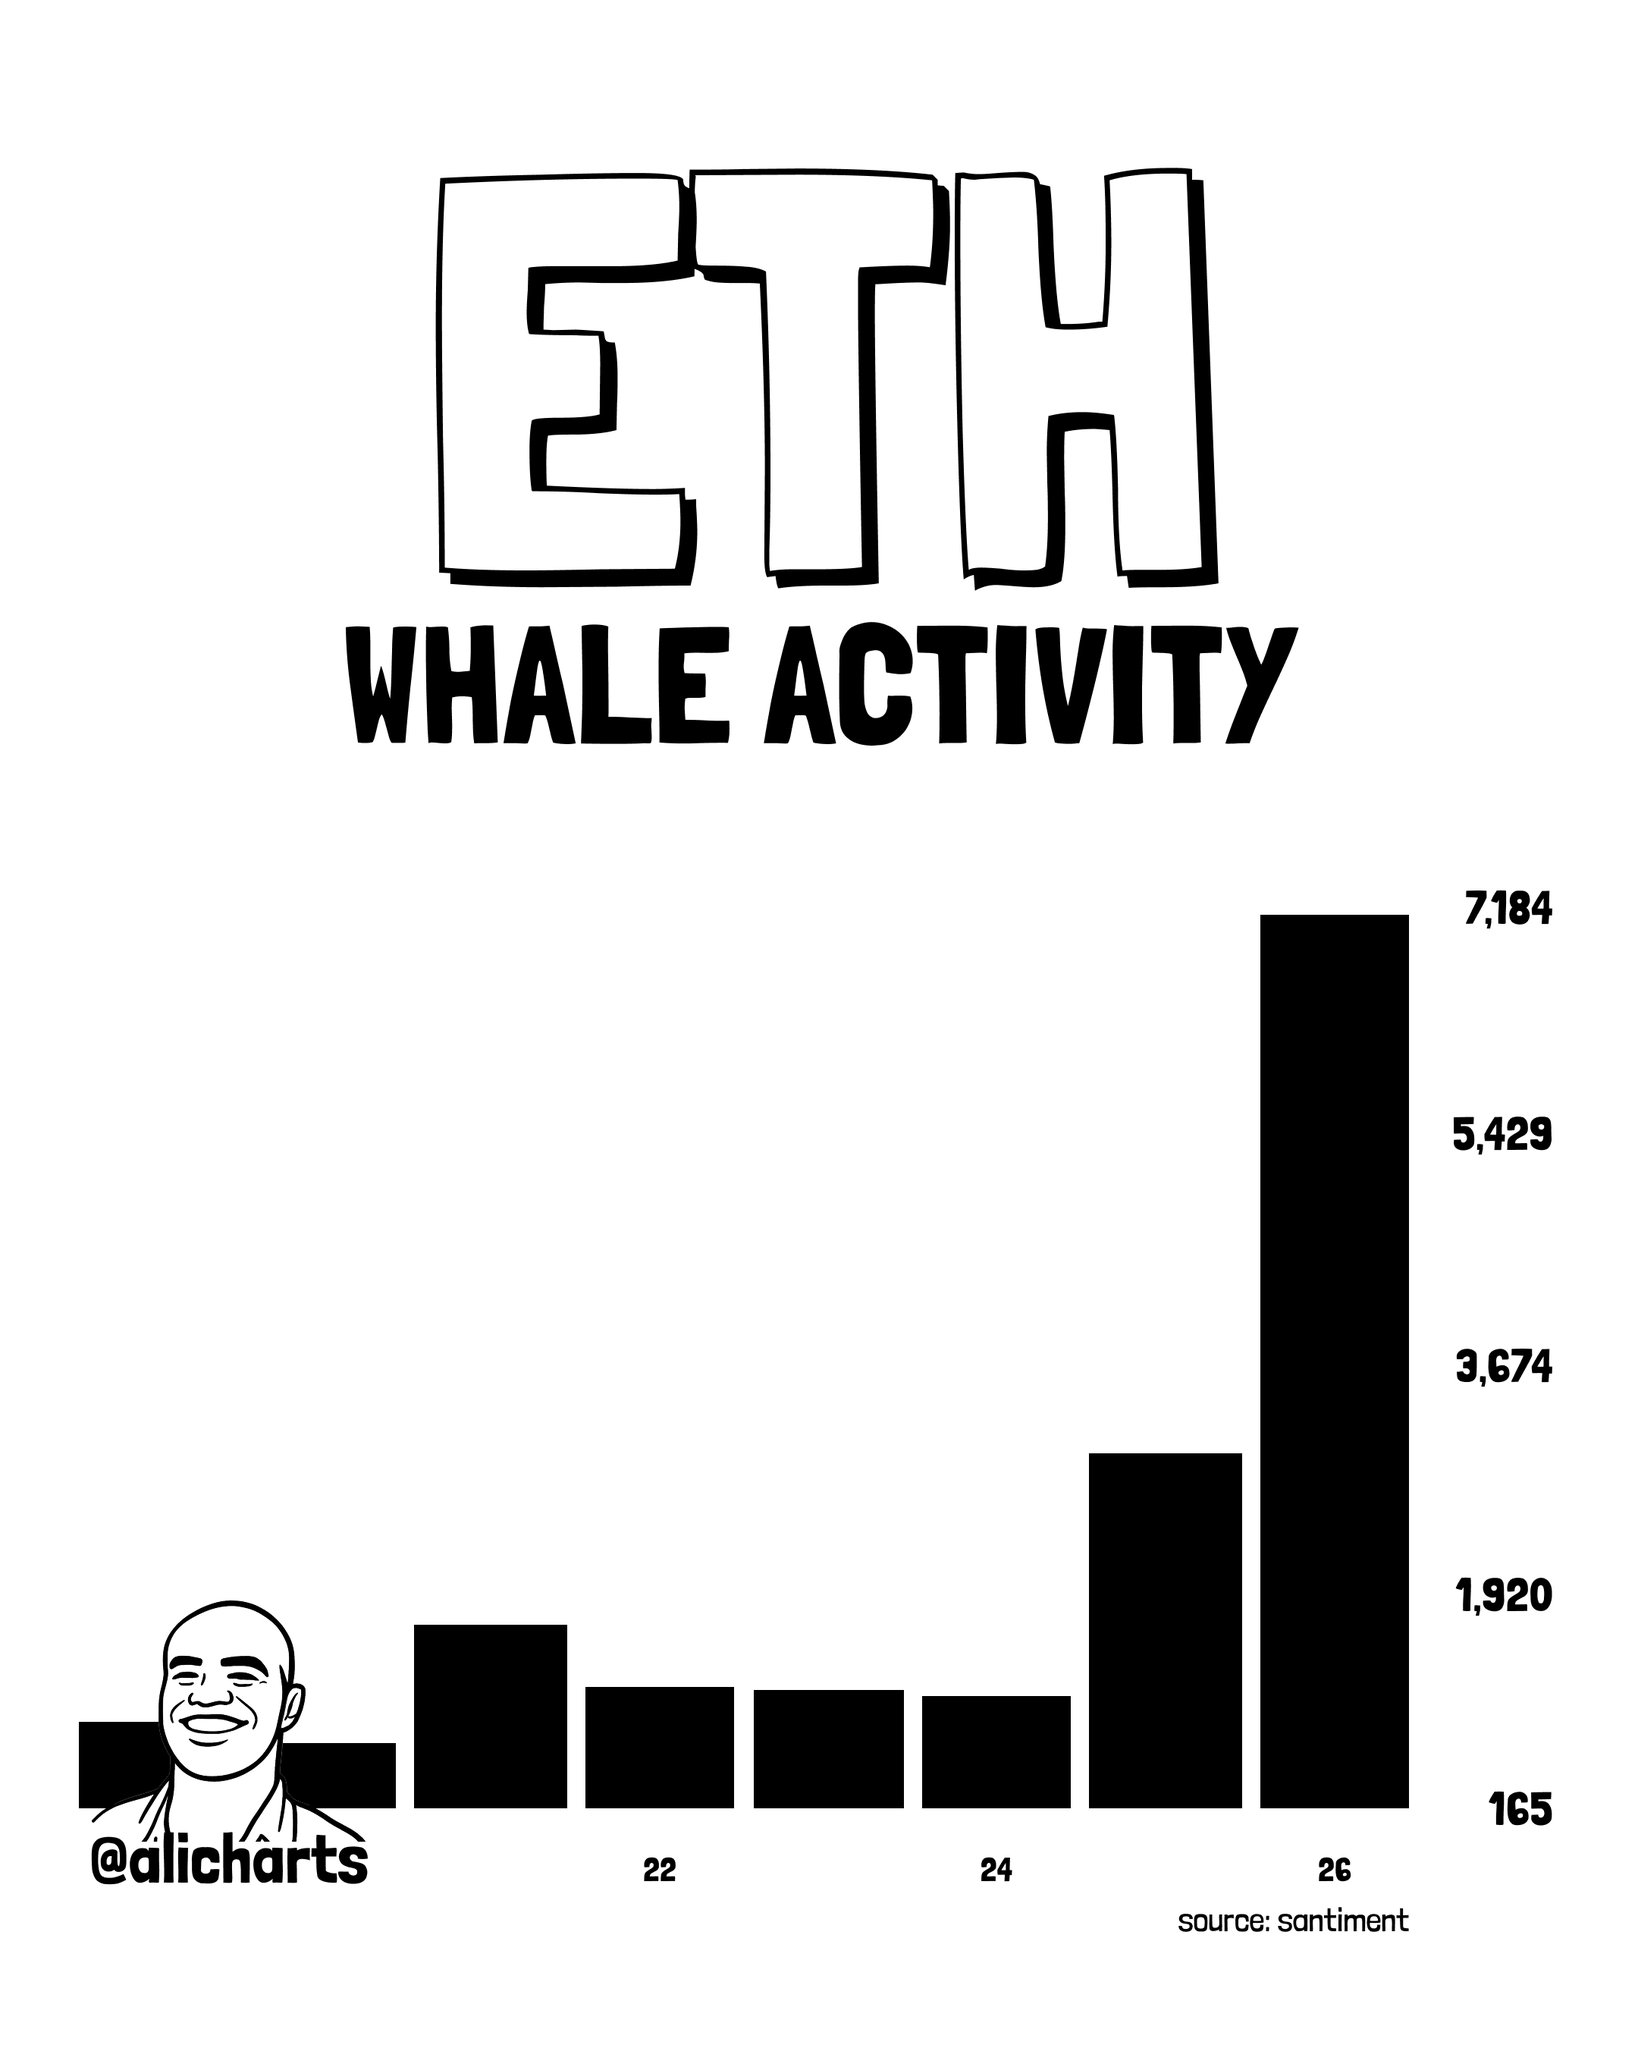
Crypto analyst Ali Martinez (@alicharts) flagged the move in a five-part thread, calling it “Ethereum: Final Hurdle Before Bull Run.” The data behind that declaration is specific: large-wallet transactions on the Ethereum network — defined as transfers exceeding $1 million — surged nearly 500% in a single week, rising from 1,202 to 7,113 according to Santiment data cited in the thread.
The Whale Transaction Spike — What the Data Actually Shows
The Santiment chart shared by Martinez shows a parabolic surge on the final bar of the 7-day window. From approximately days 20–24, the daily count of $1M+ transactions ranged between 165 and 1,920 — elevated but range-bound. On day 25, that figure jumped to 3,674. By day 26, it reached 7,184 — the session peak. The weekly aggregate: a move from 1,202 to 7,113 transactions.
This is a confirmed, historical data point — not a forecast. The 500% surge has already occurred. What analysts are now parsing is what it means for price.
The answer requires separating transaction volume from transaction direction. High $1M+ activity confirms one thing with certainty: large holders are moving capital at an unusually elevated rate. It does not, by itself, confirm whether that capital is being accumulated or distributed. That distinction matters — and Martinez addresses it directly in the thread’s next slide.
320,000 ETH Added — The Accumulation Confirmation
The whale transaction surge is not ambiguous in this instance. Martinez identifies it as translating into net accumulation: large holders collectively added 320,000 ETH over the past week, worth approximately $864 million at current prices. This is the signal that elevates the whale transaction data from noise to a directional statement.
To put the scale in context: 320,000 ETH at $2,702.83 represents roughly 0.27% of Ethereum’s total circulating supply absorbed by large wallets in seven days. That rate of accumulation, sustained, would represent material supply contraction at current price levels.
Similar patterns of compressed whale accumulation preceding price breakouts have been documented across prior Ethereum cycles. In Q4 2020, a comparable spike in large-wallet inflows preceded ETH’s move from approximately $400 to above $1,400 within 60 days. In Q1 2023, renewed institutional accumulation patterns coincided with ETH’s recovery from the $1,200 zone toward $2,100. The current reading arrives at a structurally different moment — ETH is already trading above $2,700 — making the directional implication of sustained accumulation at this level particularly significant.
The “Final Hurdle” — What Martinez Is Watching
Martinez frames this not as a breakout confirmation but as a pre-breakout setup. The thread’s title — “Final Hurdle Before Bull Run” — implies a specific resistance structure still overhead. While the full thread elaborates across five parts, the core thesis rests on the accumulated evidence: whale transactions at 5x their baseline rate, $864 million in net large-wallet buying, and a supply dynamic that is tightening at current price.
Whale accumulation data from Santiment and similar platforms has historically served as a leading indicator rather than a concurrent one — large holders tend to position ahead of retail participation, not alongside it. The 7,113 transaction reading is the highest weekly figure visible in the chart window, suggesting this is not routine portfolio rebalancing but deliberate directional positioning.
For context on similar large-wallet conviction plays, see how Dogecoin whales accumulated $112M in 96 hours into key resistance and how Chainlink whales added 2.5M LINK in 10 days as network growth accelerated — both preceded significant price responses.
Bullish Scenario
If the $864M accumulation represents genuine net long positioning by large holders, sustained whale buying at this rate — combined with ETH holding above $2,600 — sets up a technical breakout through overhead supply. Prior cycles suggest ETH moves of +80% to +200% have followed comparable accumulation spikes when accompanied by price holding key support zones. The immediate target zone in that scenario is the $3,400–$3,800 range, representing the next major liquidity cluster above current price.
Bearish Scenario
Whale transaction spikes are non-directional at the mechanical level — distribution events also produce elevated $1M+ transaction counts. If the 320,000 ETH figure includes large sell orders being absorbed rather than pure accumulation, and ETH loses $2,500 on a daily closing basis, the whale activity reading shifts from accumulation signal to distribution warning. That scenario opens a retest of the $2,200–$2,300 support band.
The Level That Resolves the Thesis
The cleanest resolution to the ambiguity is price confirmation. $864 million in whale accumulation over seven days is a significant data point — but it becomes a tradeable signal only when price cooperates. A sustained daily close above $2,900 would confirm that the accumulation is being met with net buying pressure, not distribution into strength. Failure to clear that level within the next two to three sessions while whale activity normalizes would suggest the $864M figure represented rotation rather than fresh long positioning.
The Santiment data tracking $1M+ transactions updates in real time. That metric — not price alone — is the primary variable to monitor. If daily transaction counts remain elevated above 3,000, the accumulation thesis stays intact. A reversion toward the 1,200-transaction baseline would signal that the whale activity spike was episodic rather than structural.
The data is unambiguous on one point: 7,113 transactions of $1M or more in a single week, translating into 320,000 ETH net accumulated, is not background noise. Whether it becomes the catalyst that clears the final hurdle Martinez identifies will be visible at $2,900 on the daily chart — and in the Santiment $1M+ transaction feed in the sessions that follow.
Frequently Asked Questions
What does the 500% surge in Ethereum whale transactions actually mean?
Is the $864M ETH accumulation confirmed as buying, not selling?
What level must Ethereum hold for the whale accumulation thesis to remain valid?
How does 320,000 ETH accumulated in one week compare to Ethereum’s total supply?
Source: Ali Charts · Published by CoinsProbe Markets Desk
The opinions and market insights shared on CoinsProbe represent the views of individual authors based on prevailing market conditions at the time of publication. Cryptocurrency investments carry significant risk and volatility. Readers are encouraged to conduct their own research and seek professional financial advice before making investment decisions. CoinsProbe and its contributors do not accept responsibility for financial losses or decisions made based on published content.
CoinsProbe may publish sponsored articles, affiliate links, or promotional collaborations. All sponsored material is clearly labeled to maintain transparency with our audience. Our editorial decisions remain fully independent, and advertising partnerships do not influence reviews, rankings, or published opinions.
Since 2023, CoinsProbe has delivered reliable insights on cryptocurrency, blockchain, and digital assets. Our content is created by experienced researchers and analysts who follow strict editorial standards focused on accuracy, transparency, and credibility. Every article is carefully reviewed and verified using trusted sources and current market data. We provide unbiased analysis and timely updates covering everything from emerging crypto projects to major industry developments.