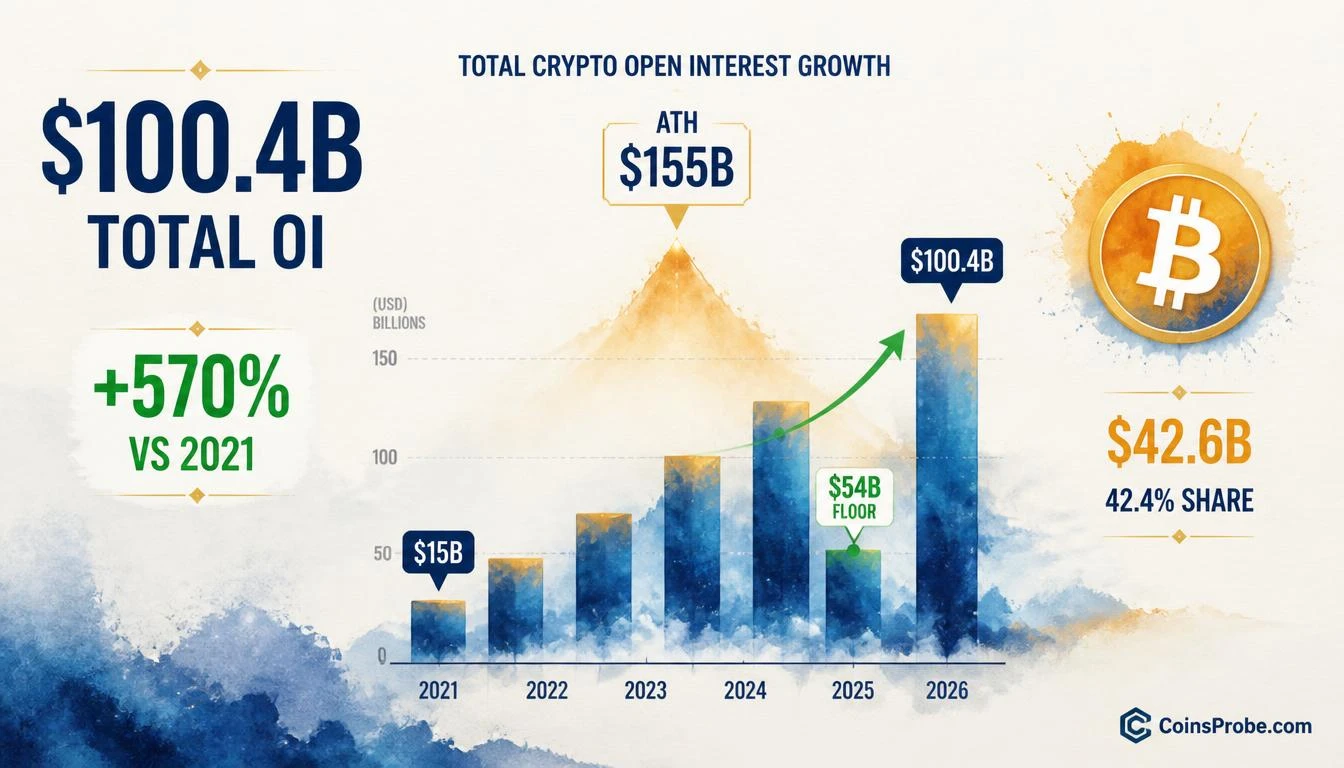

- Total crypto open interest at $100.4B — up 570% from $15B in 2021, per Alphractal's five-year OI timeline
- Bitcoin holds $42.6B of total OI, representing a 42.4% share of the entire derivatives market
- Cycle ATH was ~$155B; post-deleveraging low hit ~$54B before recovering to $120B — current $100.4B sits between both levels
- January 2024 spot Bitcoin ETF launch identified as the structural trigger that drove OI from ~$20B to $155B
Total crypto open interest stands at $100.4 billion as of October 20, 2026 — a figure that is +570% above the $15 billion recorded across the entire derivatives market in 2021. That single data point, published by on-chain analytics platform Alphractal, reframes every leverage conversation in this market. This is not a short-term positioning story. It is five years of compounding institutional exposure, now sitting at levels that make the 2021 cycle look structurally primitive.
Alphractal’s published five-year OI timeline, shared on October 19, 2026, traces the full arc: from roughly $15B in 2021, to a $20B peak and subsequent bear-market contraction in 2022, through the January 2024 spot Bitcoin ETF launch that acted as a structural trigger for the next expansion wave, all the way to the all-time high of approximately $155B. The market then deleveraged sharply to a low near $54B before recovering to $120B. Today’s $100.4B reading sits below that recovery peak — a position that carries distinct implications depending on whether the market is contracting from $120B or rebuilding from $54B.
Five Years of OI — The Full Timeline
The structural shift in crypto derivatives is best understood through the timeline Alphractal charts. In 2021, $15B in total open interest represented a market that was retail-led and spot-driven, with derivatives functioning as a secondary layer. The 2022 bear market produced a peak near $20B before the collapse — a deleveraging event that wiped out overleveraged positions across centralized venues. What followed was a multi-year rebuild that did not simply recover the prior high; it multiplied it by more than seven times.
| Period | Total Crypto OI | Key Driver |
|---|---|---|
| 2021 | ~$15B | Retail-led spot and perps expansion |
| 2022 Peak | ~$20B | Pre-bear-market leverage peak |
| Jan 2024 | Expansion begins | Spot Bitcoin ETF approval |
| 2025 | >$91B | Institutional derivatives access |
| Cycle ATH | ~$155B | Peak leverage accumulation |
| Deleveraging Low | ~$54B | Forced liquidation event |
| Recovery | $120B | Rebuild phase |
| Current (Oct 20, 2026) | $100.4B | Post-recovery consolidation |
Source: Alphractal (X)
The January 2024 spot ETF launch is the inflection point the data makes unmistakable. Before it, OI was expanding organically through retail perpetuals on offshore venues. After it, institutional capital gained regulated on-ramp access to Bitcoin exposure — and the derivatives market followed. By 2025, total OI had crossed $91B. The cycle high of $155B arrived with the concentrated leverage that historically precedes major deleveraging events.
Bitcoin’s Share: $42.6B at 42.4% of Total
Of the current $100.4B in total crypto open interest, Bitcoin accounts for $42.6B — representing a 42.4% share of all derivatives exposure across the market. This ratio matters for two reasons. First, it reflects Bitcoin’s continued dominance as the primary vehicle for institutional derivatives positioning, consistent with its role as the most liquid underlying asset. Second, a 42.4% share means the remaining 57.6% — roughly $57.8B — is distributed across altcoins, a figure that would have been structurally impossible in 2021 when the entire market was at $15B.
The concentration of altcoin derivatives exposure at this scale is a direct product of the infrastructure build-out that followed the ETF approval cycle. Perpetual futures markets for mid- and large-cap altcoins deepened materially through 2024 and 2025, creating the conditions for total OI to reach $155B at peak. For context on how Bitcoin’s on-chain holder behavior has evolved alongside this derivatives expansion, CoinsProbe’s analysis of only 4.4% of BTC’s 6–12 month holders selling provides relevant structural backdrop.
Why High OI Is a Double-Edged Structure
Alphractal’s analysis explicitly flags the risks embedded in elevated open interest. The mechanism is straightforward: higher aggregate OI concentrates more leveraged positions at any given price level. When price moves rapidly against those positions — whether up or down — forced liquidations compound the move. The result is the cascade dynamic that characterized the drop from $155B to $54B: not a gradual deleveraging, but a rapid compression driven by automated liquidation engines clearing overleveraged books across venues simultaneously.
At $100.4B, the market sits at a level that is elevated relative to all prior cycles but below the $120B recovery peak and well below the $155B all-time high. Whether this constitutes a structurally safer level or simply a mid-deleveraging pause depends on demand composition — whether the current $100.4B is dominated by hedged institutional positions or concentrated directional retail leverage. Alphractal’s data does not disaggregate by counterparty type, but the Bitcoin share ratio of 42.4% provides a partial proxy: BTC-dominated OI tends to reflect more institutional hedging behavior than altcoin-heavy OI.
This structural tension — between the market’s deepened capacity for leverage and its demonstrated vulnerability to cascade liquidations — is the core analytical takeaway from the five-year OI history. The derivatives market at $100.4B is not the same instrument it was at $15B. It is larger, more institutionally exposed, and capable of faster, more violent re-pricing events in either direction. For more on how technical conditions currently frame Bitcoin’s directional setup, CoinsProbe’s coverage of Bitcoin’s three recovery conditions is directly relevant.
The Structural Implication: Derivatives Market Maturity and Risk
A +570% expansion in open interest over five years, anchored by a January 2024 regulatory catalyst and an all-time high of $155B, represents the maturation of crypto as a derivatives asset class — not a transient speculative spike. The infrastructure that supports $100.4B in OI today includes regulated futures on CME, spot ETF-linked hedging flows, and deep perpetuals markets across dozens of assets. This infrastructure did not exist at the 2021 $15B baseline.
The risk corollary is proportional. A market capable of supporting $155B in open interest is also a market capable of liquidating $100B in positions in a compressed timeframe, as the $155B-to-$54B deleveraging demonstrated. At $100.4B, the market is operating in the zone where leverage concentration is meaningful but not at cycle-peak extremes. The direction of the next $20B move in OI — toward $120B or back toward $80B — will be a leading indicator of whether the cycle’s leverage expansion phase is resuming or terminating. For historical context on how accumulation signals have preceded prior market turns, see CoinsProbe’s analysis of momentum exhaustion signals across crypto assets.
Bullish Scenario
If total OI recovers from $100.4B back toward the $120B recovery peak, it would signal that institutional leverage demand is resuming following the post-ATH deleveraging — consistent with a market that has absorbed the $155B-to-$54B liquidation event and is rebuilding exposure. Bitcoin’s $42.6B share holding or expanding above 42.4% during any OI recovery would suggest the rebuild is institutionally anchored rather than retail-driven, reducing cascade risk.
Bearish Scenario
A renewed decline in total OI from the current $100.4B back toward the $54B deleveraging low would indicate that the $120B recovery was a relief rally within a larger deleveraging cycle rather than a structural reset. The $54B level represents the established liquidation floor; a retest would require a significant price shock or a sustained reduction in leveraged demand across both Bitcoin and altcoin perpetual markets.
Total crypto open interest at $100.4B — +570% above 2021 levels, $54.6B below the all-time high, and $19.6B below the post-deleveraging recovery peak — sits at a structural crossroads. Bitcoin’s $42.6B share (42.4% of total) reflects the institutional composition of the current market. The January 2024 ETF catalyst that drove OI from $20B to $155B is now embedded infrastructure, not a temporary effect. Alphractal’s five-year data makes the key monitoring metric explicit: whether OI moves toward $120B or retreats toward $80B will determine whether the leverage cycle is recovering or extending its contraction. Watch the $100.4B level — a sustained decline below $90B would reopen the path toward the $54B deleveraging floor.
Source: x.comFrequently Asked Questions
What does $100.4B in crypto open interest actually mean for market risk?
Why is the January 2024 spot Bitcoin ETF launch significant for open interest growth?
Is Bitcoin’s 42.4% share of total open interest unusually high or low?
What level of open interest would signal that the deleveraging cycle is resuming?
Source: Alphractal · Published by CoinsProbe Markets Desk
The opinions and market insights shared on CoinsProbe represent the views of individual authors based on prevailing market conditions at the time of publication. Cryptocurrency investments carry significant risk and volatility. Readers are encouraged to conduct their own research and seek professional financial advice before making investment decisions. CoinsProbe and its contributors do not accept responsibility for financial losses or decisions made based on published content.
CoinsProbe may publish sponsored articles, affiliate links, or promotional collaborations. All sponsored material is clearly labeled to maintain transparency with our audience. Our editorial decisions remain fully independent, and advertising partnerships do not influence reviews, rankings, or published opinions.
Since 2023, CoinsProbe has delivered reliable insights on cryptocurrency, blockchain, and digital assets. Our content is created by experienced researchers and analysts who follow strict editorial standards focused on accuracy, transparency, and credibility. Every article is carefully reviewed and verified using trusted sources and current market data. We provide unbiased analysis and timely updates covering everything from emerging crypto projects to major industry developments.