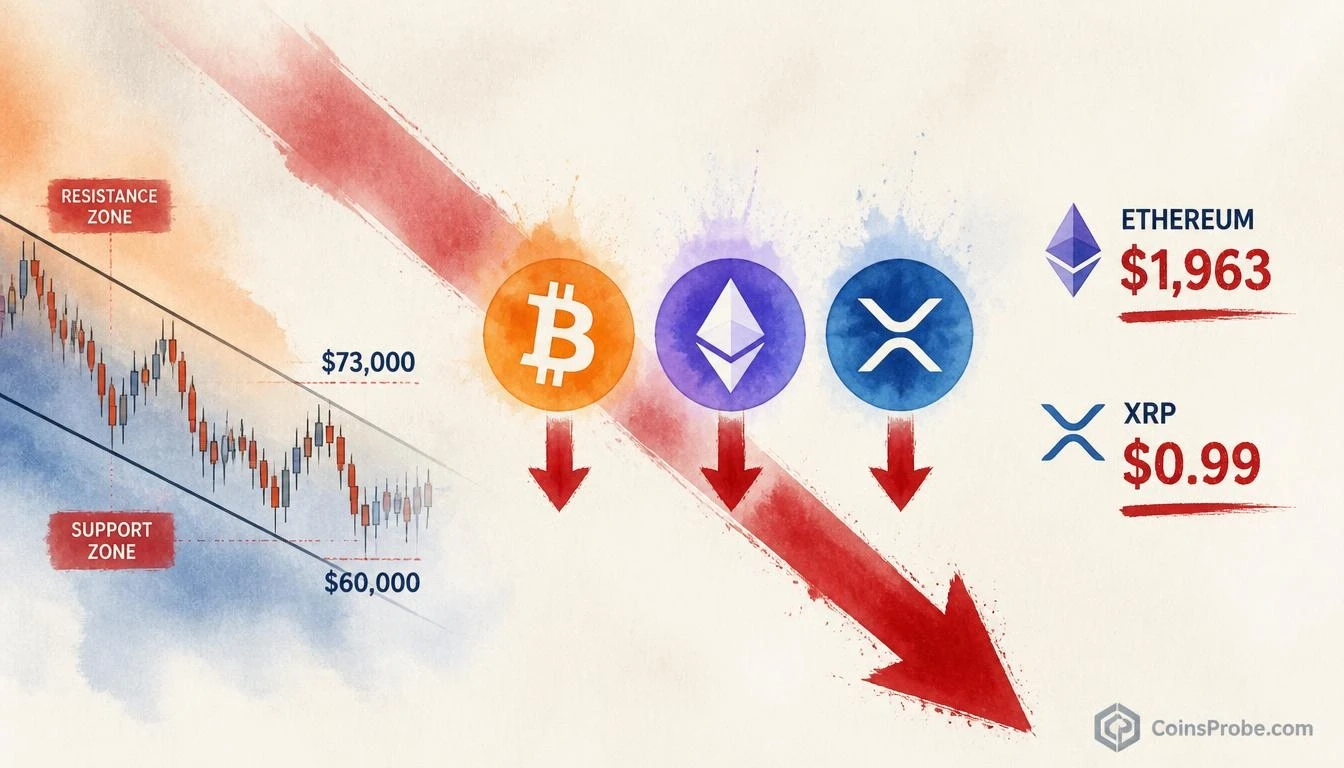

- Bitcoin is at $74,744 (-1.49%) with mid-range channel support at $73,000 and lower boundary at $60,000
- Ethereum lost $2,385 pattern support — analyst targets $1,963 as next structural level on daily chart
- XRP's channel mid-range already broken — lower boundary near $0.99 is now the operative downside target
Bitcoin is trading at approximately $74,744 — down 1.49% in the past 24 hours — with a market cap of $1.50 trillion. The broader crypto market is under sustained pressure, and one analyst has now published specific downside targets for the three largest liquid assets: Bitcoin, Ethereum, and XRP. These are not speculative guesses. They are chart-derived structural levels where buyer defense will be tested if the selling continues.
An analyst who has been tracking this multi-day decline since a five-part thread published on November 7, 2026 followed up on November 9 with a consolidated map of where Bitcoin, Ethereum, and XRP could find their next meaningful test. The core message is disciplined: these are zones where price action will determine whether buyers step in — not guaranteed floors.
Bitcoin — 3-Day Channel Defines the Floor
On the 3-day chart, Bitcoin has been trading within a defined channel structure. The mid-range support sits near $73,000. If that level fails to attract buyers, the lower boundary of the channel falls near $60,000. Bitcoin has already seen significant liquidation pressure in recent sessions — as covered previously, Bitcoin dropped to $73.4K as over $1 billion was liquidated in a single session driven by macro catalysts. The current price of $74,744 sits just above that mid-range structural support at $73,000, making this level the immediate line to defend. A sustained close beneath $73,000 on the 3-day chart would shift the analytical focus toward the $60,000 lower channel boundary — a further 18% decline from the mid-range level.
Ethereum — Right-Angled Ascending Broadening Pattern Breaks
Ethereum’s setup carries the most technical specificity. On the daily chart, ETH had been trading within a right-angled ascending broadening pattern — a structure characterized by a flat upper resistance and a rising lower trendline. The critical support in that pattern was $2,385. According to the analyst’s thread, Ethereum has already lost that $2,385 level. With that support broken, the pattern projects a downside target near $1,963. That level represents the next meaningful structural zone — not an arbitrary number, but the lower boundary implied by the broadening pattern’s geometry following the $2,385 breakdown.
XRP — Channel Mid-Range Gone, Lower Boundary at $0.99
XRP’s picture mirrors Bitcoin’s channel structure but at a more advanced breakdown stage. The mid-range of XRP’s channel has already been broken. With that level gone, the lower channel boundary near $0.99 becomes the operative downside target. XRP at $0.99 would represent a return to sub-$1.00 territory — a psychologically significant level that also aligns with the structural floor of the channel the analyst has mapped. For context, the analyst’s broader November 7 thread flagged potential dumps across the market before they materialized, lending credibility to this channel-based framework. Bitcoin recent buyers are already underwater, with $79.3K now acting as overhead resistance — context that reinforces the bearish case for the broader market.
What These Levels Are — And What They Are Not
The analyst is explicit: these are zones where buyer defense will be tested. Price action at $73,000 for BTC, $1,963 for ETH, and $0.99 for XRP will determine whether demand emerges at structural support — or whether selling pressure overwhelms those levels and extends the decline. This is a framework for watching, not a prediction of where the bottom will be. Other assets are flashing breakdown signals in parallel — HYPE, ONDO, and QNT have all printed breakdown signals at key levels, suggesting this is a broad structural deterioration rather than an isolated move in any single asset.
The three-asset map presents a consistent picture: channel and pattern structures that held for weeks are now being tested or have already broken. Ethereum’s $2,385 is already gone. XRP’s mid-range is already gone. Bitcoin’s $73,000 is the next immediate test. Whether these lower targets at $60,000, $1,963, and $0.99 are reached depends entirely on whether buyers emerge at current levels or capitulate through them.
Watch $73,000 on Bitcoin — a sustained 3-day close beneath that level removes the mid-range structure and opens the path toward $60,000.
Frequently Asked Questions
What is Bitcoin’s downside target if $73,000 breaks?
Why is $2,385 important for Ethereum?
Has XRP already broken down, and what does $0.99 represent?
Are these analyst-mapped levels guaranteed price bottoms?
Source: Ali Charts · Published by CoinsProbe Markets Desk
The opinions and market insights shared on CoinsProbe represent the views of individual authors based on prevailing market conditions at the time of publication. Cryptocurrency investments carry significant risk and volatility. Readers are encouraged to conduct their own research and seek professional financial advice before making investment decisions. CoinsProbe and its contributors do not accept responsibility for financial losses or decisions made based on published content.
CoinsProbe may publish sponsored articles, affiliate links, or promotional collaborations. All sponsored material is clearly labeled to maintain transparency with our audience. Our editorial decisions remain fully independent, and advertising partnerships do not influence reviews, rankings, or published opinions.
Since 2023, CoinsProbe has delivered reliable insights on cryptocurrency, blockchain, and digital assets. Our content is created by experienced researchers and analysts who follow strict editorial standards focused on accuracy, transparency, and credibility. Every article is carefully reviewed and verified using trusted sources and current market data. We provide unbiased analysis and timely updates covering everything from emerging crypto projects to major industry developments.