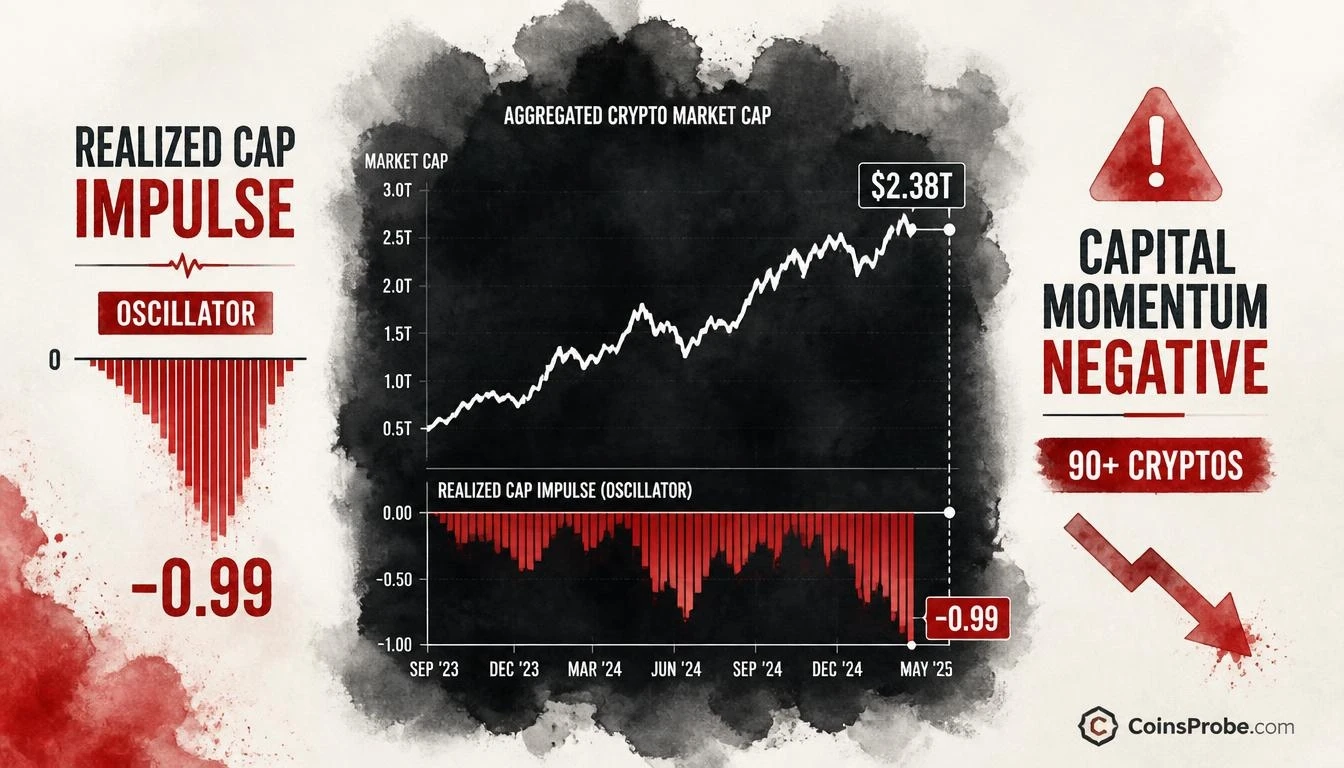

- Total crypto market cap sits at $2.38T while Alphractal's Realized Cap Impulse drops to −0.99 — a negative capital momentum reading
- The indicator aggregates realized capitalization across 90+ cryptocurrencies; a failed positive recovery preceded the current relapse below zero
- Bitcoin is down 6.5% in 24 hours and 21% over six weeks, aligning with the negative signal per Alphractal
- Analyst warns against bull cycle calls without sustained Realized Cap Impulse recovery above zero
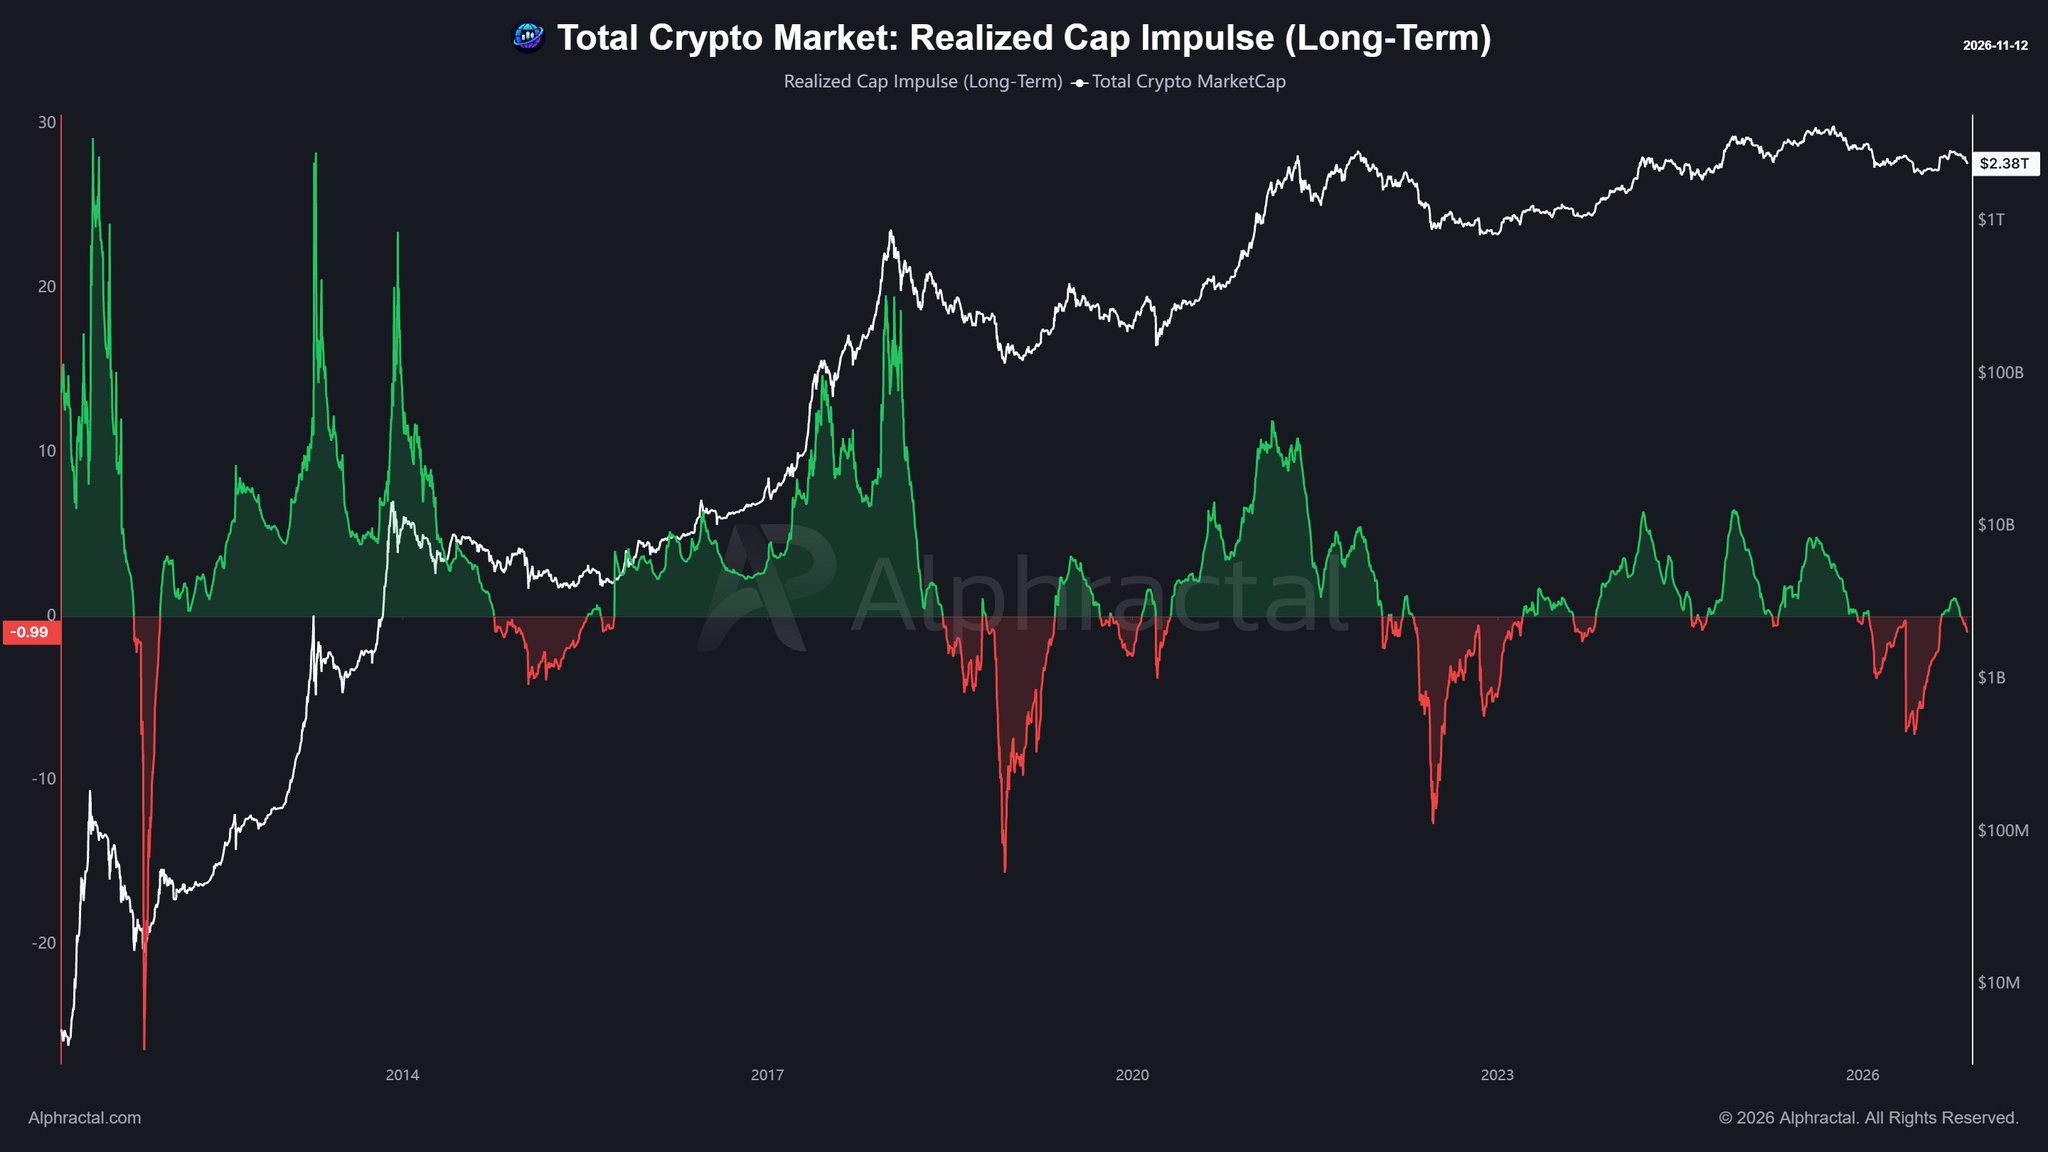
The total crypto market is sitting near a $2.38 trillion market cap — but the capital flowing beneath that surface has reversed. Alphractal’s Realized Cap Impulse, a long-term indicator aggregating the realized capitalization of more than 90 cryptocurrencies, has dropped to −0.99, signaling that aggregate capital momentum has flipped negative again. That divergence — elevated price, deteriorating momentum — is precisely the condition the indicator was built to flag.
An analyst at Alphractal published the signal on November 12, 2026, noting that “capital momentum across the crypto market has turned negative again.” The reading follows a brief positive recovery that failed to hold, returning the long-term oscillator below the zero line. The analyst is explicit that the metric does not pinpoint a bottom or quantify the size of any potential decline — but it does, in their words, warn against calling a new bull cycle without “sustained capital improvement.”
What the Realized Cap Impulse Actually Measures
The Realized Cap Impulse is not a price indicator. It measures the rate of change in realized capitalization across the aggregated crypto market — in this case, more than 90 individual cryptocurrencies. Realized capitalization, unlike market cap, prices each coin at the value it last moved on-chain, making it a proxy for actual capital deployed into the market rather than paper valuations. The impulse derivative of that figure isolates whether capital is accelerating into or retreating from the market in aggregate.
When the oscillator is positive, the aggregate realized cap is expanding above its long-term trend — capital is actively entering. When it turns negative, as it has now at −0.99, the aggregate realized cap has fallen below trend, indicating that the market’s capital base is contracting or stagnating relative to its own history. The long-term version of the indicator smooths short-term noise, so a reading of −0.99 represents a persistent, not fleeting, deterioration in capital momentum.
The Divergence: $2.38T Market Cap, Negative Capital Momentum
The chart shared by Alphractal spans approximately 2012 to 2026 and reveals a pattern that has historically preceded market stress: the white market cap line remains elevated near its recent highs at $2.38 trillion, while the Realized Cap Impulse oscillator sits firmly below zero. This same divergence — price resilient, capital momentum negative — has appeared at multiple inflection points across prior cycles, historically associated with cooling or bearish phases even when surface-level price action appeared stable.
Critically, the recent recovery in the oscillator, which had briefly pushed back toward positive territory, failed to hold. The relapse to −0.99 is not a first dip — it is a failed recovery followed by renewed deterioration. That sequence carries different weight than an initial negative reading, because it indicates that the structural capital improvement markets needed to sustain a bull cycle thesis did not materialize. Bitcoin itself is down approximately 6.5% in the past 24 hours and 21% over the past six weeks, data points the analyst cites as aligning with the signal’s current reading.
This dynamic has parallels to prior periods of structural market stress, where on-chain capital metrics diverged from spot prices before price eventually caught down to fundamentals.
What the Signal Confirms — and What It Doesn’t
The Alphractal note is deliberate about scope. A negative Realized Cap Impulse reading confirms that the aggregate capital base is under long-term trend — it does not determine how far prices fall, when a bottom forms, or which assets are most exposed. It is a regime indicator, not a trade signal.
What it does confirm with specificity: any market participant calling the start of a new bull cycle without first seeing the Realized Cap Impulse return to sustained positive territory is making that call against the capital evidence. The metric aggregates more than 90 cryptocurrencies, so it cannot be explained away by rotation between assets — it reflects the market’s total capital condition.
The practical implication is a framework for monitoring rather than a directional trigger. The oscillator needs to recover above zero and hold that level before the structural capital argument supports a cycle-high thesis. A single candle crossing zero — as the recent failed recovery showed — is insufficient. Sustained improvement is the stated requirement.
Traders watching altcoin setups like the SUI Inverse Head & Shoulders or attempting to call a bottom in assets like XRP should factor this macro capital backdrop into their read — an aggregate negative capital environment is a headwind for all assets simultaneously.
The One Threshold That Changes the Picture
The Realized Cap Impulse returning above zero and sustaining that position is the single metric condition that would structurally alter the signal. At the current reading of −0.99, the oscillator is near what the chart indicates as its lower negative range, which historically has corresponded to either bottoming processes or continued market stress — the distinction only resolvable in hindsight once the oscillator’s direction becomes clear over the following weeks.
Until that recovery materializes and holds, the Alphractal framework characterizes the current environment as one of fragile recovery and market stress — not a confirmed bear, but a market in which the capital foundation required for a new bull phase has not been established.
The Realized Cap Impulse at −0.99 is the number to watch. Any sustained move back above zero would be the first structural signal that aggregate capital momentum is recovering. Any further deterioration below the current level would deepen the warning. Neither outcome is confirmed — the pattern is still forming, and the oscillator’s next direction is the question the market is now answering.
Source: x.comFrequently Asked Questions
What is the Realized Cap Impulse and why does a −0.99 reading matter?
Does a negative Realized Cap Impulse predict how far the crypto market will fall?
What would need to happen for the signal to turn bullish?
Why does the $2.38T market cap make the negative reading more significant?
Source: Alphractal · Published by CoinsProbe Markets Desk
The opinions and market insights shared on CoinsProbe represent the views of individual authors based on prevailing market conditions at the time of publication. Cryptocurrency investments carry significant risk and volatility. Readers are encouraged to conduct their own research and seek professional financial advice before making investment decisions. CoinsProbe and its contributors do not accept responsibility for financial losses or decisions made based on published content.
CoinsProbe may publish sponsored articles, affiliate links, or promotional collaborations. All sponsored material is clearly labeled to maintain transparency with our audience. Our editorial decisions remain fully independent, and advertising partnerships do not influence reviews, rankings, or published opinions.
Since 2023, CoinsProbe has delivered reliable insights on cryptocurrency, blockchain, and digital assets. Our content is created by experienced researchers and analysts who follow strict editorial standards focused on accuracy, transparency, and credibility. Every article is carefully reviewed and verified using trusted sources and current market data. We provide unbiased analysis and timely updates covering everything from emerging crypto projects to major industry developments.