
- LINK is trading near $9.37 — up 7.06% in 24 hours and 9.89% over 30 days — with a market cap of $7.01 billion, though still down ~23% year-to-date.
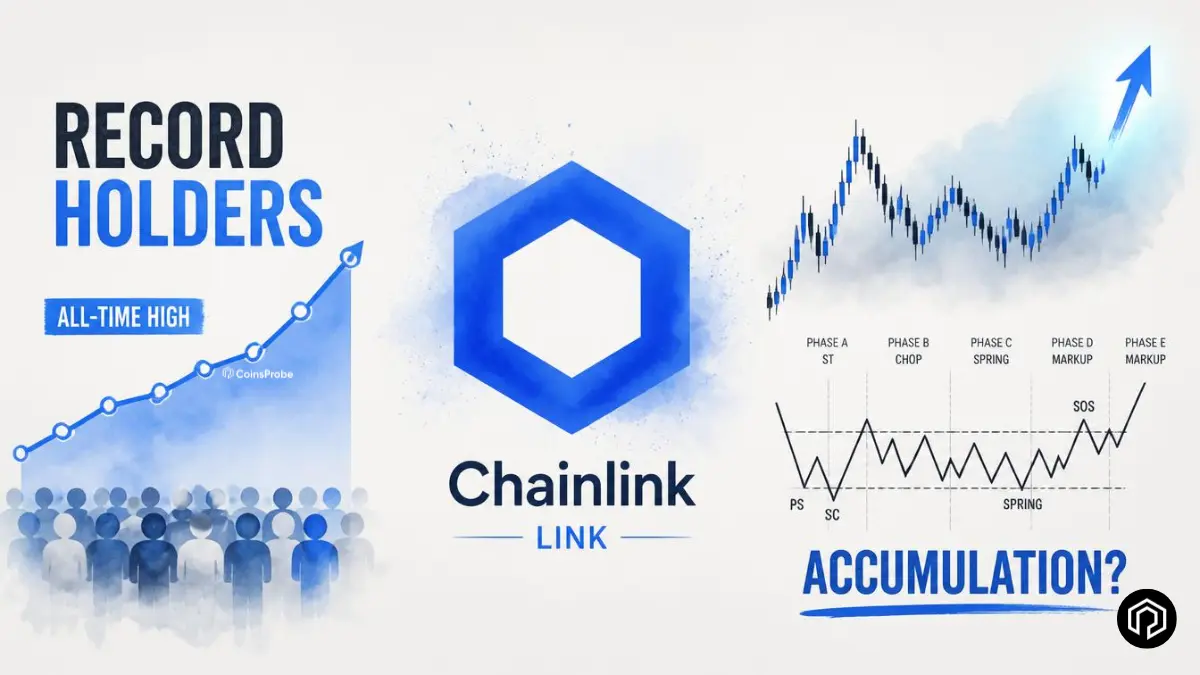
- Chainlink has reached a new all-time high in unique holders at approximately 3.955–3.96 million — per Santiment data highlighted by analyst Ali Charts.
- The weekly chart is displaying a classic Wyckoff Accumulation structure with SC, AR, and ST phases visible.
Chainlink is flashing two simultaneous signals that rarely appear together during a prolonged corrective phase — a record number of unique holders reaching an all-time high while the weekly chart builds what analysts are identifying as a textbook Wyckoff Accumulation structure. Neither signal is a guarantee of what comes next, but the combination of on-chain holder expansion and a constructive multi-month technical base is one of the more compelling setups LINK has produced in the current cycle.
At the time of writing, LINK is trading at approximately $9.37 with a market capitalization of $7.01 billion — up 7.06% in the past 24 hours and 9.89% over 30 days. The token remains down roughly 23% year-to-date and more than 83% below its May 2021 all-time high of approximately $53 — context that makes the record holder count milestone all the more analytically significant.

Chainlink Hits All-Time High in Unique Holders
The first signal — and arguably the more structurally meaningful of the two — comes from on-chain data shared by analyst Ali Charts (@alicharts) via Santiment: Chainlink has just reached a new all-time high in unique holders, with approximately 3.955–3.96 million LINK holders now recorded worldwide.
This milestone deserves careful framing. LINK is currently trading more than 83% below its May 2021 all-time high of approximately $53 — yet the number of unique addresses holding the token has never been higher in its history. The two data points are moving in opposite directions: price down dramatically from peak, holder count at an all-time high.
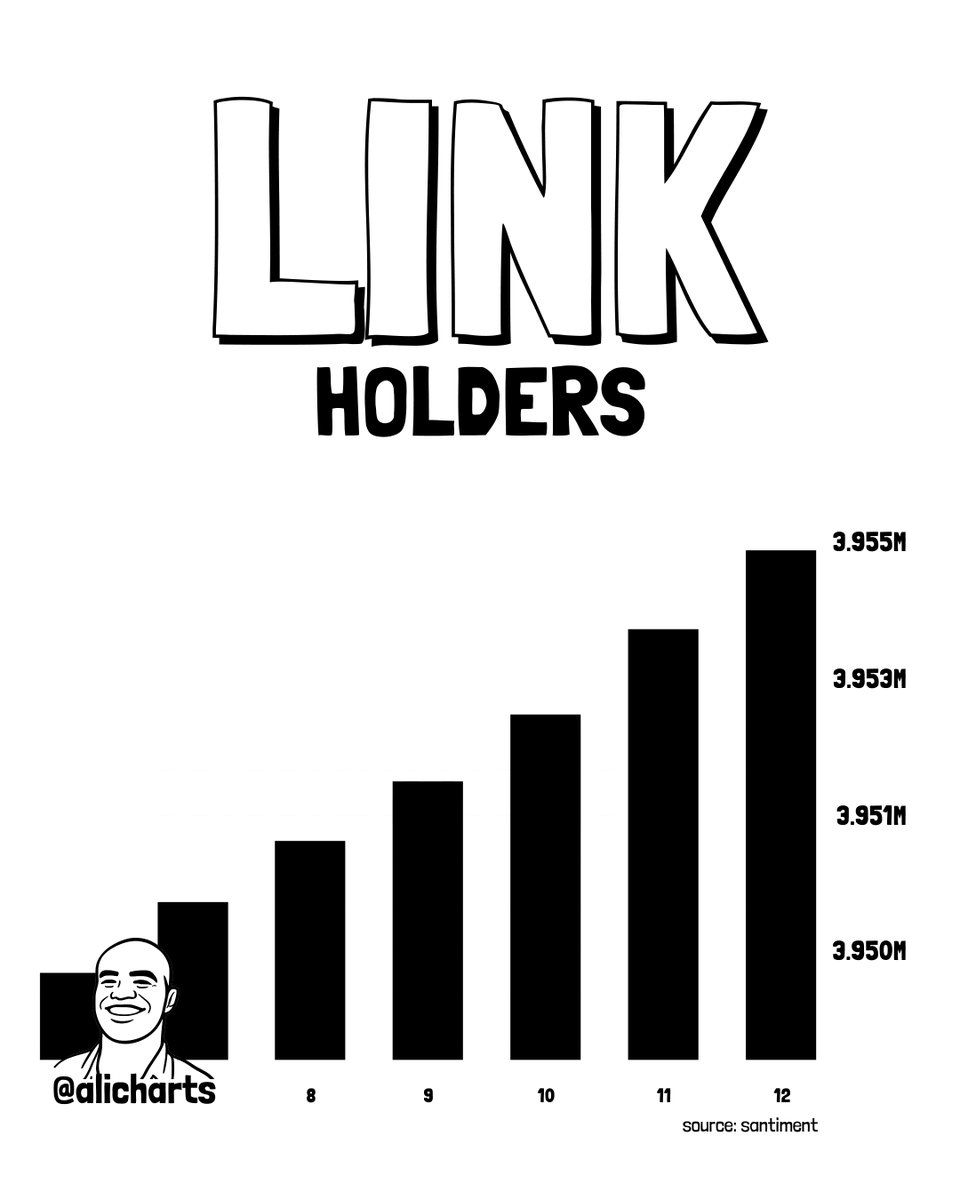
This divergence — rising holders during extended price weakness — is one of the more consistently bullish on-chain patterns seen across major crypto assets. It describes a market where participants are not exiting during the corrective phase but are instead entering or maintaining positions at discounted prices. Each new holder at current levels is, by definition, accumulating below the prices that prior holders paid — a structural dynamic that reduces the effective supply overhang and builds the base of cost-basis support that underpins durable recoveries.
As covered in our Chainlink whale accumulation all-time high holdings analysis and Chainlink 5-month whale activity high breakdown, the large-holder accumulation signal that has been building in LINK throughout 2026 now has a complementary retail/broad-holder confirmation — 3.96 million unique holders at an all-time high while price remains deeply discounted from prior peaks.
Wyckoff Accumulation — What the Weekly Chart Shows and What Comes Next
On the weekly timeframe, LINK is forming a classic Wyckoff Accumulation structure within the $7.01–$10.86 range — a pattern that identifies the phases through which smart money builds positions before a markup phase begins.
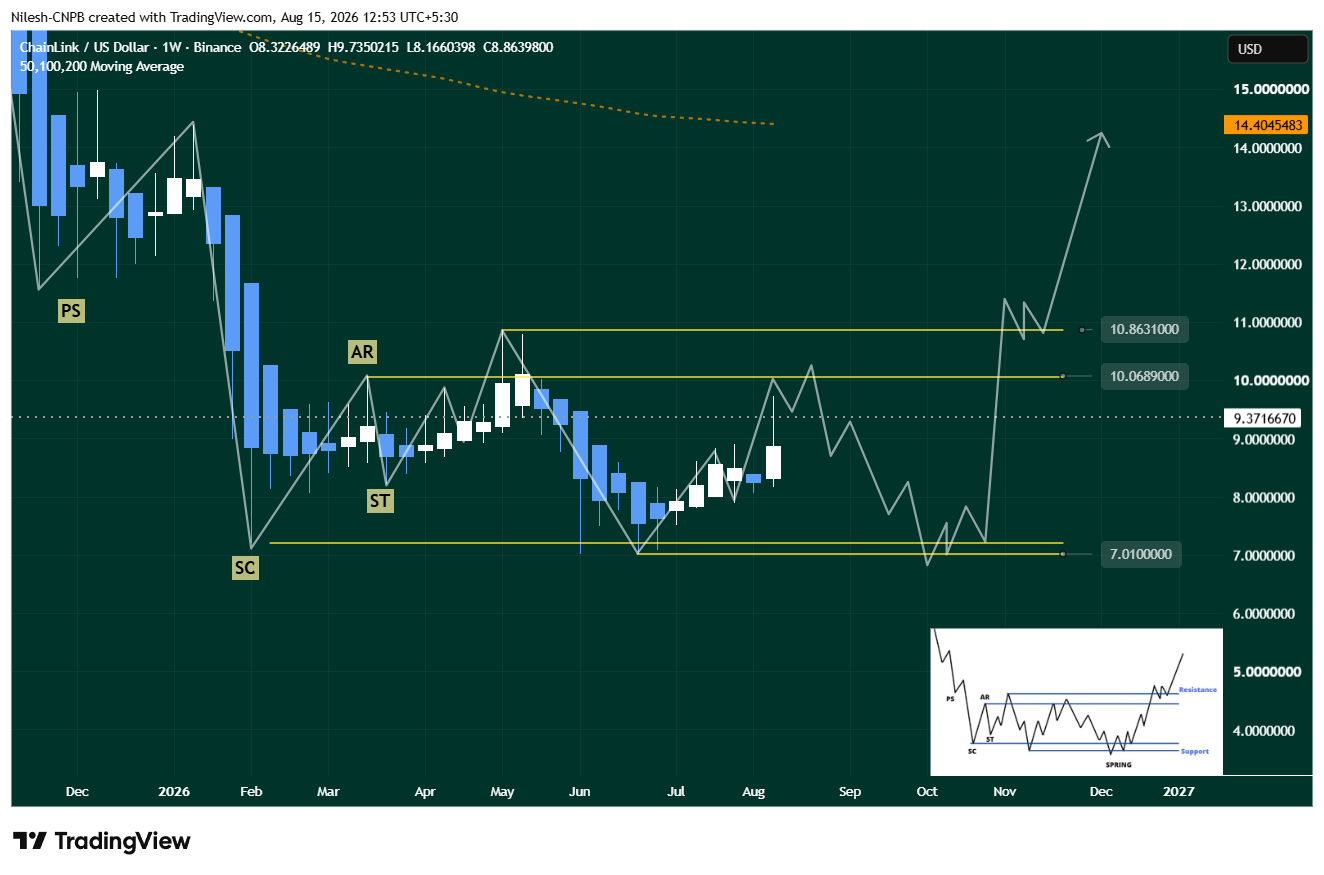
The key phases are already visible on the chart:
- Selling Climax (SC) near $7.01 — the capitulation low where aggressive selling was absorbed
- Automatic Rally (AR) into $10.06–$10.86 — the sharp bounce that set the range ceiling
- Secondary Test (ST) — a retest of the SC lows that held, confirming support is durable
- Current phase — range oscillation between $7.01 and $10.86 as accumulation continues
What Comes Next — Spring Scenario
The Spring is one of the most characteristic — and most misunderstood — elements of classic Wyckoff accumulation. Before the markup phase begins, price frequently makes one final dip below the SC support to shake out the remaining weak-handed holders, sweep stop-losses, and allow smart money to complete its accumulation at the lowest possible prices.
On LINK’s chart, a Spring would involve a move back toward the $7.01 support zone — potentially breaching it briefly in a false breakdown before recovering sharply. This scenario is not bearish in the Wyckoff framework — it is the final accumulation opportunity before the markup. Traders who understand the Spring pattern treat the $7.01 zone not as a breakdown confirmation but as the highest-conviction entry point within the accumulation structure.
The projected path on the chart suggests that following a Spring near $7.01, the markup phase could be more powerful than the direct breakout scenario — because the Spring would have cleared the remaining overhead supply more completely.
Bottom Line
Chainlink is presenting the most constructive combination of on-chain and technical signals it has produced in the current cycle. A record 3.96 million unique holders — reached while price remains 83% below the 2021 all-time high — describes a holder base that is expanding during weakness rather than contracting, a historically bullish structural dynamic. And a weekly Wyckoff Accumulation structure with clearly identifiable SC, AR, and ST phases maps out a specific entry scenario at Spring to $7.01.
The signal is constructive. The confirmation is pending. $10.86 on the upside and $7.01 on the downside define the boundaries within which the current Wyckoff structure will either confirm or invalidate — and how LINK’s weekly closes interact with those two levels over the coming months will determine whether the 3.96 million holders who have accumulated during this correction are ultimately rewarded.
Frequently Asked Questions
What is the Wyckoff Accumulation pattern on LINK’s weekly chart?
The Wyckoff Method identifies specific phases through which smart money accumulates before a markup. LINK’s weekly chart shows a Preliminary Support (PS), Selling Climax (SC) near $7.01, Automatic Rally (AR) to $10.06–$10.86, and Secondary Test (ST) — currently in the range oscillation phase that typically precedes either a Spring shakeout or a direct breakout.
What does LINK’s all-time high holder count mean?
Approximately 3.955–3.96 million unique addresses now hold LINK — an all-time high reached while price remains 83%+ below the 2021 ATH. This divergence (rising holders, depressed price) describes accumulation behavior and reduces effective supply overhang, historically a bullish structural dynamic.
The opinions and market insights shared on CoinsProbe represent the views of individual authors based on prevailing market conditions at the time of publication. Cryptocurrency investments carry significant risk and volatility. Readers are encouraged to conduct their own research and seek professional financial advice before making investment decisions. CoinsProbe and its contributors do not accept responsibility for financial losses or decisions made based on published content.
CoinsProbe may publish sponsored articles, affiliate links, or promotional collaborations. All sponsored material is clearly labeled to maintain transparency with our audience. Our editorial decisions remain fully independent, and advertising partnerships do not influence reviews, rankings, or published opinions.
Since 2023, CoinsProbe has delivered reliable insights on cryptocurrency, blockchain, and digital assets. Our content is created by experienced researchers and analysts who follow strict editorial standards focused on accuracy, transparency, and credibility. Every article is carefully reviewed and verified using trusted sources and current market data. We provide unbiased analysis and timely updates covering everything from emerging crypto projects to major industry developments.