- LINK trades near $8.16, up 3% over the past month despite remaining down YTD.
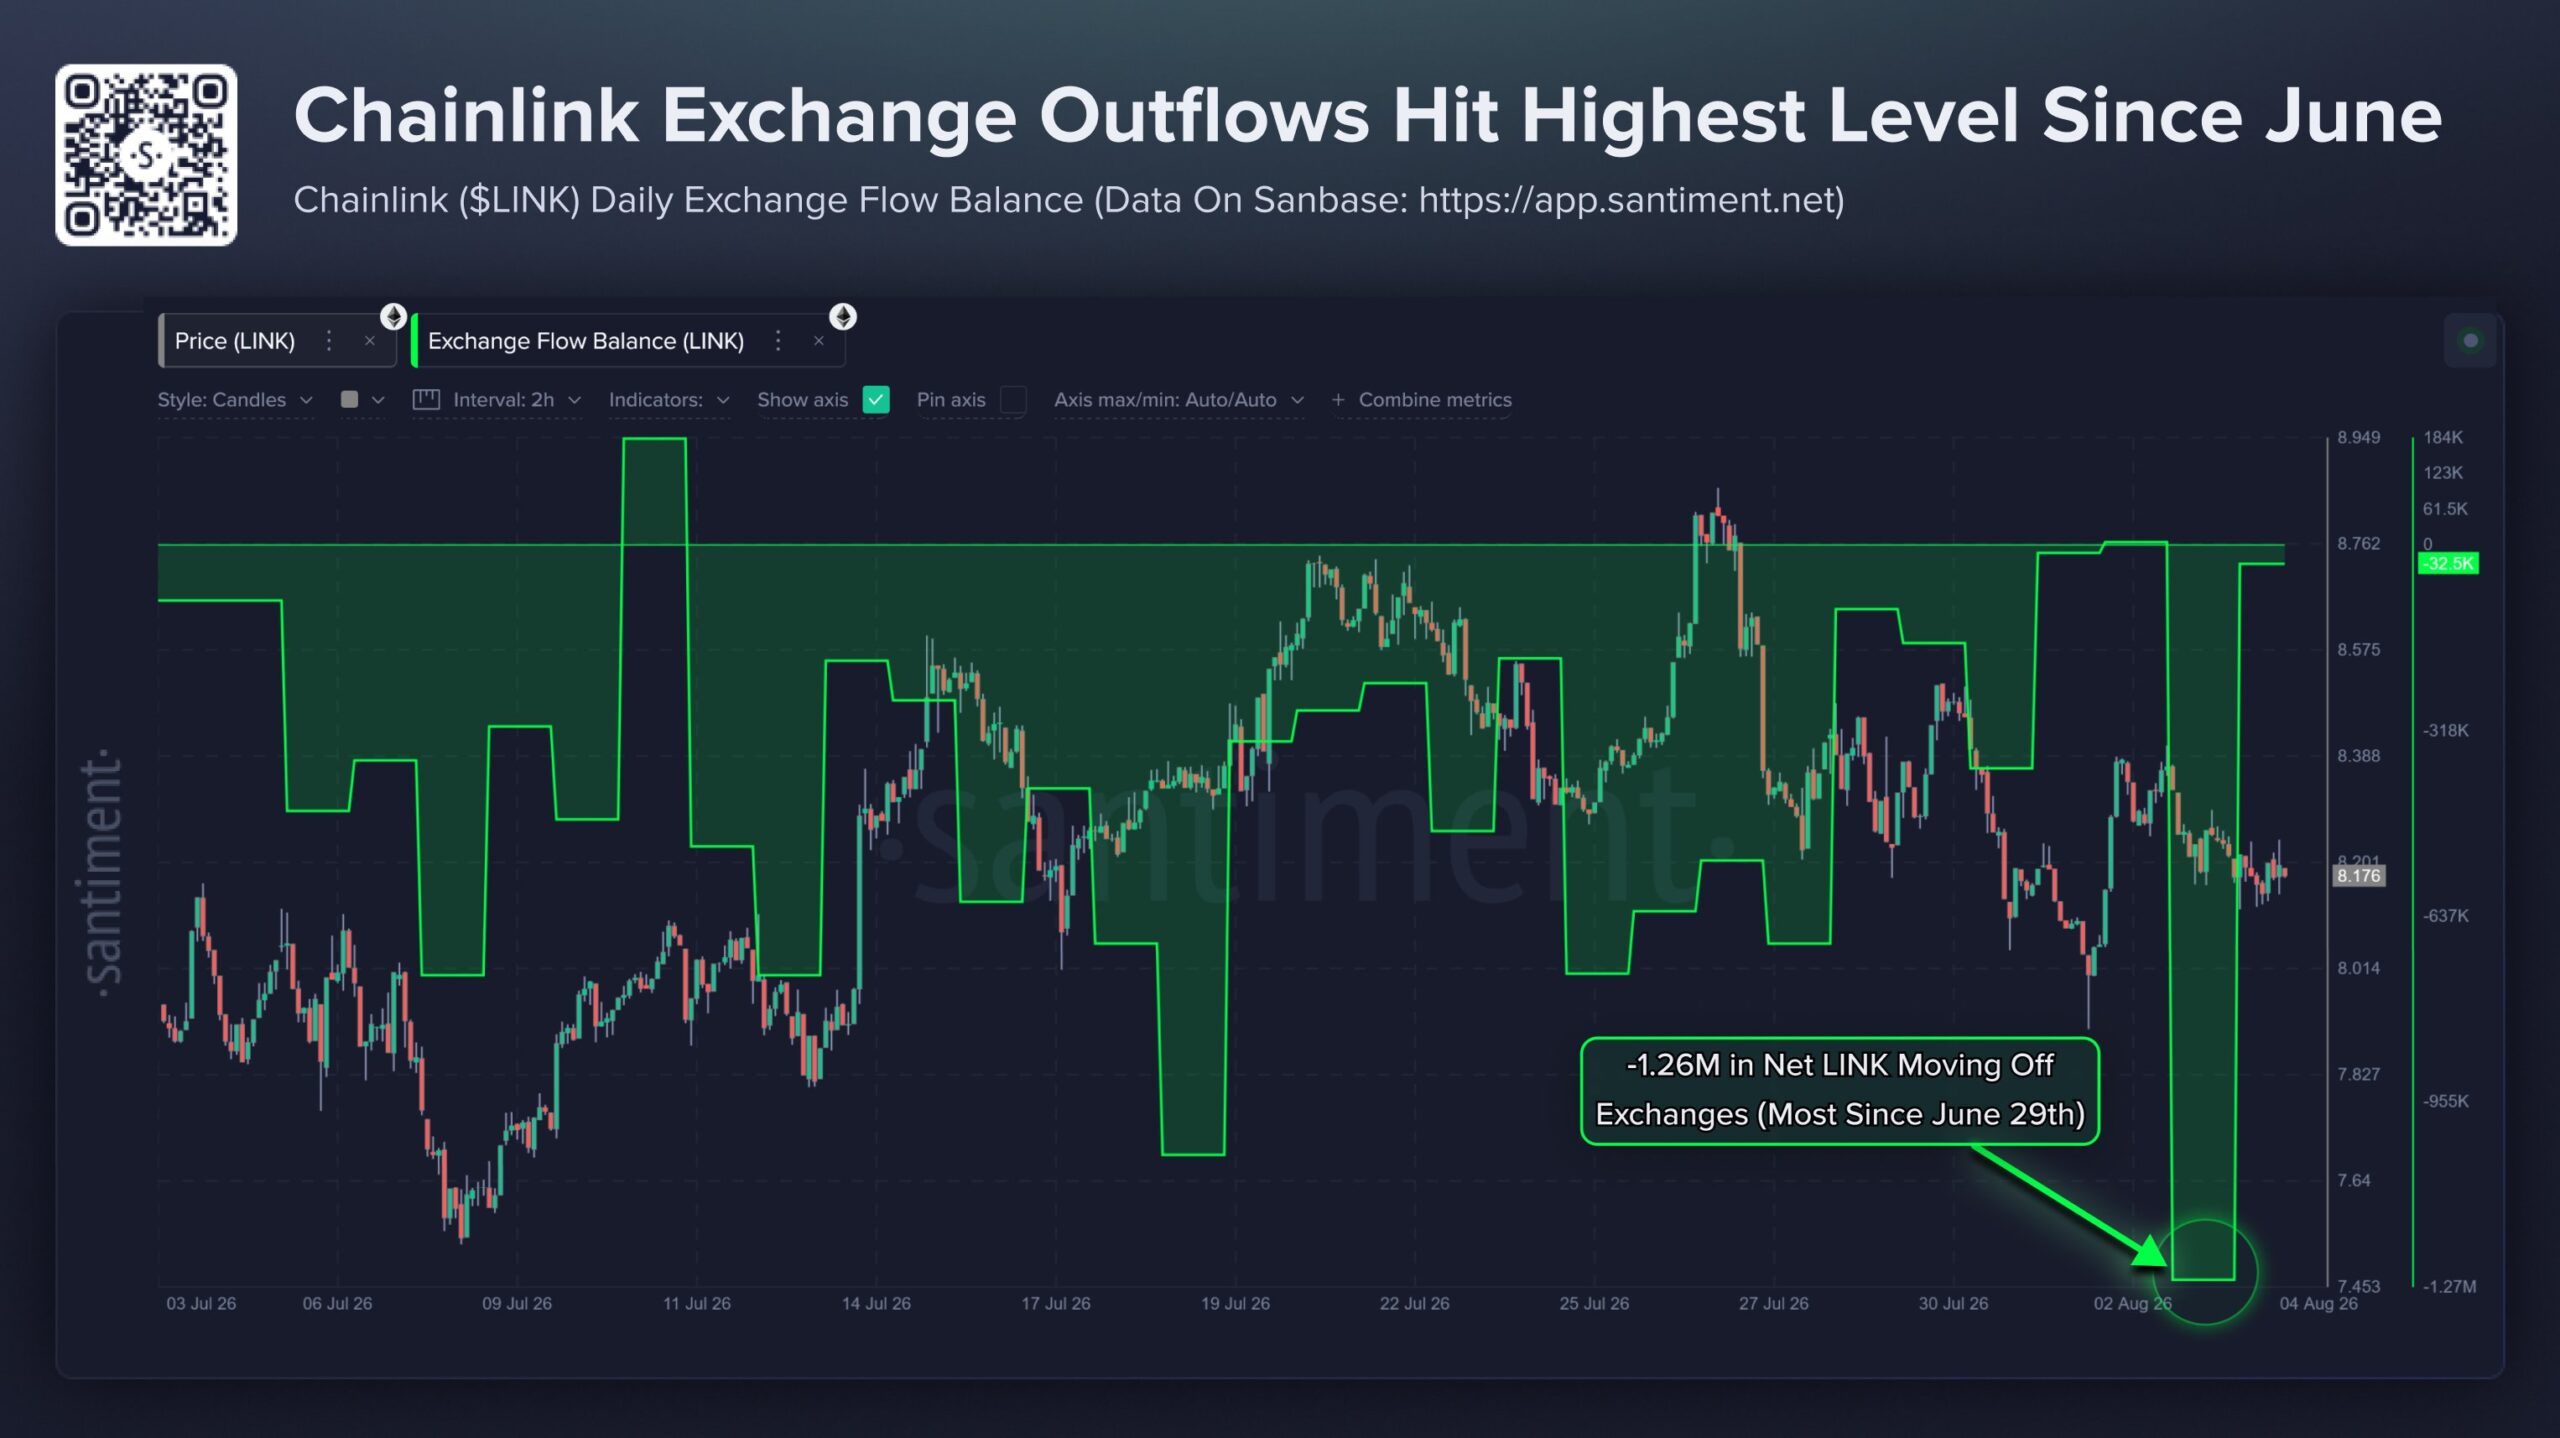
- 1.26 million LINK left exchanges in a single day, signaling reduced selling pressure.
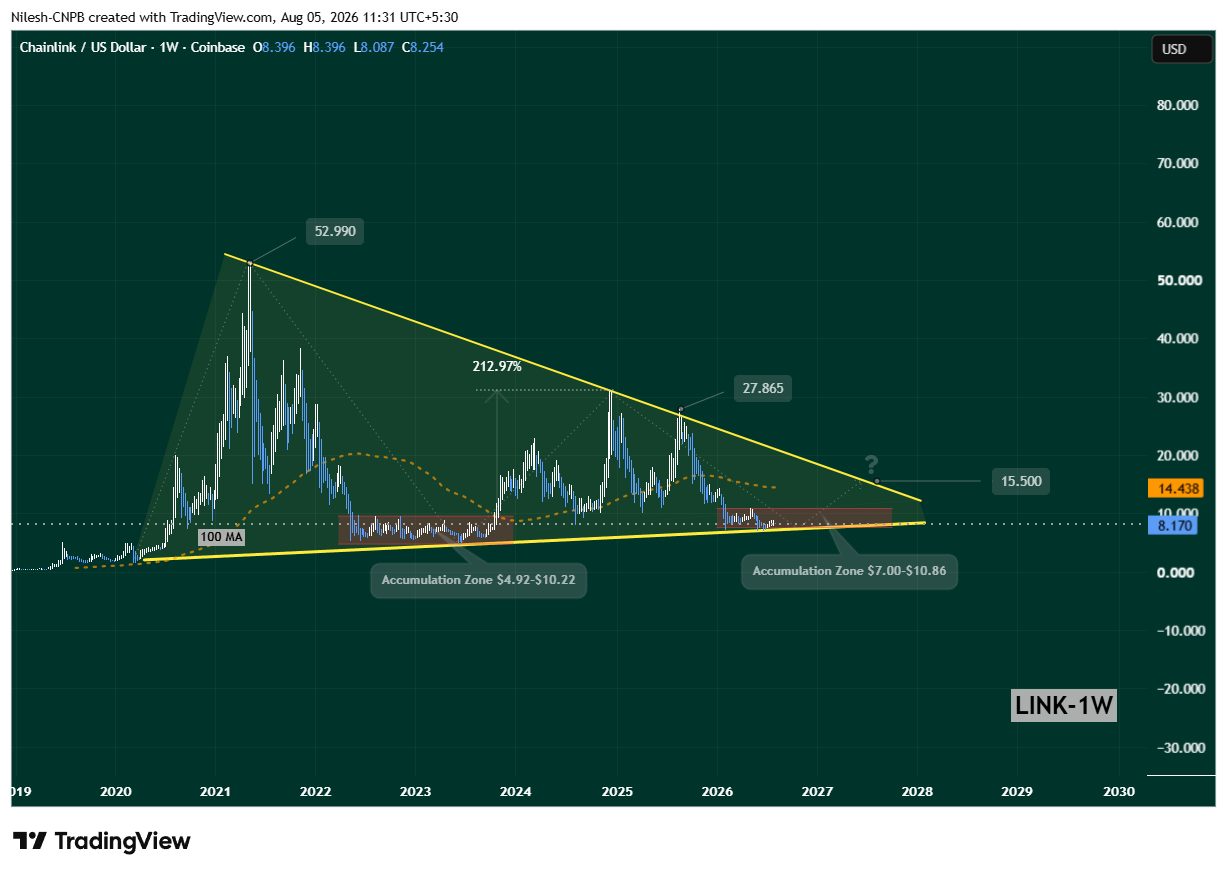
- The weekly chart is mirroring the 2023 accumulation pattern that preceded a 212% rally.
- A reclaim of $14.43 could open the door to $15.50, while $7.00 remains the key support.
Chainlink’s setup is one of the more precisely documented potential recovery frameworks in the current crypto market — not because of speculation, but because the exact same pattern structure, in the exact same position within the same long-term triangle, on the same asset, produced a documented +212% rally the last time it appeared. That specificity is what makes the current setup worth examining carefully.
LINK is trading at $8.16 — up +2.96% over 30 days and -32.97% year-to-date — with a market cap of approximately $6.11 billion. Despite the YTD decline, LINK has been building a specific technical and on-chain foundation over the past several weeks that mirrors one of the more significant pre-rally setups in its own history.

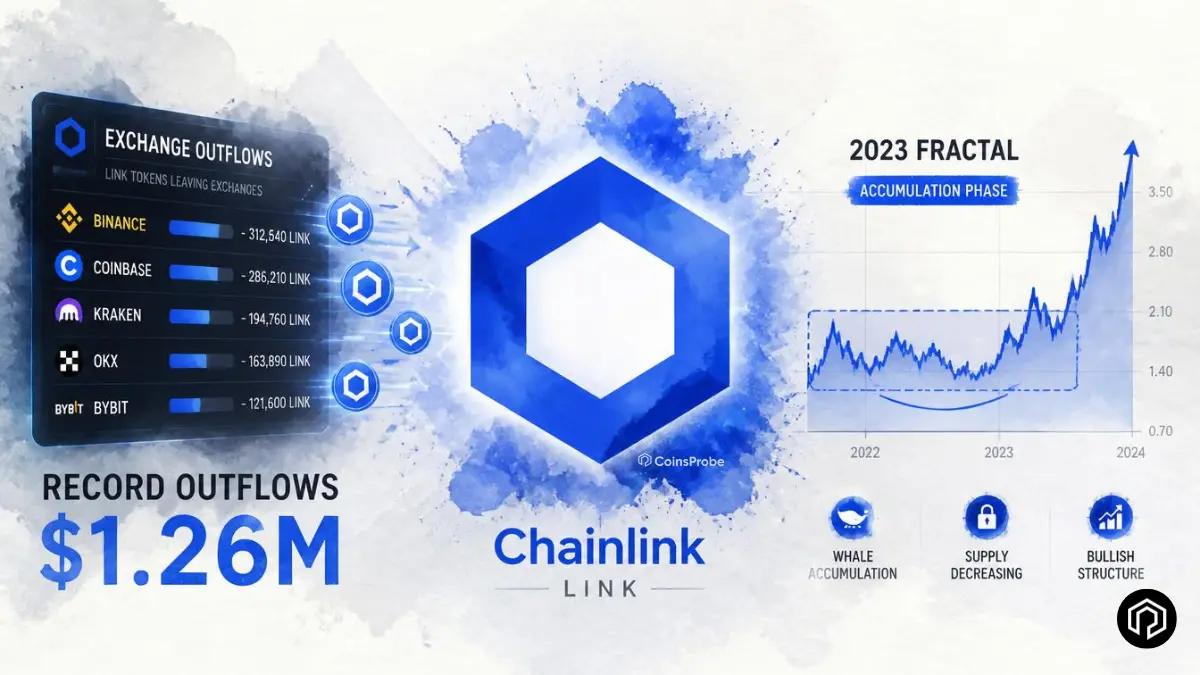
1.26M LINK Exchange Outflows: Largest Since June 29
Santiment data confirms that LINK recorded 1.26 million LINK in net exchange outflows in a single 24-hour period — the largest daily outflow figure since June 29.
What exchange outflows signal:
When LINK moves out of exchange wallets into private wallets or cold storage, it reduces the immediately available sell-side supply on exchange order books. Fewer tokens sitting on exchanges means the market needs to absorb less immediate selling pressure — lowering the probability of sharp downside moves driven by exchange-side liquidations.
The scale of today’s outflow — 1.26 million LINK in a single day — is not routine. It represents deliberate, large-scale movement of tokens away from trading venues and into longer-term holding positions. As we documented in our Chainlink whale accumulation and 75% upside article — LINK whale holdings have been at all-time highs, and the exchange outflow data provides the on-chain mechanism through which that accumulation is occurring.
The fundamental backdrop:
The timing of the outflow aligns with two significant institutional developments:
DTCC’s first production tokenized securities trades — The Depository Trust & Clearing Corporation — the central clearing and settlement infrastructure for US securities markets — processed its first production trades of tokenized US securities with Chainlink among the technology providers. This is not a pilot or proof-of-concept — it is live, production-environment use of Chainlink infrastructure in the world’s largest securities settlement system.
CCIP expansion to Canton and Robinhood Chain — Chainlink’s Cross-Chain Interoperability Protocol continues expanding institutional and crypto network support — with Canton (the institutional DeFi network) and Robinhood Chain both adding CCIP integration. As we covered in our Robinhood Chain DEX volume article — Robinhood Chain’s explosive growth makes it a meaningful addition to CCIP’s coverage.
The Long-Term Symmetrical Triangle and the 2023 Fractal
The weekly chart provides the analytical framework that has been building since our Chainlink strongest network growth of 2026 and double bottom article — and the setup has now developed further toward the structural inflection point that makes it most actionable.
The long-term symmetrical triangle:
Since Chainlink’s 2021 all-time high near $52.99, the weekly chart has been forming a massive long-term symmetrical triangle — defined by a descending upper resistance trendline connecting successive lower highs and an ascending lower support trendline connecting successive higher lows. This multi-year structure is one of the largest consolidation patterns visible on LINK’s chart.
The most recent triangle leg:
The latest downward move within the triangle ran from the August 2025 high of $27.865 — the rejection from the upper descending resistance — all the way down to test the lower support trendline near $7.00, where LINK stabilised and began the current consolidation.
The 2023 parallel — the setup that preceded +212%:
The most important element of LINK’s current setup is not the symmetrical triangle itself — it is where within that triangle LINK is currently trading and how precisely that position mirrors a prior historical instance.
In 2023, LINK consolidated in a $4.92–$10.22 accumulation zone at the lower boundary of the same long-term triangle — a period characterised by depressed price, strong on-chain accumulation by large holders, and the market broadly ignoring fundamental developments. That 2023 accumulation phase was followed by:
- A reclaim of the 100-week moving average — which served as the specific confirmation trigger
- A breakout above the upper triangle resistance trendline
- A +212% rally — one of LINK’s most powerful sustained moves on record
LINK’s current position:
LINK is currently consolidating in a $7.00–$10.86 zone — almost identical in structure, in identical position at the lower triangle boundary, with comparable accumulation behaviour visible in the on-chain data.
| Element | 2023 Setup | 2026 Current Setup |
|---|---|---|
| Accumulation zone | $4.92–$10.22 | $7.00–$10.86 |
| Position in triangle | Lower boundary | Lower boundary |
| 100-week MA status | Below — awaiting reclaim | Below at $14.43 — awaiting reclaim |
| On-chain accumulation | Strong | Stronger than 2023 |
| Subsequent move | +212% | Pending |
The on-chain accumulation data is particularly notable: as we covered in our whale accumulation all-time high article — smart money accumulation is exceeding anything seen in the 2023 cycle, adding weight to the structural parallel rather than undermining it.
Bullish Scenario
LINK holds the $7.00 lower trendline and continues building within the $7.00–$10.86 accumulation zone — mirroring the 2023 base-building phase. A sustained weekly close above the 100-week MA at $14.43 provides the confirmation trigger — putting the upper triangle resistance at $15.50 (+87%) as the first target. A decisive break above $15.50 activates the larger expansion move that the 2023 +212% parallel suggests — bringing the August 2025 high of $27.865 back into the medium-term conversation.
Bearish Scenario
A sustained weekly close below the $7.00 lower triangle support invalidates the symmetrical triangle’s lower boundary — breaking the structural foundation of the accumulation thesis. In this scenario, lower historical support levels become the reference points before any recovery attempt becomes credible. The 2023 fractal parallel would be invalidated, and the next relevant accumulation zone would need to be established at lower price levels.
Bottom Line
Chainlink at $8.16 is sitting at the intersection of a precise historical fractal — the same lower boundary accumulation zone that preceded a +212% rally in 2023 — and the largest daily exchange outflow since June 29, with institutional fundamental developments (DTCC production tokenized securities, CCIP on Robinhood Chain and Canton) providing the underlying demand thesis.
The critical question for coming weeks: can LINK hold $7.00 and build enough base to reclaim the 100-week MA at $14.43 — the trigger that in 2023 confirmed the accumulation phase was transitioning to expansion? Or does selling pressure return and break the lower trendline?
The setup has happened before on this exact asset in this exact structural position. Whether 2026 follows 2023’s script will be determined by whether $7.00 holds and whether the 100-week MA eventually confirms.
Frequently Asked Questions (FAQ)
What is DTCC?
DTCC (Depository Trust & Clearing Corporation) is the largest U.S. post-trade infrastructure company that clears and settles securities. It is now advancing tokenization of U.S. securities with Chainlink as a key technology partner.
Why is the DTCC news important for LINK?
It provides major TradFi validation as DTCC works with BlackRock, J.P. Morgan, and others on tokenized assets using Chainlink’s oracles and CCIP. This strengthens Chainlink’s role in bridging traditional finance and blockchain.
What do the 1.26M LINK exchange outflows mean?
Santiment data shows the largest daily outflow since June 29, reducing tokens available for sale on exchanges. This lowers short-term sell pressure and is viewed as a constructive on-chain signal.
Is LINK a good investment for the rest of 2026?
It depends on risk tolerance. Bullish factors include DTCC progress, exchange outflows, and a long-term triangle setup similar to the 2023 breakout, but the token remains volatile and down significantly YTD.
The opinions and market insights shared on CoinsProbe represent the views of individual authors based on prevailing market conditions at the time of publication. Cryptocurrency investments carry significant risk and volatility. Readers are encouraged to conduct their own research and seek professional financial advice before making investment decisions. CoinsProbe and its contributors do not accept responsibility for financial losses or decisions made based on published content.
CoinsProbe may publish sponsored articles, affiliate links, or promotional collaborations. All sponsored material is clearly labeled to maintain transparency with our audience. Our editorial decisions remain fully independent, and advertising partnerships do not influence reviews, rankings, or published opinions.
Since 2023, CoinsProbe has delivered reliable insights on cryptocurrency, blockchain, and digital assets. Our content is created by experienced researchers and analysts who follow strict editorial standards focused on accuracy, transparency, and credibility. Every article is carefully reviewed and verified using trusted sources and current market data. We provide unbiased analysis and timely updates covering everything from emerging crypto projects to major industry developments.