

- Bitcoin trades at $77,673 (+1.52% 24h) with its 1-year rolling return still below zero per CryptoQuant's chart
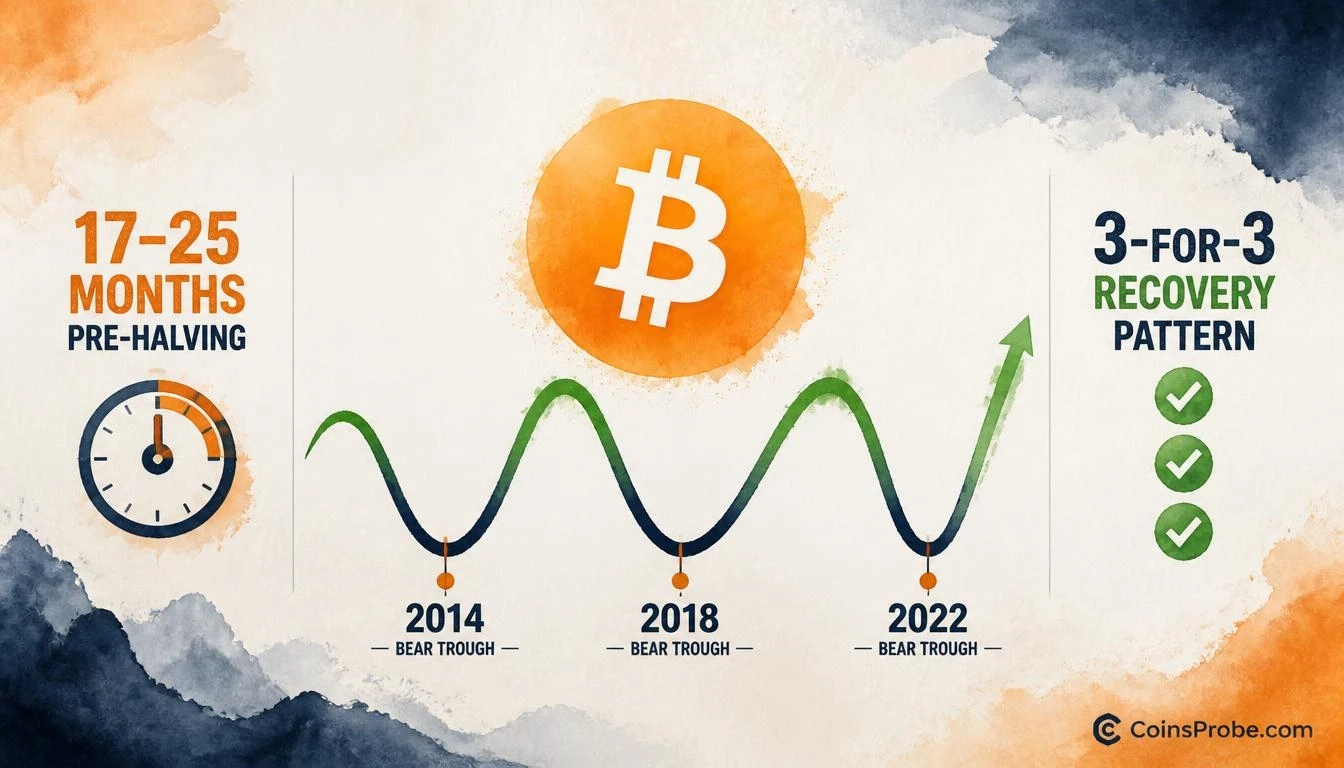
- CryptoQuant: every midterm weakness in 2014, 2018, and 2022 fell within the 17–25 month pre-halving window — recoveries followed all three
- Pattern is still forming — no breakout above the zero-return line confirmed yet; recovery thesis requires that crossover as first structural signal
Bitcoin is trading at $77,673 — up 1.52% in the past 24 hours — and sitting inside what CryptoQuant identifies as one of the most historically consistent phases of its four-year cycle: the 17–25 month window before a halving, immediately following the post-peak crash. The correlation has appeared in every bear market cycle on record. And it has nothing to do with elections.
In a note published November 3, 2026, CryptoQuant’s official account drew a direct line between midterm market weakness and Bitcoin’s broader cycle structure. The conclusion: “Every midterm fell 17–25 months before a halving, just after the post-peak crash. 2014, 2018 and 2022 all came after a bear market. That stretch has tended to recover, election or not. So ‘after midterms’ really means ‘this phase of the cycle.'” The midterm correlation is not a cause — it is a coincidence of timing that keeps landing inside the same pre-halving recovery window.
The 17–25 Month Pre-Halving Window — Three Instances, One Pattern
Bitcoin has completed three full cycles with observable post-peak bear markets: 2014, 2018, and 2022. In each case, the deepest drawdown phase occurred within the 17–25 month window preceding the next halving. Each bear market was followed by a recovery — not because an election concluded, but because that specific phase of Bitcoin’s supply-emission cycle had reached exhaustion.
| Cycle Bear Market | Halving | Months Before Halving | Outcome |
|---|---|---|---|
| 2014 Bear Market | July 2016 | ~17–25 months | Recovery followed |
| 2018 Bear Market | May 2020 | ~17–25 months | Recovery followed |
| 2022 Bear Market | April 2024 | ~17–25 months | Recovery followed |
Source: CryptoQuant (@cryptoquant_com, X)
Three-for-three. Each bear market trough resolved into a recovery phase that began before — not after — the halving itself. The halving does not cause the recovery; the depletion of sell-side pressure during the post-peak crash phase creates the structural conditions for it.
The 1-Year Rolling Return Chart — Where Bitcoin Stands Now
CryptoQuant’s chart tracks Bitcoin’s 1-year rolling return from approximately 2010 through mid-2025, plotted on a logarithmic scale. The chart shows cyclical oscillation between green (positive return) and red (negative return) phases, with labeled peaks at 16.77x (~2011), 1.37x (~2015), 1.46x (~2019), and 1.81x (~2023). Each green spike is followed by a sharp collapse into red territory — the bear phase — before the next expansion cycle begins.
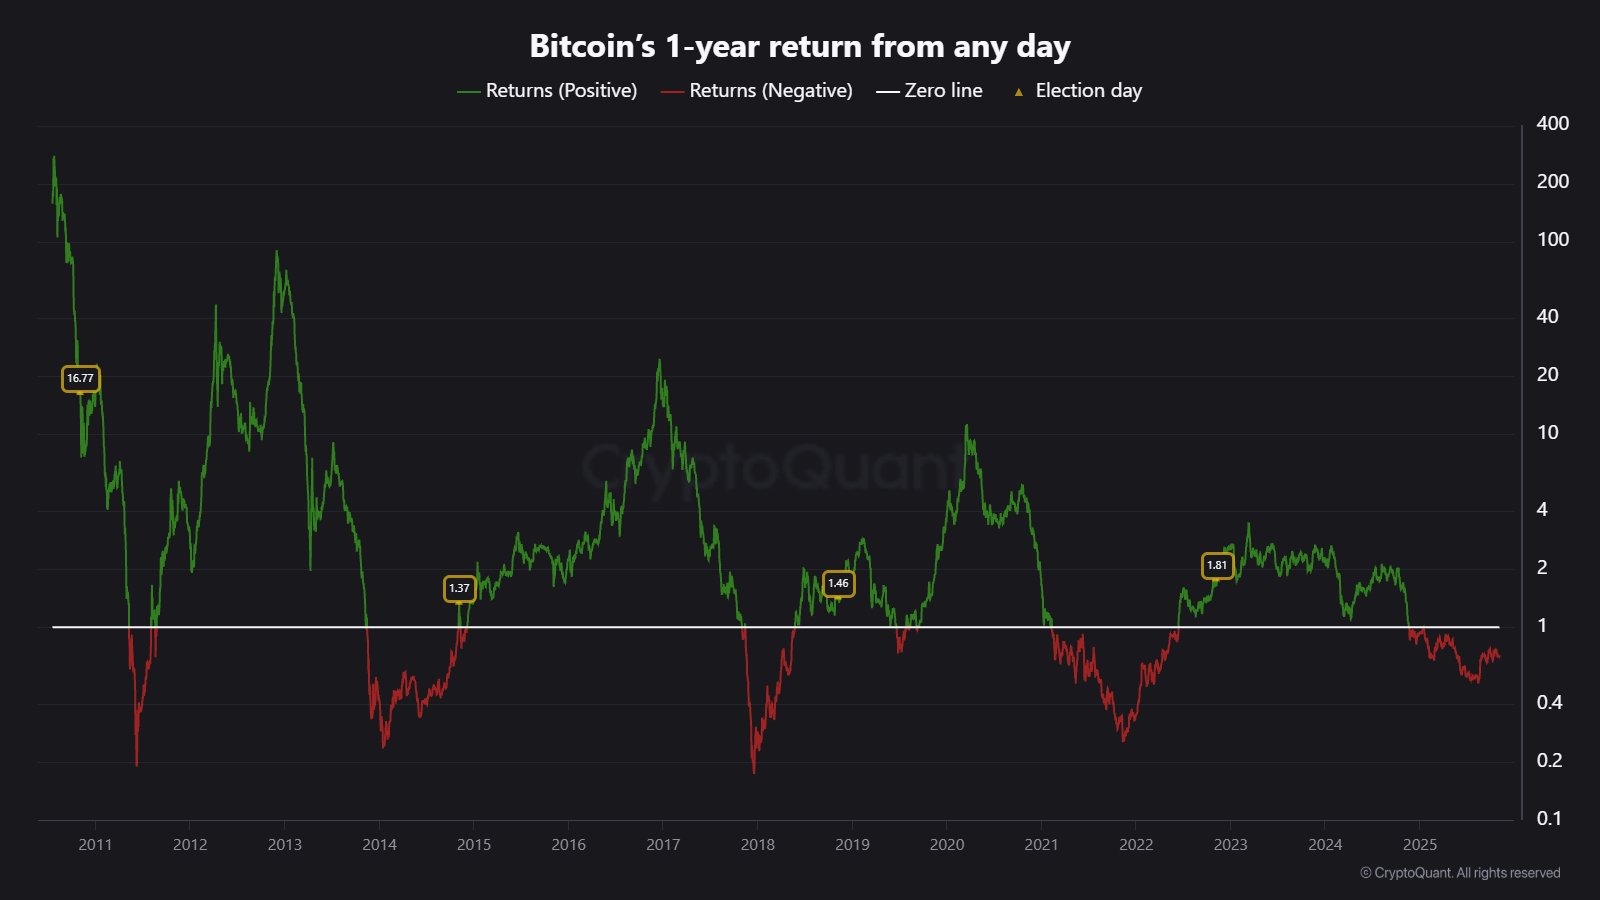
As of late 2025, the chart shows Bitcoin’s 1-year rolling return is below the zero line — in red, negative return territory. This is the same position Bitcoin occupied during the 2014, 2018, and 2022 bear troughs before each subsequent recovery. No breakout above the zero line has been confirmed as of this reading. The pattern is still forming. What the chart establishes is structural position: Bitcoin is in the phase that has historically preceded recovery, not in one that has confirmed it.
Why “After Midterms” Is a Mislabel
The conventional framing — that Bitcoin recovers after U.S. midterm elections — has circulated in crypto markets for years. CryptoQuant’s analysis dismantles the causal logic: midterms fall in November every two years, and Bitcoin’s halving cycle runs approximately 48 months. The overlap between November midterms and the 17–25 month pre-halving window is not by design. It is arithmetic. The two cycles happen to intersect during this phase of Bitcoin’s supply schedule.
The implication is significant. If the recovery were election-driven, it would be dependent on political outcomes. If it is cycle-driven, it is dependent on Bitcoin’s own supply mechanics — specifically, the reduction in miner selling pressure and the accumulation behavior that tends to precede halving events. That distinction separates a thesis that could fail (election-dependent) from one with structural backing (halving-cycle-dependent). For more on where the current cycle stands relative to prior bear phases, see Bitcoin Is in the Disbelief Phase — On-Chain Data Says the Bottom Is In.
What the Pattern Says — And What It Doesn’t
What it says: Bitcoin’s post-midterm weakness in 2014, 2018, and 2022 occurred within the 17–25 month pre-halving window. Each instance was followed by a recovery before the next halving. The current moment in November 2026 sits inside a comparable window relative to a future halving date.
What it doesn’t say: CryptoQuant’s note contains no price targets, no specific support levels, and no timeline for when the recovery begins. The 1-year rolling return chart shows Bitcoin still below the zero line — meaning no confirmation of recovery has printed yet. A three-instance dataset carries pattern value but not statistical certainty.
What to watch for continuation: The 1-year rolling return crossing back above the zero line on the chart CryptoQuant published would be the first structural confirmation that the negative return phase has resolved. Until that occurs, the pattern is a framework — not a signal. Context from recent price action is worth noting: Bitcoin’s rebound recently stalled at $76,800, underlining that the recovery, if it follows the historical template, has not yet asserted itself in price.
The Halving Cycle as the Actual Driver
What makes CryptoQuant’s framing analytically useful is that it replaces a vague macro narrative (elections are good for Bitcoin) with a specific structural one (Bitcoin’s supply cycle creates recurring recovery windows). The 17–25 month pre-halving range is not an approximation — it is the documented timing of every bear market trough in Bitcoin’s tracked history. Miners, who front-load distribution after a peak and reduce sell pressure as the halving approaches, are one mechanical explanation. Accumulation by longer-term holders during the negative return phase is another.
The post-midterm data has been covered in detail previously: Bitcoin post-midterm drops have hit −49.7%, yet one year later the median recovery reached +45.8%. The CryptoQuant framing explains why: by one year post-midterm, Bitcoin is typically 5–13 months closer to its halving — well inside the structural recovery window.
At $77,673, Bitcoin is trading inside this window. The 1-year rolling return is negative. The halving cycle clock is running. Whether the pattern extends to a fourth instance will be visible first in that rolling return crossing the zero line — not in an election result.
Watch the 1-year rolling return above zero as the first structural confirmation that the current pre-halving recovery phase has begun.
Source: x.comFrequently Asked Questions
What is the 17–25 month pre-halving window CryptoQuant identified?
Does Bitcoin actually recover after U.S. midterm elections?
Has Bitcoin’s 1-year rolling return turned positive yet in 2025–2026?
What would confirm the pre-halving recovery thesis in this cycle?
Source: CryptoQuant · Published by CoinsProbe Markets Desk
The opinions and market insights shared on CoinsProbe represent the views of individual authors based on prevailing market conditions at the time of publication. Cryptocurrency investments carry significant risk and volatility. Readers are encouraged to conduct their own research and seek professional financial advice before making investment decisions. CoinsProbe and its contributors do not accept responsibility for financial losses or decisions made based on published content.
CoinsProbe may publish sponsored articles, affiliate links, or promotional collaborations. All sponsored material is clearly labeled to maintain transparency with our audience. Our editorial decisions remain fully independent, and advertising partnerships do not influence reviews, rankings, or published opinions.
Since 2023, CoinsProbe has delivered reliable insights on cryptocurrency, blockchain, and digital assets. Our content is created by experienced researchers and analysts who follow strict editorial standards focused on accuracy, transparency, and credibility. Every article is carefully reviewed and verified using trusted sources and current market data. We provide unbiased analysis and timely updates covering everything from emerging crypto projects to major industry developments.