

- Bitcoin trades at $77,786 (+1.64% 24h) as CryptoQuant overlays three post-midterm BTC cycles
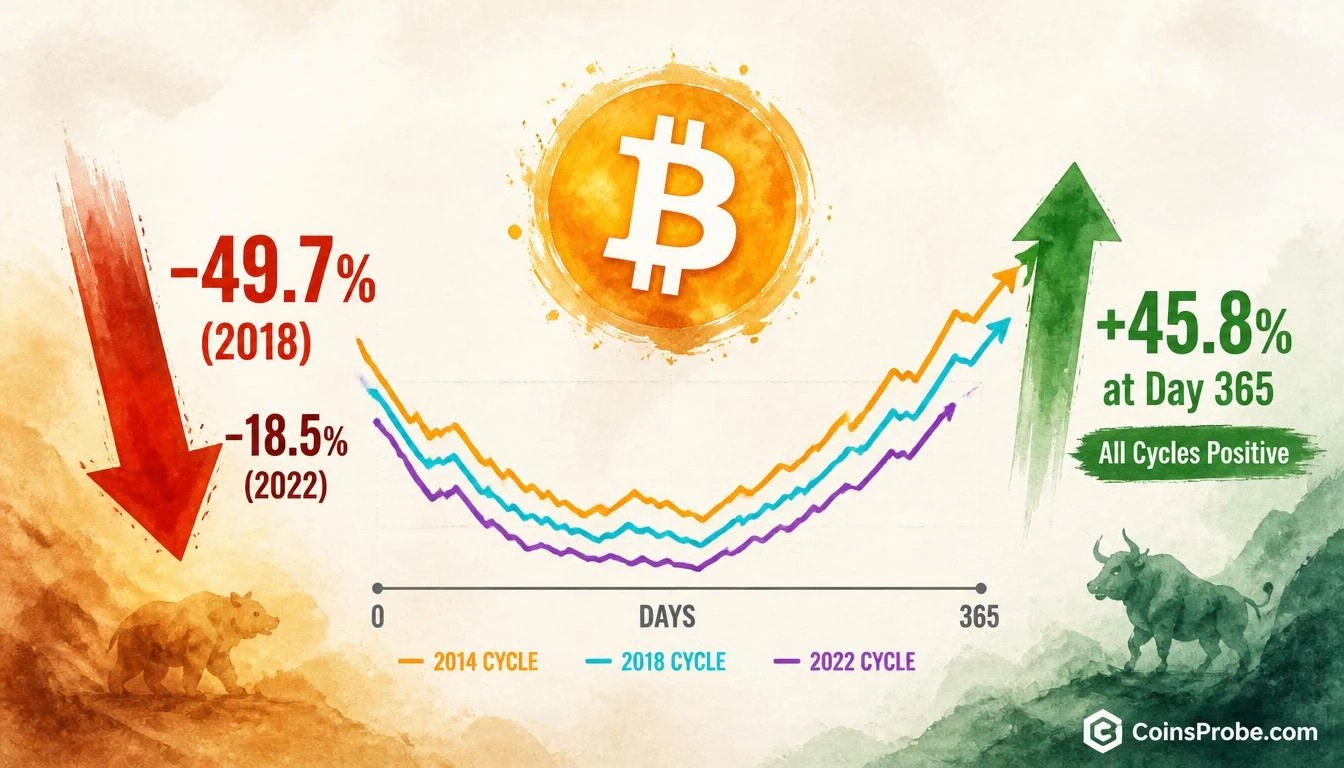
- Deepest midterm drops: −49.7% (2018), −39.8% (2014), −18.5% (2022 FTX week) — all recovered positive by day 365
- 2018 cycle, the worst drawdown of the three, ended +45.8% one year after the midterm low
- Key demand level to watch: $76,800 — where Bitcoin's last recovery attempt stalled
Bitcoin is trading at $77,786 — up 1.64% in the past 24 hours — as a CryptoQuant analysis resurfaces one of the most uncomfortable facts about midterm-year Bitcoin cycles: the recovery was never clean, and the deepest pain often preceded the largest gains.
An analyst at CryptoQuant published a chart overlaying Bitcoin’s post-midterm drawdown trajectories across three separate cycles — 2014, 2018, and 2022 — measured in days from the cycle’s midterm low. The finding is stark: every cycle produced a severe near-term decline before staging a full-year recovery, with all three lines ultimately closing above the zero baseline by the end of the 365-day window.
The Drawdowns — Exactly How Bad Each Cycle Got
The chart does not smooth the data. Each cycle’s sharpest drop is labeled explicitly, and the numbers are severe. In 2018, Bitcoin fell −49.7% within approximately six weeks of the midterm reference point. In 2014, the drawdown reached −39.8% within roughly ten weeks. The 2022 cycle recorded the shallowest initial drop at −18.5% — but that two-week window coincided directly with the FTX collapse, one of the most concentrated bouts of forced selling in crypto’s history.
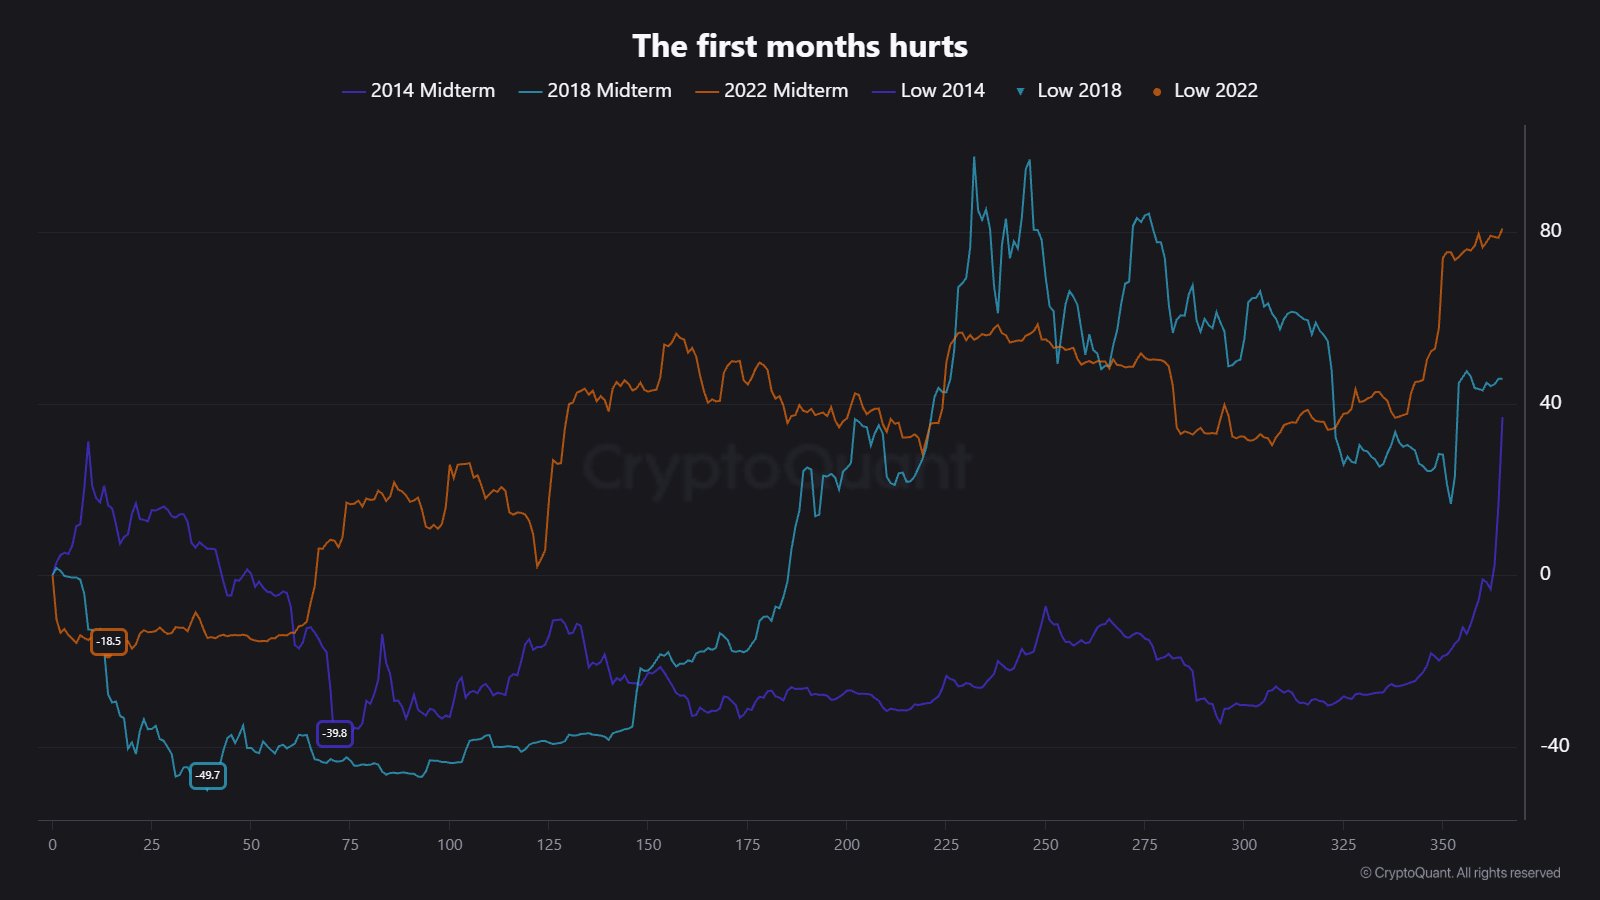
What the chart also shows is the shape of recovery: all three cycles follow a U/J-shaped trajectory. The 2018 cycle dips deepest and recovers most aggressively. The 2022 cycle shows the shallowest initial drop but a steady grind higher. The 2014 cycle traces a prolonged mid-range consolidation before eventually crossing back above zero. By day 365, every line is positive.
The 2018 Case — The Hardest Drop, the Strongest Full-Year Result
The most important data point in the CryptoQuant analysis is the 2018 outcome. Despite the −49.7% drawdown in the first six weeks — a drop that would have felt catastrophic to anyone holding at the top — Bitcoin ended the full 12-month window up +45.8% from the midterm low. That is not a marginal recovery. It is a complete regime reversal in the same calendar year.
This matters because 2018 is the cycle most investors cite when discussing Bitcoin bear markets. The FUD was peak severity. The narrative was that crypto was finished. The on-chain reality, as CryptoQuant’s historical overlay now shows, was that the worst drawdown preceded the best outcome among the three cycles charted.
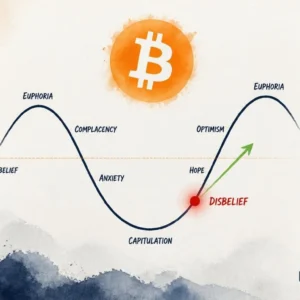
It is worth placing current market conditions in this framework. Bitcoin has been flagged by on-chain analysts as sitting in the disbelief phase, a stage historically associated with bottoming behavior rather than trend continuation to the downside. The CryptoQuant midterm cycle data adds a structural layer to that observation: post-midterm periods have never, across three cycles, failed to produce a positive 12-month return from the drawdown low.
What the Chart Confirms — and What It Does Not
The CryptoQuant analysis makes three things clear. First, post-midterm drawdowns are a documented feature of Bitcoin’s cycle, not an anomaly. Second, the depth of that drawdown has not historically predicted the direction of the 12-month outcome — 2018’s worst drop produced a positive full-year return. Third, all three cycles reached their lowest point well before the halfway mark of the 365-day window, meaning the second half of each cycle was characterized by recovery rather than continued decline.
What the analysis does not state is a price target, a support level, or a projection for the current cycle. CryptoQuant presents this as historical context, not a forward model. The 2026 midterm cycle may diverge — no three-cycle sample guarantees a fourth outcome. What it does establish is a base rate: across every comparable historical window, Bitcoin recovered above its midterm reference level within one year.
Stablecoin liquidity conditions also remain a factor worth monitoring. Recent data has shown stablecoin market cap under pressure, which historically constrains the velocity of recovery rallies. And on the demand side, Bitcoin’s recent rebound faded at $76,800 amid weak demand signals — a reminder that the historical pattern provides context, not a guarantee of trajectory.
Three Cycles, One Consistent Outcome
Across 2014, 2018, and 2022, the post-midterm playbook for Bitcoin has been identical in structure: sharp early pain, prolonged uncertainty, full-year recovery. The magnitude differs — 2018’s −49.7% dwarfs 2022’s −18.5% — but the directional outcome does not. All three cycles closed positive at the 365-day mark.
At $77,786, Bitcoin is trading in the zone where prior cycles have historically established the foundation for that recovery. The CryptoQuant data does not say the bottom is confirmed today. What it says is that in every comparable cycle, the investors who exited during the sharp early drawdown missed the full-year return. The 2018 cycle, the most painful of the three, produced +45.8% for those who held through it.
The level to watch remains $76,800, where demand last stalled. A sustained reclaim of that zone with volume would begin to replicate the recovery trajectories visible across all three historical cycles in the CryptoQuant overlay.
Frequently Asked Questions
How deep did Bitcoin drop after each midterm vote historically?
Did Bitcoin always recover within one year of a midterm cycle low?
Does a severe post-midterm drawdown predict a weaker full-year recovery?
What price level is Bitcoin watching now after the CryptoQuant midterm analysis?
Source: CryptoQuant · Published by CoinsProbe Markets Desk
The opinions and market insights shared on CoinsProbe represent the views of individual authors based on prevailing market conditions at the time of publication. Cryptocurrency investments carry significant risk and volatility. Readers are encouraged to conduct their own research and seek professional financial advice before making investment decisions. CoinsProbe and its contributors do not accept responsibility for financial losses or decisions made based on published content.
CoinsProbe may publish sponsored articles, affiliate links, or promotional collaborations. All sponsored material is clearly labeled to maintain transparency with our audience. Our editorial decisions remain fully independent, and advertising partnerships do not influence reviews, rankings, or published opinions.
Since 2023, CoinsProbe has delivered reliable insights on cryptocurrency, blockchain, and digital assets. Our content is created by experienced researchers and analysts who follow strict editorial standards focused on accuracy, transparency, and credibility. Every article is carefully reviewed and verified using trusted sources and current market data. We provide unbiased analysis and timely updates covering everything from emerging crypto projects to major industry developments.