
- Bitcoin trading at $82,113 (+1.22% 24h) — bouncing from $80,409 intraday low, near critical $80.4K trendline
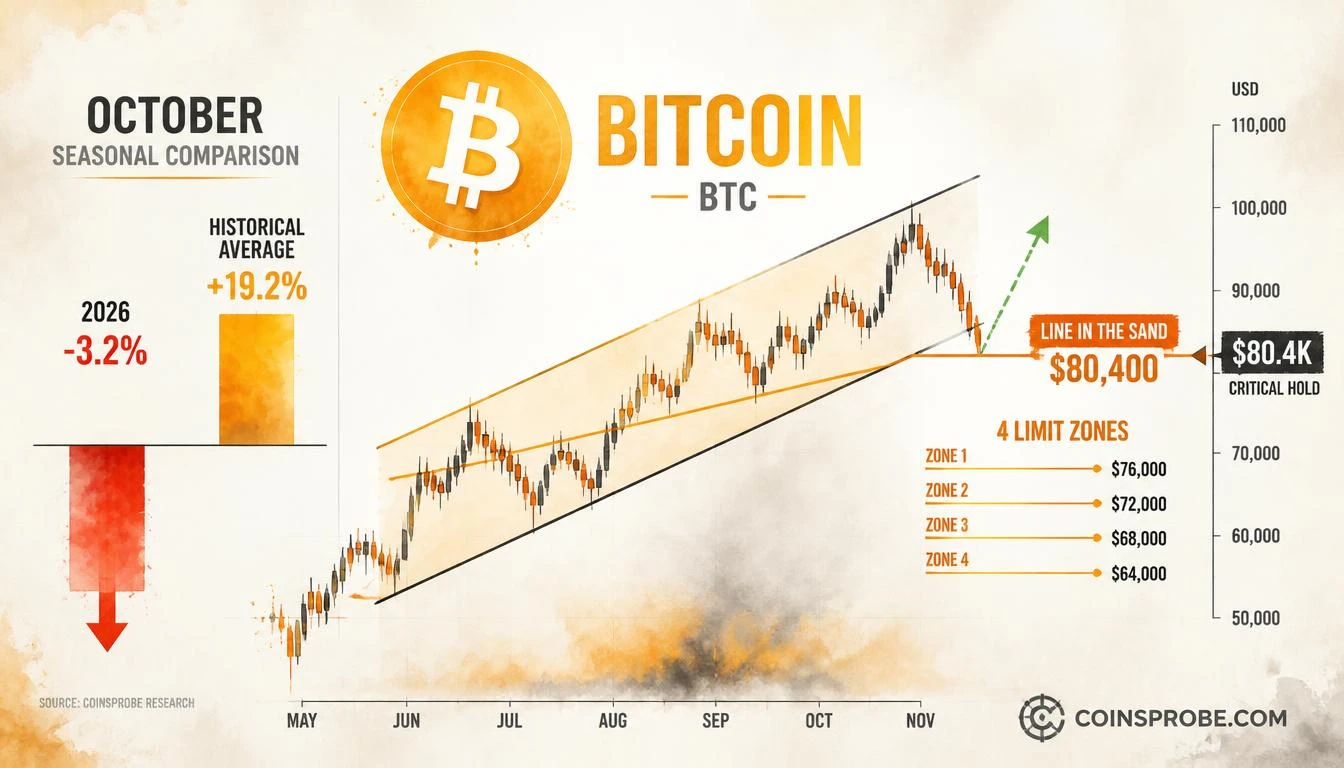
- @coinjuicehq via CryptoQuant flags $80.4K rising trendline as "the line in the sand" for Bitcoin's current structure
- October 2026 tracking -3.2% at mid-month vs. historical average of +6.7% — only 2018 (-4.7%) was worse at this point
- Historical full-month October average (2013–2025): +19.2%; daily close below $80.4K breaks the bullish channel structure
Bitcoin is trading at $82,113 — up 1.22% in the past 24 hours — with a market cap of approximately $1.65 trillion. Beneath the surface, a more important number is in play: $80,400, a rising trendline support that CryptoQuant analyst @coinjuicehq describes as “the line in the sand.”
In a CryptoQuant Quicktake published on October 16, 2026 and amplified by @cryptoquant_com, the analyst flags Bitcoin’s mid-October underperformance against historical seasonal norms — while isolating the $80.4K trendline as the structural level that separates a recoverable pullback from a deeper breakdown. The note carries a specific context: 2026’s October is running well below historical precedent at the mid-month mark, and the support trendline near $80.4K is where the market is being asked to answer.
Signal 1 — October 2026 Is Lagging Every Historical Benchmark
The first chart shared by @cryptoquant_com maps Bitcoin’s 2026 October performance against every October from 2013 through 2025, measured in 3-day increments from October 1 through October 31. The divergence by mid-month is stark.
As of the October 15 intraday session, Bitcoin’s October return stood at approximately -3.2% — against a historical mid-October average of +6.7%. The full-month historical average across 2013–2025 is +19.2%. To anchor how unusual 2026 is: even 2022, which occurred during a bear market year, posted +5.9% by mid-October. Only 2018 — at -4.7% — tracked in negative territory at this same point.
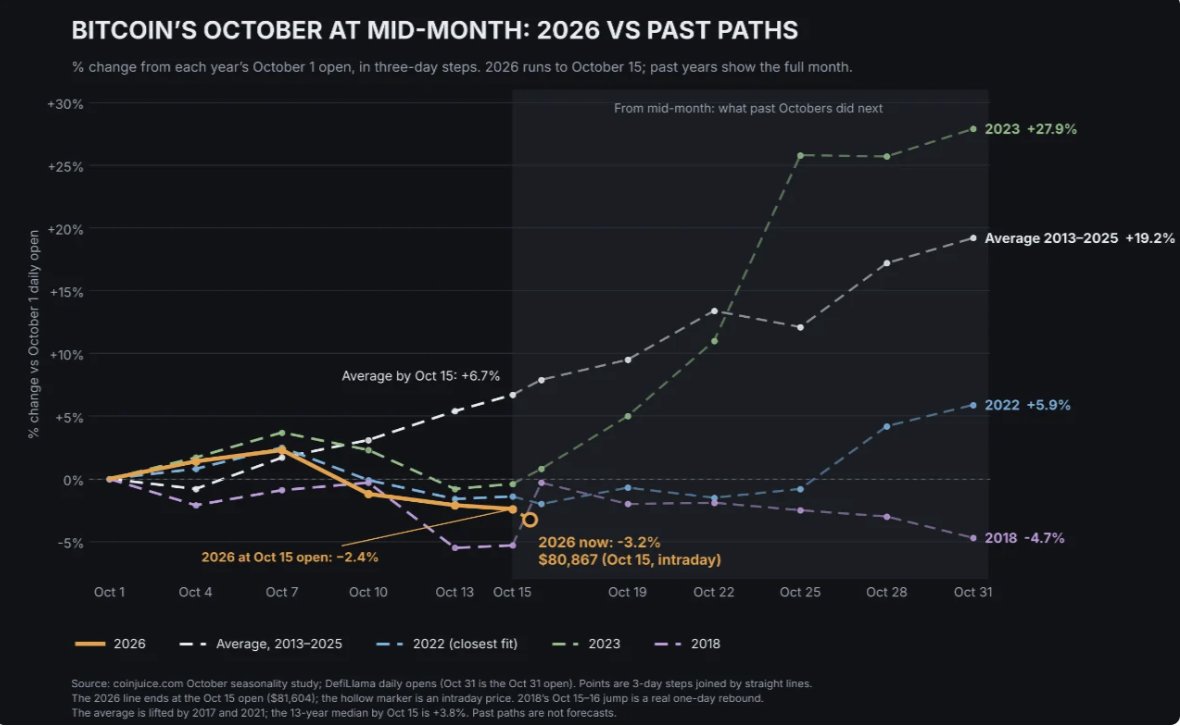
The seasonal chart’s shaded right portion shows what past Octobers did after the mid-month mark — a recovery pattern across most years. Whether 2026 follows that trajectory depends entirely on whether the $80.4K trendline holds.
Signal 2 — The $80.4K Trendline: Structure, Not Just a Number
The second chart is a Bitcoin 4-hour view showing a rising ascending-wedge containing price action — followed by a breakdown. The chart explicitly labels multiple support zones below the current price, identified as “limit 1,” “limit 2,” “limit 3,” and “limit 4” — successive downside targets in the event of a trendline breach.
At the time @coinjuicehq published the note, the 4-hour chart showed Bitcoin printing an intraday low of $80,409.09 — within dollars of the stated $80.4K trendline. The analyst’s precise language — “line in the sand” — signals this is not a cluster of historical highs being watched as resistance, but a rising trendline that defines the bullish channel structure itself. A daily close below it would break the geometric structure that has contained this phase of Bitcoin’s price action.
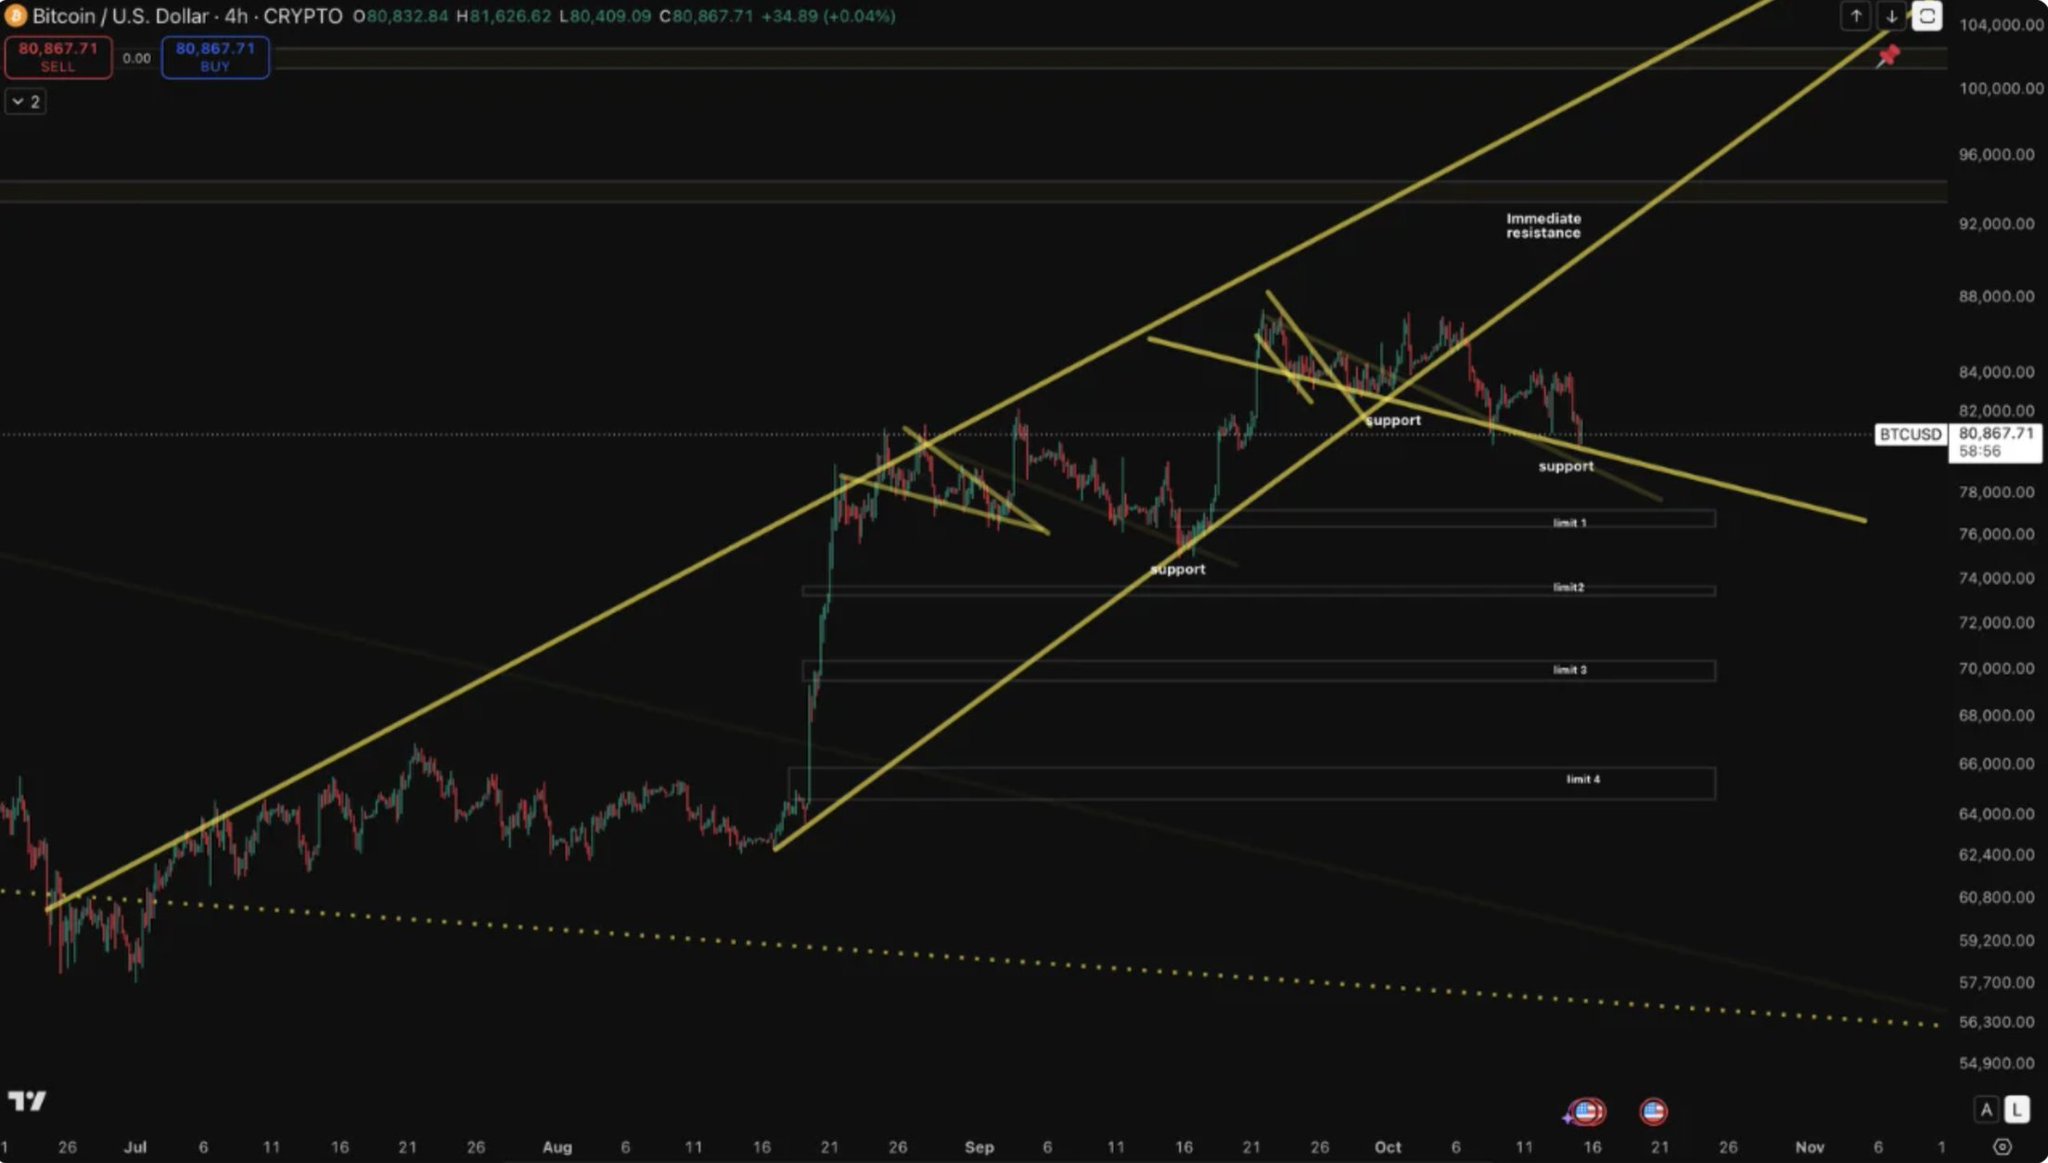
It is worth noting the current price of $82,113 represents a bounce of approximately +2.1% from that intraday low of $80,409 — suggesting the trendline held on the initial test. Whether that hold is durable is what the coming sessions will determine. This mirrors the kind of high-stakes positioning recently flagged by other large-scale actors: one address currently holds $186.7M in max-leverage BTC and ETH longs on Hyperliquid, illustrating the concentrated conviction bets being placed around this range.
Why This Level Matters Beyond the Chart
The $80.4K level is not an arbitrary round number or a historical high/low. It is the intersection of a rising trendline — meaning its exact price value moves higher over time. That dynamic matters: a hold at $80.4K today does not guarantee the same trendline protects price at $80.4K next week. The defense must happen now, at current coordinates.
The seasonal underperformance context adds weight to the test. Historical October data shows that years where Bitcoin entered the second half of October in negative territory — like 2018’s -4.7% at mid-month — did not always recover to match the historical average. 2018 closed October deeply negative. 2026 is currently tracking that trajectory, not the +27.9% of 2023 or the full-month +19.2% average.
Separately, Hut 8 recently moved 1,589 BTC ($130M) to exchanges — representing 15% of its $845.6M treasury — a miner behavior signal that adds to the near-term supply pressure context around this support test.
Bullish Scenario — $80.4K Holds and October Recovers
If the $80.4K rising trendline holds on a closing basis — confirmed by daily candles sustaining above it — the setup mirrors historical post-mid-October recoveries seen in 2023 (+27.9% full month) and the broad 2013–2025 average (+19.2%). A reclaim of the upper channel boundary and the “immediate resistance” zone flagged on the 4-hour chart would be the confirmation signal for trend continuation.
Bearish Scenario — Loss of $80.4K Opens Successive Limit Zones
A sustained daily close below $80.4K breaks the rising channel structure and activates the four labeled limit zones visible on the 4-hour chart. The analyst’s framing of this as “the line in the sand” implies no ambiguity: loss of this trendline shifts the structure from bullish channel to breakdown. The first labeled limit zone below suggests an immediate extension toward the high-$70,000s, consistent with the 2018 October precedent where mid-month negative performance compounded into a full-month decline.
The One Metric to Watch
@coinjuicehq’s analysis reduces a complex seasonal and technical picture to a single actionable coordinate: $80,400. Daily closing prices are the relevant measure — intraday wicks below a trendline are routine noise. A daily close below $80.4K is the event that changes the structural read. Meanwhile, Bitcoin’s delta growth rate has shown early signs of recovery at -0.05 — a secondary data point that would need to strengthen materially to corroborate a bullish trendline hold.
At the time of writing, Bitcoin is trading at $82,113 — approximately +2.1% above the $80.4K line in the sand. The bounce from the $80,409 intraday low is the first answer. The next daily close is the real one. October’s historical recovery pattern is available — but it requires the trendline to survive.
Watch $80,400 on a daily closing basis. That level is the difference between a recoverable seasonal lag and a structural breakdown.
Frequently Asked Questions
What happens to Bitcoin if $80,400 breaks on a daily close?
Why is Bitcoin’s October 2026 performance considered weak by historical standards?
Is the $80.4K level a fixed support or does it move over time?
What does it mean that Bitcoin bounced from $80,409 intraday?
Source: CryptoQuant · Published by CoinsProbe Markets Desk
The opinions and market insights shared on CoinsProbe represent the views of individual authors based on prevailing market conditions at the time of publication. Cryptocurrency investments carry significant risk and volatility. Readers are encouraged to conduct their own research and seek professional financial advice before making investment decisions. CoinsProbe and its contributors do not accept responsibility for financial losses or decisions made based on published content.
CoinsProbe may publish sponsored articles, affiliate links, or promotional collaborations. All sponsored material is clearly labeled to maintain transparency with our audience. Our editorial decisions remain fully independent, and advertising partnerships do not influence reviews, rankings, or published opinions.
Since 2023, CoinsProbe has delivered reliable insights on cryptocurrency, blockchain, and digital assets. Our content is created by experienced researchers and analysts who follow strict editorial standards focused on accuracy, transparency, and credibility. Every article is carefully reviewed and verified using trusted sources and current market data. We provide unbiased analysis and timely updates covering everything from emerging crypto projects to major industry developments.