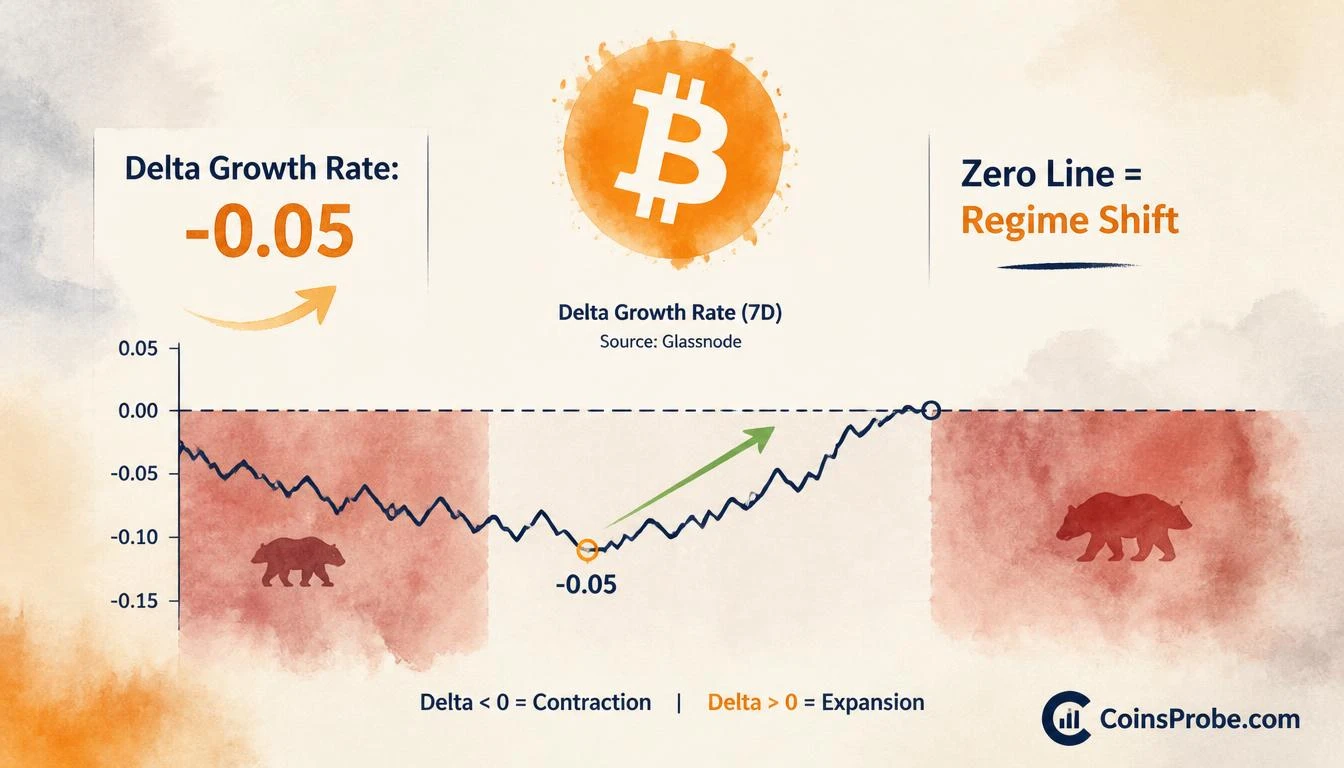

- Bitcoin trades at $82,156 (+1.29% 24h) as its Delta Growth Rate recovers from -0.05 — the shallowest bear-cycle negative reading on record
- Alphractal identifies recovery underway since July 2026, but flags it as insufficient for confirmed structural trend reversal
- Delta Growth Rate crossing from negative to positive territory is the on-chain threshold separating bear market bounce from bull market onset
- Shallow -0.05 reading contrasts sharply with -0.4 troughs seen in 2018 and 2022 bear cycles
Bitcoin is trading at approximately $82,156 — up 1.29% in the past 24 hours — with a market capitalization of $1.65 trillion. Beneath the surface, a key on-chain momentum metric is quietly flashing one of the earliest structural recovery signals seen since this bear phase began.
On-chain analytics platform Alphractal (@Alphractal) published an analysis on October 15, 2026 identifying a notable shift in Bitcoin’s Delta Growth Rate — a composite metric that measures divergences between Market Cap growth and Realized Cap growth. The current reading stands at -0.05, the shallowest negative print in the current bear cycle, with recovery underway since July 2026.
What the Delta Growth Rate Actually Measures
Before citing the reading, the mechanism matters. The Delta Growth Rate is not a price-derived oscillator. It does not measure sentiment or trading volume. It combines two distinct on-chain growth rates — the rate at which Bitcoin’s Market Cap is expanding (reflecting speculative price appreciation) and the rate at which its Realized Cap is expanding (reflecting actual on-chain accumulation at current prices).
When Market Cap growth outpaces Realized Cap growth — meaning price rises faster than coins are actually being accumulated at higher cost basis levels — the delta turns positive, signaling speculative excess. When the inverse occurs — when price appreciation slows or reverses while accumulation fails to keep pace — the delta turns negative, historically corresponding to phases of undervaluation, reduced speculation, and compressed on-chain activity.
According to Alphractal’s analysis, negative Delta Growth Rate readings have historically corresponded to periods of weaker speculation, reduced accumulation, and relative undervaluation. These are the conditions that, when resolved, have preceded structural bull market resumptions in prior cycles.
Current Reading — -0.05: Shallow Dip, Not Deep Capitulation
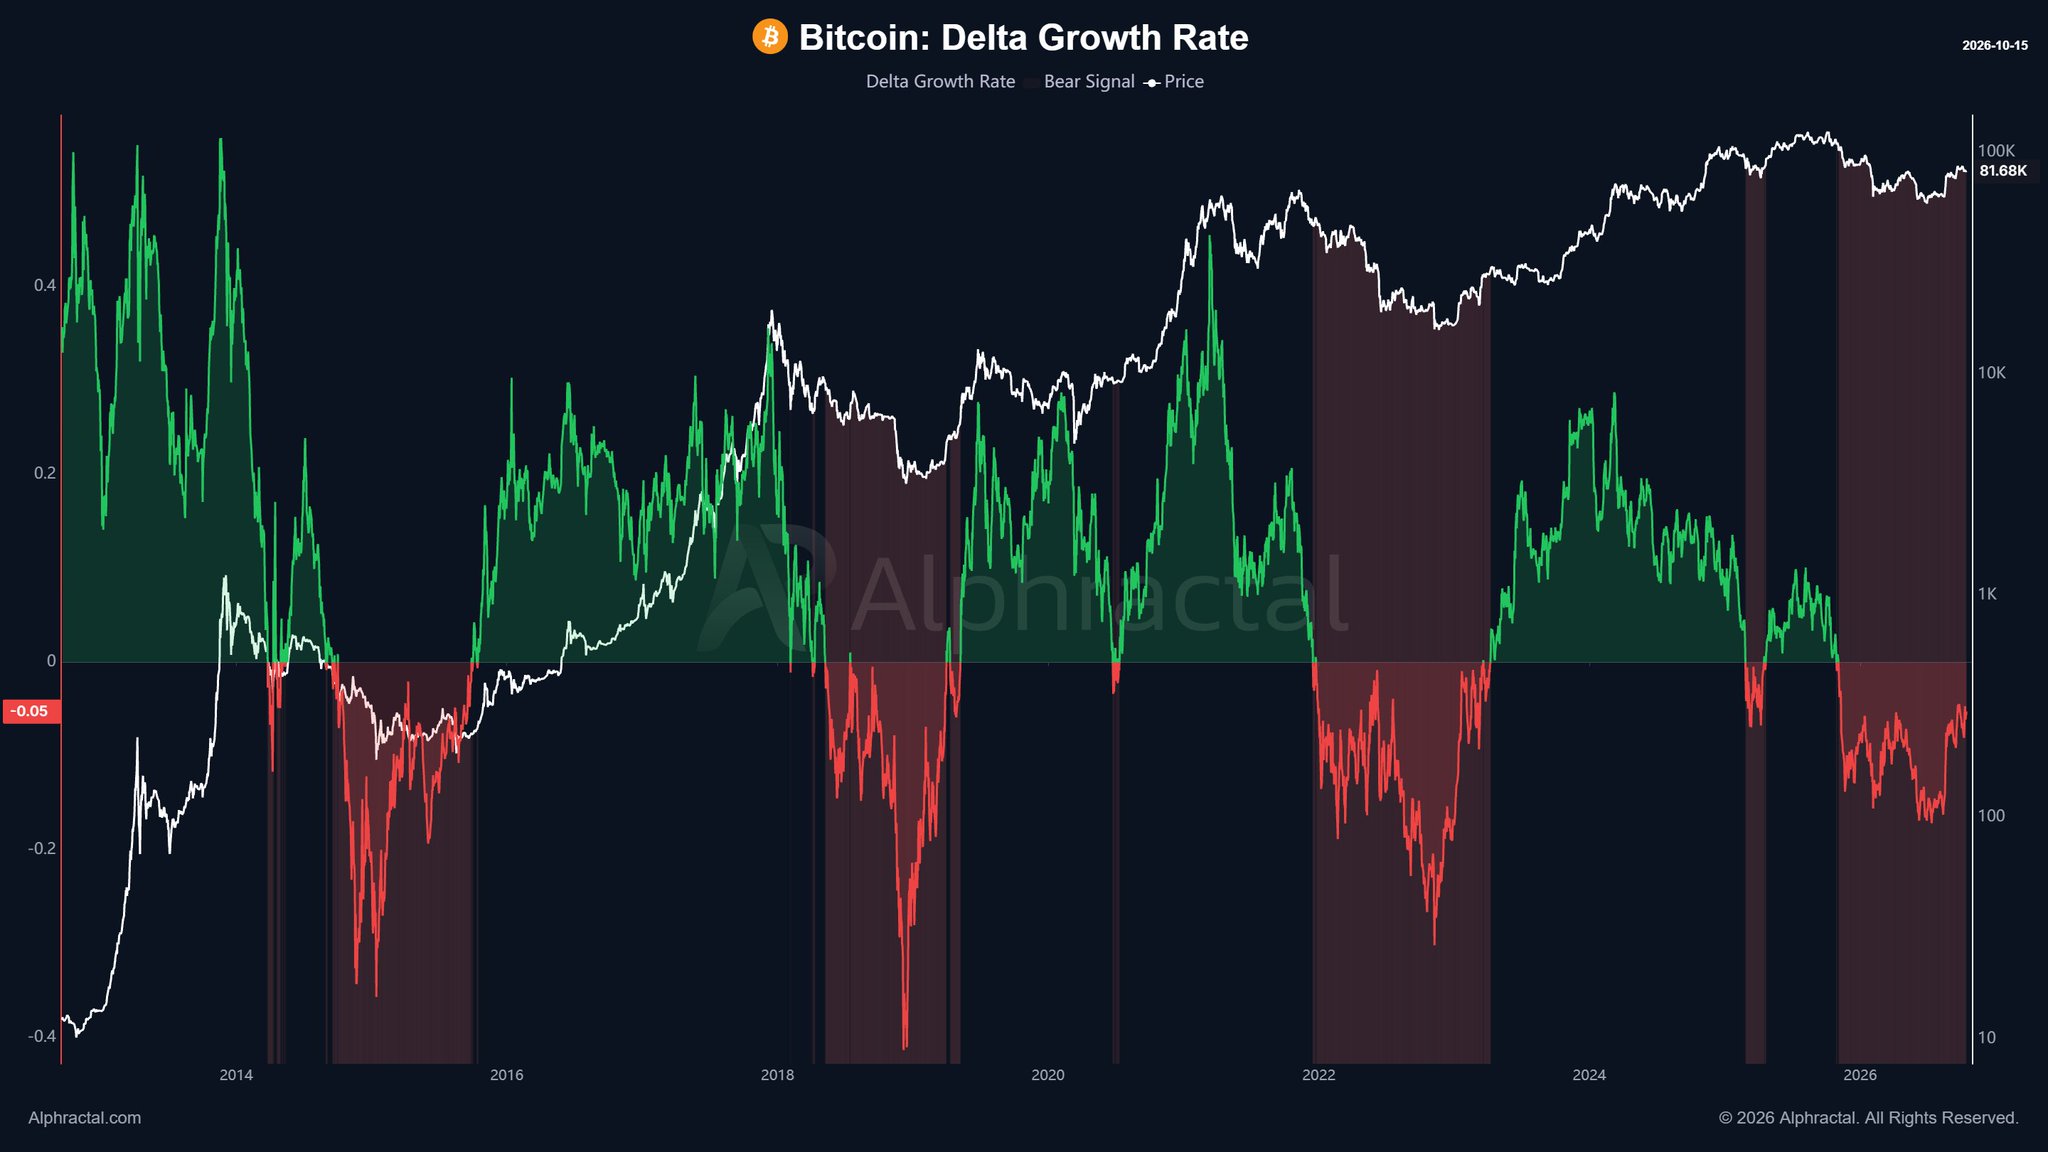
The multi-year chart shared by Alphractal maps the Delta Growth Rate across Bitcoin’s full market history from 2013 through 2026. The oscillator moves between approximately +0.4 (peak speculative excess) and -0.4 (deep bear capitulation). Dark red shaded zones mark periods when the indicator is negative — each corresponding to a confirmed Bitcoin bear market.
The critical context: the current reading of -0.05 sits just fractionally below the zero line. Compared to the deep negative readings seen during the 2018 bear market (which extended to the -0.4 region) or the 2022 cycle low, the current dip is structurally shallow. Alphractal identifies this as a potentially significant distinction — a shallow negative reading that is already recovering suggests the market did not experience the kind of deep speculative unwind that historically extends bear phases.
The recovery has been underway since July 2026, per Alphractal’s published timeline. That is roughly three and a half months of on-chain momentum rebuilding — not a single-session spike, but a sustained directional shift in the relationship between market cap growth and realized cap growth.
The Open Question — Can It Reach Positive Territory?
Alphractal stops short of declaring a structural trend reversal. The analysis explicitly notes that the current recovery, while encouraging, is insufficient for a confirmed structural trend reversal. The operative question the analysis poses: does the Delta Growth Rate continue recovering until it crosses back into positive territory?
This distinction matters. A reading that recovers from -0.05 toward zero but stalls or reverses is historically consistent with a bear market continuation — a temporary relief phase rather than a regime change. A reading that pushes through zero and sustains in positive territory has, in prior cycles, corresponded to the onset of the next sustained bull phase. Alphractal does not predict which outcome occurs — it identifies the metric as the thing to watch.
For broader context on Bitcoin’s technical positioning around key levels, Bitcoin: $84,000 Is the Line — A 4-Hour Close Above It Unlocks the Next Rally outlines the price-level framework that would complement an on-chain recovery narrative. Additionally, broader analyst sentiment is tracked in CryptoQuant Analyst Consensus: BTC 82.5% Bullish — where 82.5% of surveyed CryptoQuant analysts hold a bullish view on Bitcoin at current levels.
Historical Precedent — What Shallow Negative Readings Have Preceded
The multi-year chart reveals a consistent pattern: every sustained Bitcoin bull market has been preceded by a period when the Delta Growth Rate was negative before recovering through zero. The depth of the negative reading varied — the 2018–2019 recovery involved a significantly deeper trough than the current -0.05 — but the directional sequence (negative → recovering → positive) has been present ahead of every major cycle advance.
Alphractal’s implicit analytical framework is that a shallower negative dip, followed by a faster recovery toward zero, could indicate a less severe bear phase and a potentially shorter recovery timeline. This is a structural inference from the chart — not a stated price target — and Alphractal presents it as an open question rather than a concluded thesis.
Bullish Scenario
If the Delta Growth Rate continues its recovery trajectory from -0.05 and crosses into positive territory, the on-chain structure would confirm the kind of regime transition that, in prior cycles, preceded sustained bull market phases. A positive reading would indicate that Realized Cap growth is once again lagging Market Cap growth — meaning actual coin accumulation at higher prices is beginning to validate speculative price moves. Combined with Bitcoin holding above the $82,000 zone, this would represent a structurally significant shift in on-chain momentum.
Bearish Scenario
If the Delta Growth Rate stalls in negative territory — recovering toward zero but failing to cross it — the current price strength would remain unconfirmed at the on-chain level. A reversal back toward -0.2 or deeper would indicate that the current bear phase is not yet resolved, structurally consistent with the patterns seen in 2018 and 2022 where temporary price relief did not coincide with genuine Realized Cap expansion. In that scenario, the recovery underway since July 2026 would be classified as a bear market bounce, not a regime change.
The Level and the Metric to Watch
There is no price target embedded in Alphractal’s analysis — and it would be inaccurate to manufacture one from the chart. What the analysis does provide is a clear metric and a clear threshold: the Delta Growth Rate crossing from negative to positive. That crossover has, in every prior cycle documented on the chart, been the on-chain event that separated bear market recovery from genuine bull market onset.
Bitcoin is currently trading at $82,156. The Delta Growth Rate sits at -0.05 and has been recovering since July 2026. Whether that recovery completes — or stalls — is the question Alphractal’s framework is designed to answer in real time. A sustained cross above zero in the Delta Growth Rate, combined with price holding above current levels, would represent the on-chain confirmation that the current recovery is structural, not cyclical relief. Watch the Delta Growth Rate zero line.
Frequently Asked Questions
What is Bitcoin’s Delta Growth Rate and why does -0.05 matter?
When did Bitcoin’s Delta Growth Rate start recovering and from what level?
Does a recovering Delta Growth Rate confirm Bitcoin’s bull market has resumed?
How does the current Delta Growth Rate compare to prior Bitcoin bear markets?
Source: Alphractal · Published by CoinsProbe Markets Desk
The opinions and market insights shared on CoinsProbe represent the views of individual authors based on prevailing market conditions at the time of publication. Cryptocurrency investments carry significant risk and volatility. Readers are encouraged to conduct their own research and seek professional financial advice before making investment decisions. CoinsProbe and its contributors do not accept responsibility for financial losses or decisions made based on published content.
CoinsProbe may publish sponsored articles, affiliate links, or promotional collaborations. All sponsored material is clearly labeled to maintain transparency with our audience. Our editorial decisions remain fully independent, and advertising partnerships do not influence reviews, rankings, or published opinions.
Since 2023, CoinsProbe has delivered reliable insights on cryptocurrency, blockchain, and digital assets. Our content is created by experienced researchers and analysts who follow strict editorial standards focused on accuracy, transparency, and credibility. Every article is carefully reviewed and verified using trusted sources and current market data. We provide unbiased analysis and timely updates covering everything from emerging crypto projects to major industry developments.