
- Bitcoin trades at $83,702 (+0.88% 24h) with $1.68T market cap as LTH MVRV holds above 1.0
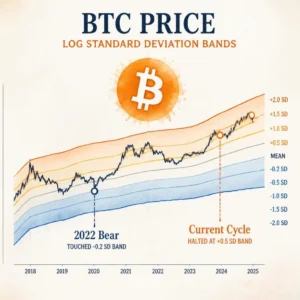
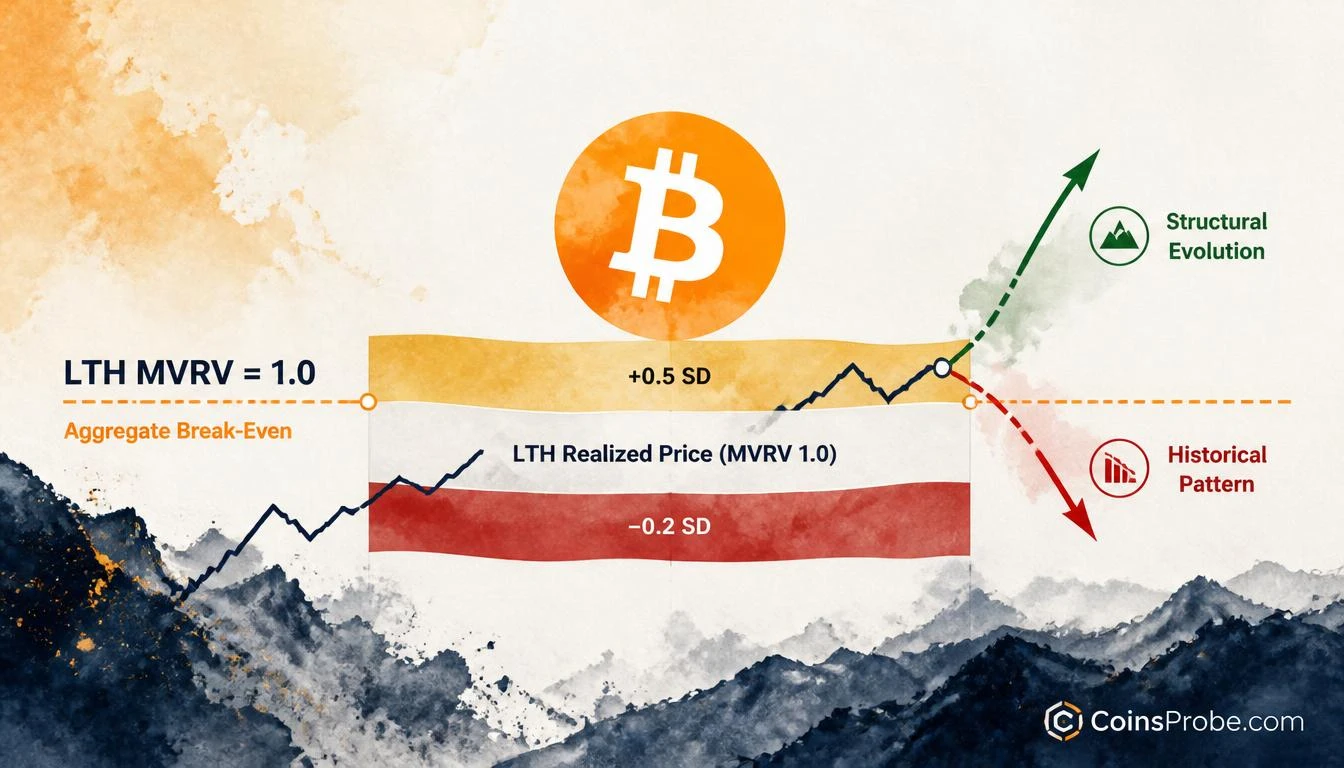
- Alphractal flags that BTC's LTH cohort found support at the +0.5 SD band above LTH Realized Price — unlike 2022, when price fell to the −0.2 SD band below it
- LTH MVRV breaking below 1.0 would signal historical bear pattern reasserting; holding above sustains structural evolution thesis
- The −0.2 SD band below LTH Realized Price marked the 2022 capitulation floor near $15,500 — not yet approached in this cycle
Bitcoin is trading at $83,702 — up 0.88% in the past 24 hours — with a market capitalization of $1.68 trillion. Beneath the surface, a structural question is forming on-chain: is Bitcoin in the process of breaking a pattern that has defined every major bear cycle since 2018?
On-chain analytics platform Alphractal (@Alphractal) raised that question in an October 11, 2026 post, pointing to the behavior of Long-Term Holder (LTH) MVRV relative to its realized price bands. The observation is not a trading call — it is a structural one: this cycle’s LTH cohort may be avoiding the aggregate unrealized loss territory that has historically defined Bitcoin bear market bottoms.
What LTH MVRV Actually Measures
Before assessing the signal, the metric requires precise definition. The LTH Realized Price is the average acquisition cost of all Bitcoin held by long-term holders — wallets that have not moved coins in at least 155 days. The LTH MVRV ratio compares the current market price to that realized price. A reading below 1.0 means the aggregate LTH cohort is, on net, holding unrealized losses — they paid more, in aggregate, than the current market price reflects.
In prior bear cycles, a sustained LTH MVRV reading below 1.0 was not incidental — it was the structural signature of the bottom. In the 2022 bear market, Bitcoin’s price fell to the −0.2 standard deviation band below the LTH Realized Price, which marked the deepest aggregate unrealized loss zone and coincided with the generational low near $15,500. That band has served as a gravitational floor in every major cycle drawdown Alphractal references.
The 2026 Anomaly — LTHs Staying Above Water
What Alphractal flags in this cycle is a departure from that established pattern. During the current correction — which brought Bitcoin from its cycle high down through the $70,000–$80,000 range — the LTH MVRV has not broken below the 1.0 threshold into aggregate loss territory. Instead, the metric found support near the +0.5 standard deviation band above the LTH Realized Price.
That is a materially different structural outcome than 2022. In prior cycles, corrections of comparable magnitude in price terms produced LTH MVRV readings that pushed well below 1.0, forcing long-term holders into unrealized losses and creating the capitulation conditions that mark cycle bottoms. This cycle, the same cohort has not reached that threshold.
Alphractal presents two interpretations for this divergence, and critically, does not resolve between them. The first is that Bitcoin’s market structure has evolved — with a broader and more distributed LTH base, deeper institutional participation, and higher realized prices distributed across a wider range of entry points, the aggregate may simply require less price drawdown to reach the same stress level. The second is more cautionary: the cycle may not yet be complete, and the revisit to LTH Realized Price — and potentially the bands below it — could still be ahead.
The Two Bands That Define the Range
Alphractal’s framework uses standard deviation bands around the LTH Realized Price as structural zones rather than arbitrary price levels. The relevant zones from the analysis are:
| Band | Historical Role | 2022 Behavior | 2026 Behavior |
|---|---|---|---|
| −0.2 SD below LTH Realized Price | Bear market capitulation floor | Bitcoin touched this zone (~$15,500 low) | Not reached in current correction |
| LTH Realized Price (MVRV = 1.0) | Aggregate break-even threshold | Breached decisively in 2022 | Has held as support so far |
| +0.5 SD above LTH Realized Price | Correction support in bull cycles | Not relevant at 2022 lows | Served as correction floor in 2026 |
LTH MVRV Band Framework | Source: Alphractal
The distinction matters. If the +0.5 SD band continues to hold as support, it would represent a structurally higher floor than any prior cycle — consistent with the thesis that Bitcoin’s LTH base has matured. If it fails and price gravitates toward the LTH Realized Price or below, the historical pattern reasserts itself.
Why This Question Has No Clean Answer Yet
Alphractal is explicit that this is an observational note, not a directional call. The honest framing of the signal is: the data is consistent with either a structural evolution or an incomplete cycle. That ambiguity is itself informative — it tells analysts where to look rather than what to conclude.
The metric to monitor in real time is LTH MVRV relative to the 1.0 threshold. A sustained hold above 1.0 through continued price consolidation would strengthen the structural evolution thesis. A break below 1.0 — where long-term holders enter aggregate unrealized loss territory — would indicate the historical pattern is reasserting and would revive the case for a deeper correction leg. Alphractal’s full interactive metric suite is available at Alphractal.com.
For context on broader on-chain positioning, Bitcoin’s exchange netflow has remained deeply negative on its 30-day SMA — a separate structural signal that has historically preceded supply squeezes.
Bullish Scenario
LTH MVRV holds above 1.0 and the +0.5 SD band continues to serve as a correction floor. This would confirm the structural evolution thesis — that Bitcoin’s long-term holder base has matured sufficiently to sustain a higher aggregate realized price floor without requiring a full capitulation cycle. Price consolidation above current levels while the metric holds would strengthen this reading.
Bearish Scenario
LTH MVRV breaks below 1.0, placing the aggregate LTH cohort in unrealized loss territory. This would signal the historical pattern is not broken but merely delayed — and would open the path toward the −0.2 SD band below LTH Realized Price, the zone that defined the 2022 capitulation floor. Alphractal explicitly does not rule out a revisit to LTH Realized Price.
Bitcoin at $83,702 sits at a juncture that on-chain metrics define more precisely than price action alone. The LTH MVRV signal Alphractal identifies is not a buy or sell instruction — it is a structural diagnostic. Every prior bear cycle required long-term holders to absorb aggregate unrealized losses before a durable bottom formed. This cycle, that threshold has not been crossed. Whether that reflects a permanent structural shift or a deferred reckoning is the question the LTH MVRV ratio will answer — and it will answer it in real time. Watch the 1.0 MVRV threshold: a confirmed hold above it sustains the evolution thesis, while a breach below it reopens the historical playbook.
Frequently Asked Questions
What does LTH MVRV below 1.0 mean for Bitcoin?
Why is the +0.5 SD band significant as a support level this cycle?
Is Alphractal’s analysis a buy signal for Bitcoin?
Where can I track Bitcoin’s LTH MVRV in real time?
Source: Alphractal · Published by CoinsProbe Markets Desk
The opinions and market insights shared on CoinsProbe represent the views of individual authors based on prevailing market conditions at the time of publication. Cryptocurrency investments carry significant risk and volatility. Readers are encouraged to conduct their own research and seek professional financial advice before making investment decisions. CoinsProbe and its contributors do not accept responsibility for financial losses or decisions made based on published content.
CoinsProbe may publish sponsored articles, affiliate links, or promotional collaborations. All sponsored material is clearly labeled to maintain transparency with our audience. Our editorial decisions remain fully independent, and advertising partnerships do not influence reviews, rankings, or published opinions.
Since 2023, CoinsProbe has delivered reliable insights on cryptocurrency, blockchain, and digital assets. Our content is created by experienced researchers and analysts who follow strict editorial standards focused on accuracy, transparency, and credibility. Every article is carefully reviewed and verified using trusted sources and current market data. We provide unbiased analysis and timely updates covering everything from emerging crypto projects to major industry developments.