
- Bitcoin trades at $84,094 (+1.31% 24h) as Alphractal flags a major structural divergence in LTH on-chain behavior
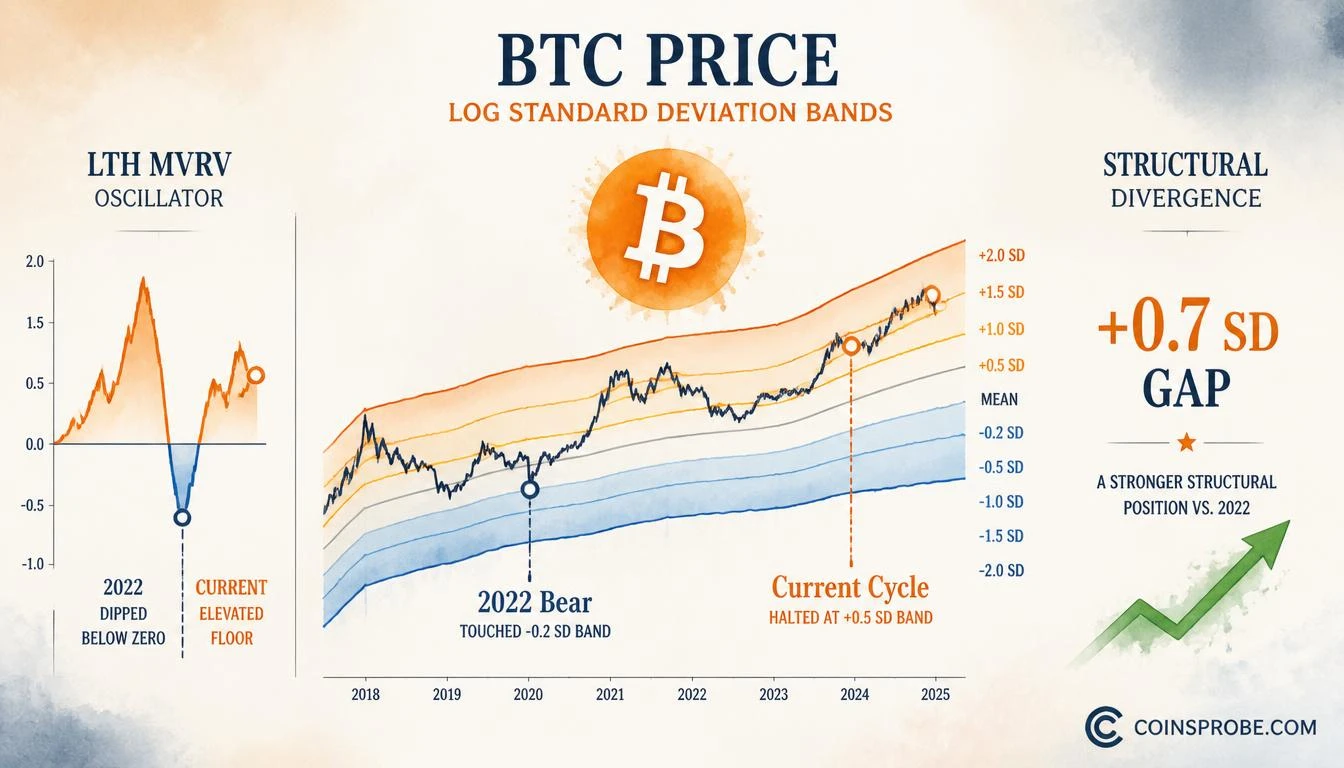
- 2022 bear market drove BTC to −0.2 SD below LTH Realized Price (aggregate loss); current correction held at +0.5 SD above it
- LTH MVRV has not fallen below 1.0 this cycle — potentially the first cycle without long-term holder aggregate losses
- Watch the LTH MVRV oscillator's zero line — a break below would signal reversion to historical bear market structure
Bitcoin is trading at $84,094 — up 1.31% in the past 24 hours — against a market cap of $1.69 trillion. But the number that matters most right now is not the price. It is the standard deviation band where Bitcoin found support during its most recent correction, and how radically different that number is from where support arrived in 2022.
On-chain analytics platform Alphractal (@Alphractal) flagged what may be one of the most structurally significant divergences of this cycle: during the 2022 bear market, Bitcoin collapsed all the way to the −0.2 standard deviation band below the Long-Term Holder (LTH) Realized Price — a level where the aggregate cost basis of every long-term holder was underwater. During the most recent correction in this cycle, Bitcoin found support at the +0.5 standard deviation band above that same reference point. That is a seven-tenths of a standard deviation gap between two corrections, and Alphractal asks directly whether Bitcoin is experiencing its first cycle without long-term holders ever entering aggregate unrealized losses.
What the LTH Realized Price Band Actually Measures
The LTH Realized Price is the on-chain cost basis of all Bitcoin wallets that have held their coins for more than 155 days — the threshold commonly used to define long-term holders. It is not a market price. It is the aggregate acquisition price of Bitcoin’s most patient cohort.
Alphractal extends this metric by plotting standard deviation bands above and below the LTH Realized Price, creating a band structure that functions similarly to Bollinger Bands but anchored to realized on-chain cost — not traded price. The LTH MVRV ratio measures how far the current market price sits above or below that cost basis. An MVRV reading below 1.0 means the average long-term holder is holding at an unrealized loss. A reading above 1.0 means they are in profit.
In 2022, Bitcoin’s price not only fell below the LTH Realized Price — it reached the −0.2 SD band below it, putting the entire LTH cohort into aggregate loss. That condition historically defined Bitcoin bear market capitulation. It is the structural floor that prior cycles were built on.
The 2022 Floor vs. The 2025–2026 Correction — The Divergence
The Alphractal chart covering 2021 through October 2026 makes the structural break visible. The white price line, the MVRV oscillator, and the standard deviation band system are all plotted together.
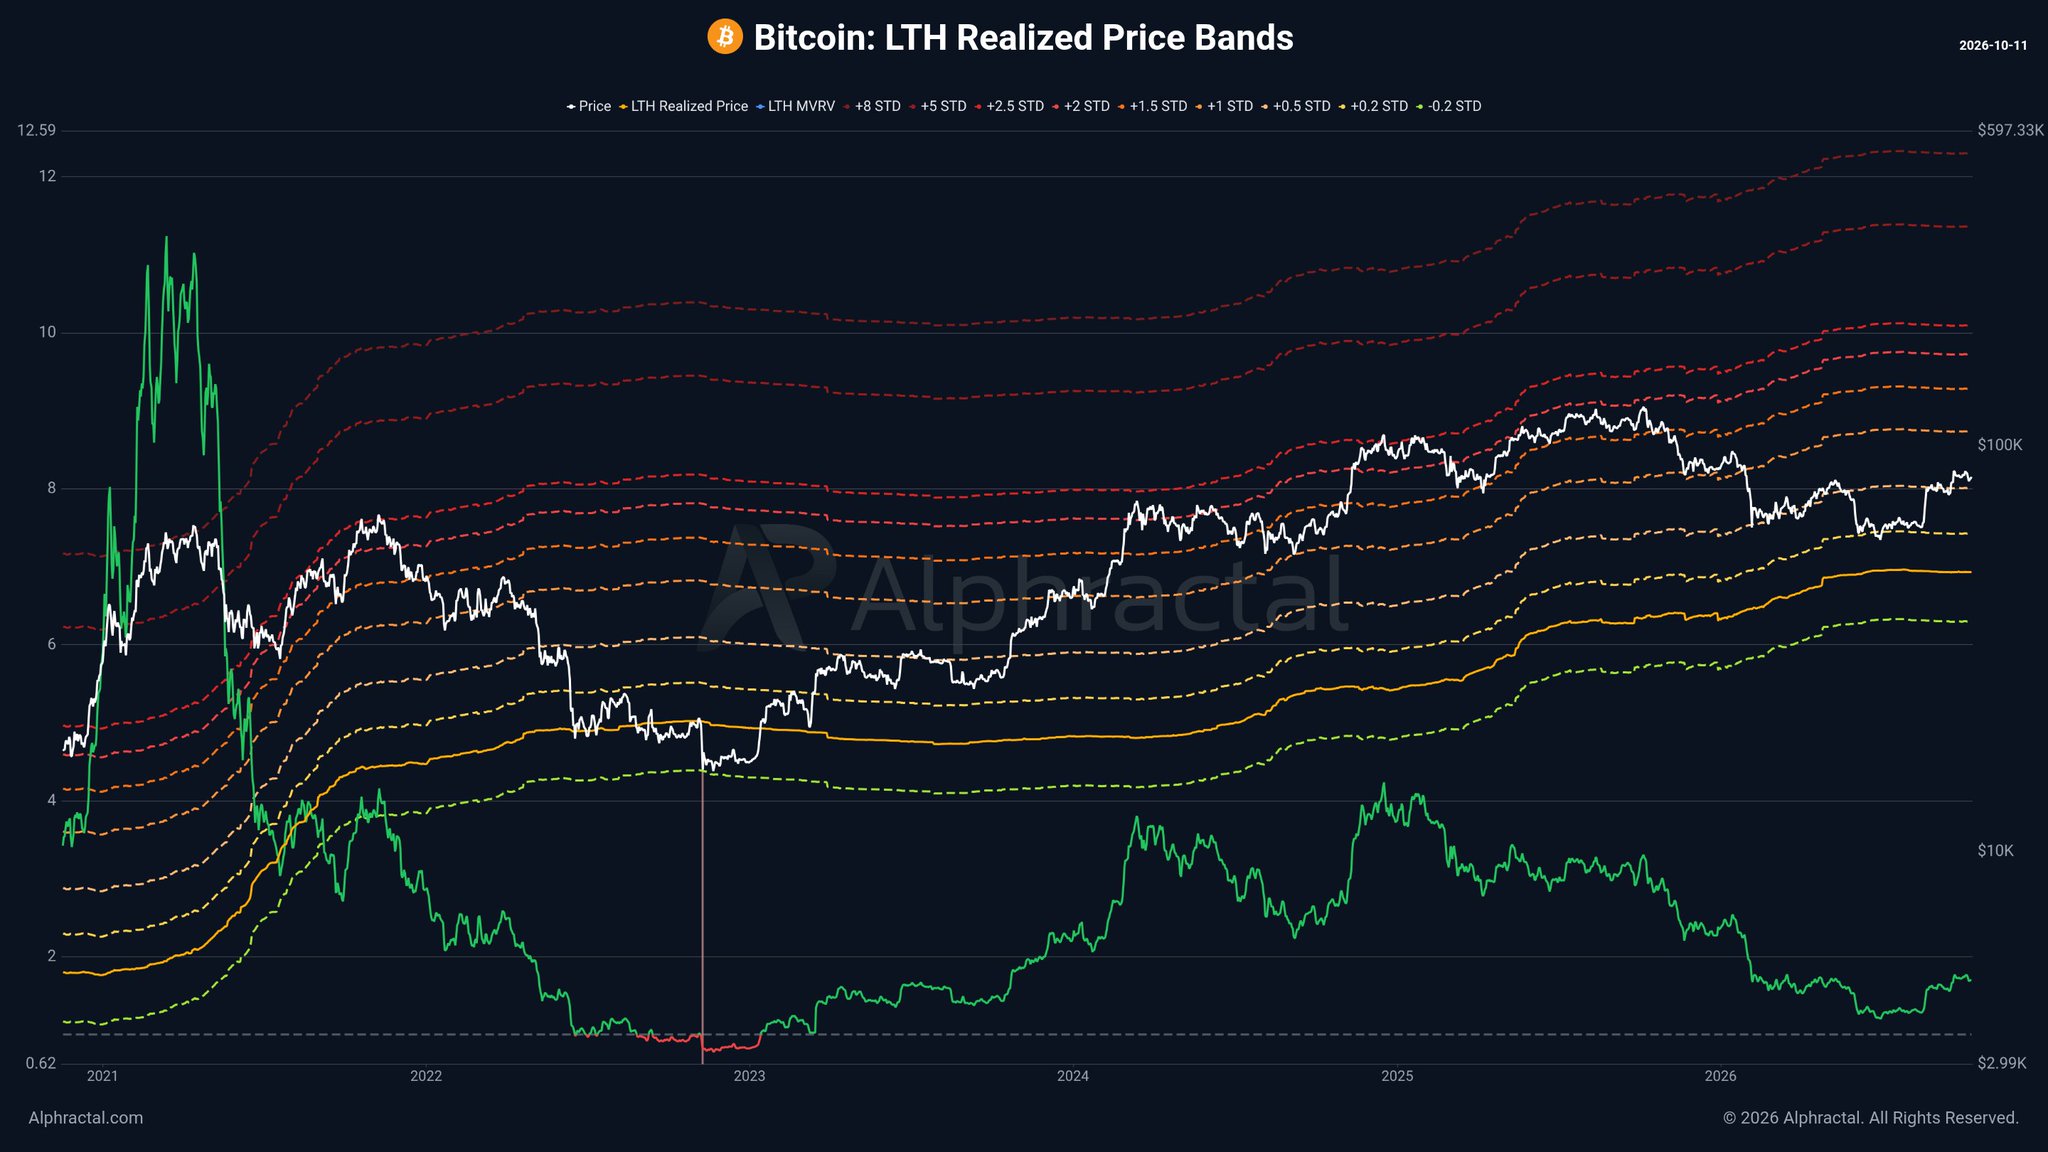
During 2022, the MVRV oscillator dropped sharply toward zero — consistent with LTH MVRV falling below 1.0 and price reaching the −0.2 SD band. During the current cycle’s correction phase, the oscillator declined but found its floor substantially higher: at the +0.5 SD band, a level where the average long-term holder was still sitting on meaningful unrealized gains. The price never came close to the LTH Realized Price itself, let alone the −0.2 SD band below it.
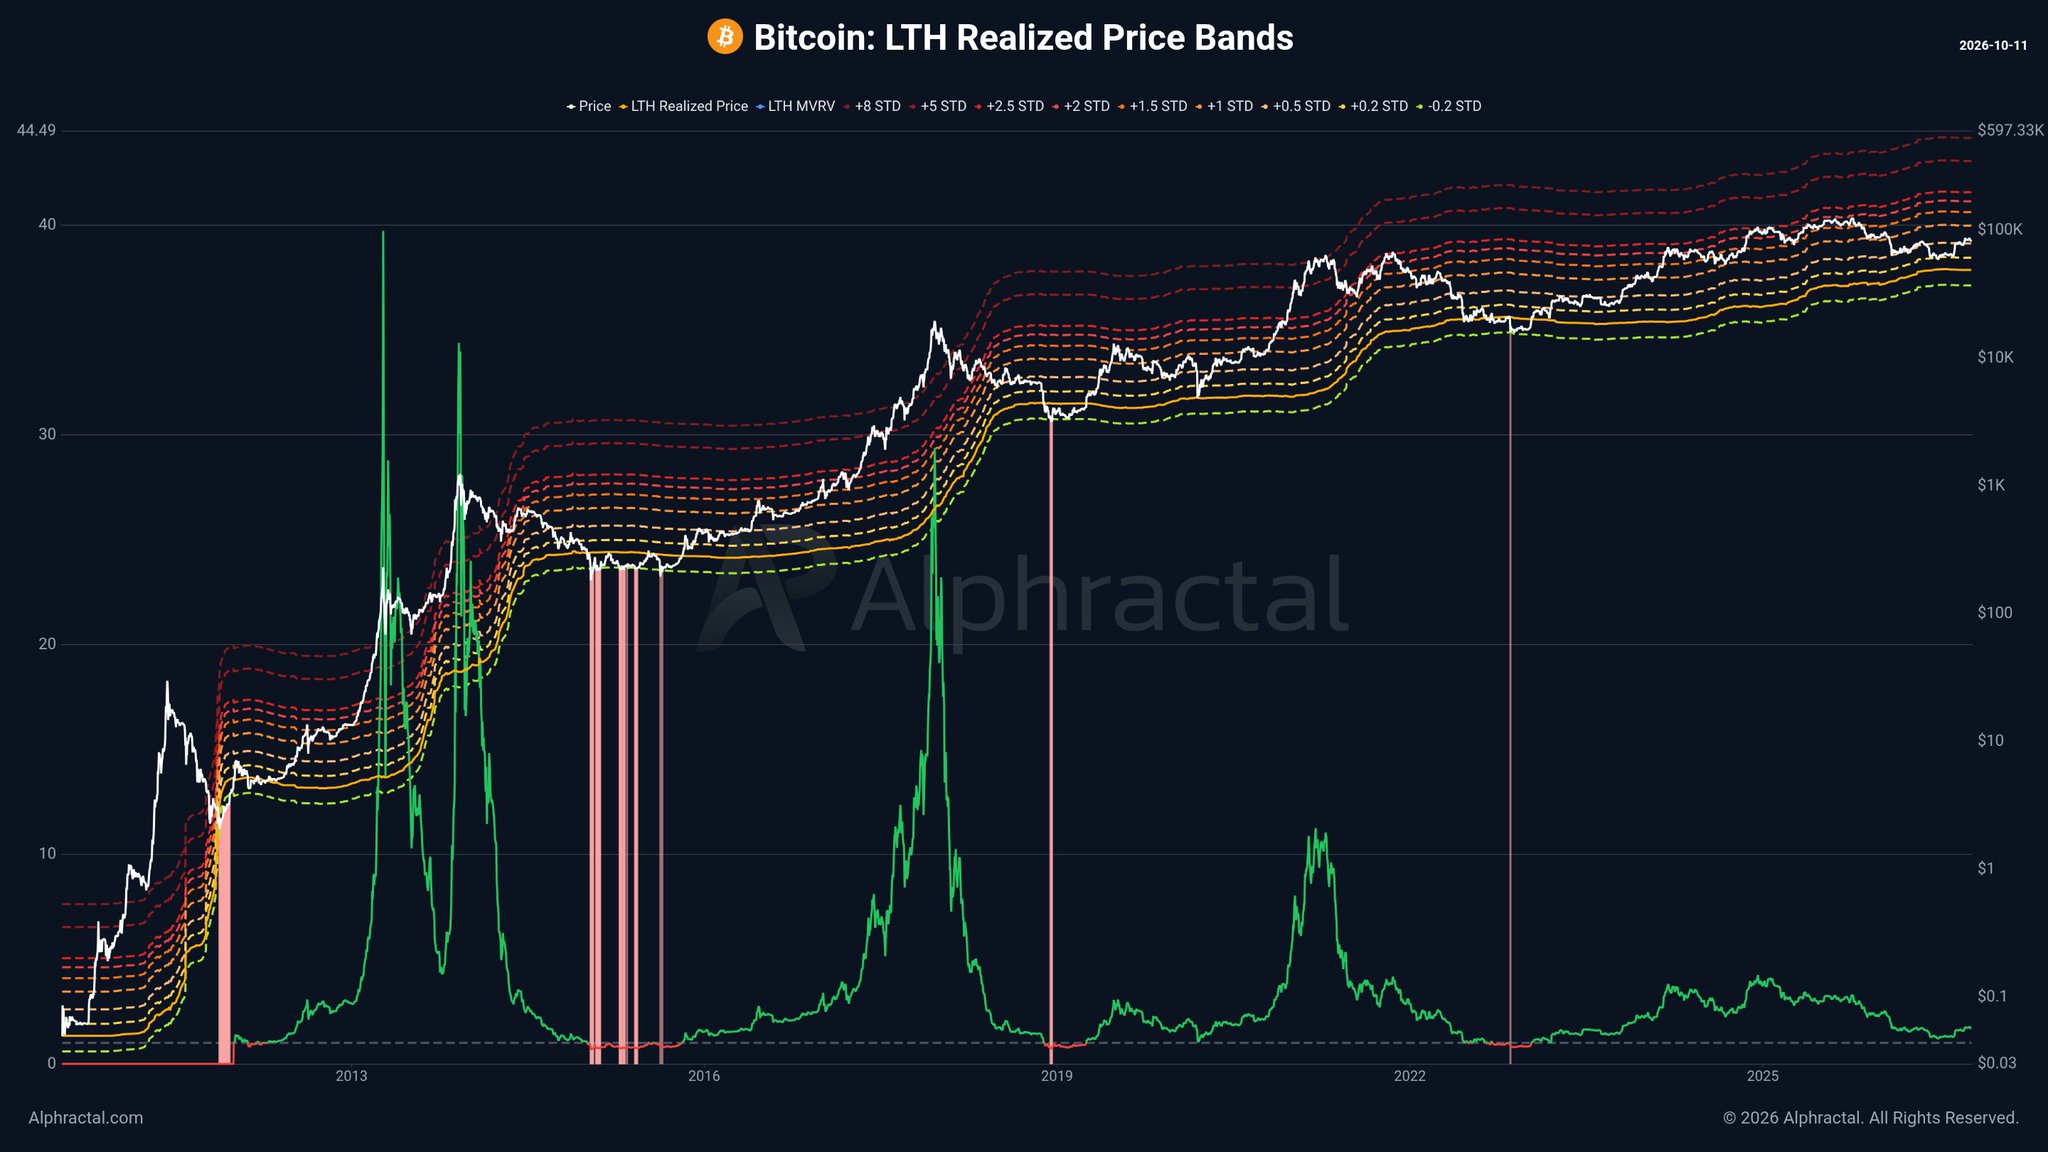
The longer-term chart — spanning Bitcoin’s full history from 2011 to 2026 on a logarithmic scale — reinforces the same reading. Prior cycle corrections in 2015, 2018, and 2022 each drove the MVRV oscillator to or through the zero line. Pink vertical bars mark those historical cycle peaks and the capitulation events that followed. The current cycle, visible at the right edge of the chart, shows a different trajectory: a corrective decline that arrested well above the LTH aggregate loss threshold.
The Question Alphractal Is Asking
Alphractal frames this observation as a direct structural question: is Bitcoin experiencing its first cycle in which long-term holders never collectively enter unrealized losses? And if so, what does that mean for the historical pattern of bear market capitulation that has defined every prior cycle bottom?
This is not a bullish price call. It is a structural observation about regime change — and the honest answer is that both interpretations remain open. The LTH MVRV structural analysis has been covered in depth at CoinsProbe, and the core tension it identifies is real: if long-term holders never capitulate, does Bitcoin lose the on-chain clearing mechanism that prior cycle bottoms depended on, or does it simply mean the asset has matured past that phase?
Two readings are structurally possible. Either the +0.5 SD support holds as the new cycle floor — representing a genuine regime shift in how Bitcoin corrects — or the correction is not finished and a retest of deeper band levels remains ahead. Alphractal does not resolve this question. The post explicitly raises it rather than answering it.
Why This Cycle May Behave Differently — And Why It May Not
The structural case for a genuine divergence rests on several factors that were absent in prior cycles: institutional accumulation through spot ETFs absorbing supply that would previously have hit exchanges, corporate treasury buyers treating deep corrections as purchase opportunities rather than exit triggers, and a long-term holder cohort that includes a larger proportion of entities with multi-decade time horizons. These structural demand anchors could plausibly prevent the kind of forced selling that drove prior cycles to the −0.2 SD band.
The countercase is simpler: every prior cycle generated its own structural narrative for why this time was different, and every prior cycle eventually reached LTH aggregate loss conditions. The +0.5 SD support in 2025–2026 may simply represent the early phase of a correction that has further to travel. As tracked in CoinsProbe’s fractal analysis of Bitcoin’s current position, the structural path from current levels is genuinely bifurcated.
The early bull phase framing from CryptoQuant — covered in detail at CoinsProbe’s CryptoQuant bull phase analysis — aligns directionally with Alphractal’s observation that LTH behavior is structurally different from 2022. But alignment between two signals is not confirmation of either.
The Data Points That Define the Setup
| Metric | 2022 Bear Market | Current Cycle Correction |
|---|---|---|
| LTH MVRV at Correction Low | Below 1.0 (aggregate loss) | Above 1.0 (aggregate profit) |
| SD Band at Support | −0.2 SD below LTH Realized Price | +0.5 SD above LTH Realized Price |
| MVRV Oscillator at Low | Near or below zero | Declined but held above zero |
| LTH Aggregate Loss? | Yes | No (as of October 2026) |
Source: @Alphractal (X) — Alphractal.com on-chain data
Bullish Scenario
If the +0.5 SD band continues to hold as cycle support — confirming a structural regime shift — it would represent the first Bitcoin cycle in which long-term holders never entered aggregate unrealized losses. That would validate Alphractal’s divergence thesis and suggest the traditional capitulation-based cycle floor no longer applies in the same form.
Bearish Scenario
If the current correction resumes and price begins to approach the LTH Realized Price itself — driving the MVRV oscillator toward 1.0 — the divergence thesis weakens materially. A breakdown through the LTH Realized Price toward the −0.2 SD band would represent a reversion to historical cycle behavior and would invalidate the structural break Alphractal identifies.
At $84,094, Bitcoin is navigating a structural inflection point that has no clean historical analogue. The LTH MVRV reading at the most recent correction low — holding at the +0.5 SD band rather than capitulating to the −0.2 SD floor — is either the clearest evidence yet that this cycle is structurally different from 2022, or it is the early chapter of a correction that has further to run. Watch whether Bitcoin sustains price levels that keep the LTH MVRV oscillator above the zero line — that is the on-chain threshold that separates a regime shift from a pattern continuation.
Frequently Asked Questions
What is the LTH Realized Price and why does the −0.2 SD band matter?
Has Bitcoin’s LTH MVRV ever stayed above 1.0 through an entire cycle correction before?
What would invalidate Alphractal’s structural divergence thesis?
Does holding the +0.5 SD band mean Bitcoin’s bear market is over?
Source: Alphractal · Published by CoinsProbe Markets Desk
The opinions and market insights shared on CoinsProbe represent the views of individual authors based on prevailing market conditions at the time of publication. Cryptocurrency investments carry significant risk and volatility. Readers are encouraged to conduct their own research and seek professional financial advice before making investment decisions. CoinsProbe and its contributors do not accept responsibility for financial losses or decisions made based on published content.
CoinsProbe may publish sponsored articles, affiliate links, or promotional collaborations. All sponsored material is clearly labeled to maintain transparency with our audience. Our editorial decisions remain fully independent, and advertising partnerships do not influence reviews, rankings, or published opinions.
Since 2023, CoinsProbe has delivered reliable insights on cryptocurrency, blockchain, and digital assets. Our content is created by experienced researchers and analysts who follow strict editorial standards focused on accuracy, transparency, and credibility. Every article is carefully reviewed and verified using trusted sources and current market data. We provide unbiased analysis and timely updates covering everything from emerging crypto projects to major industry developments.