
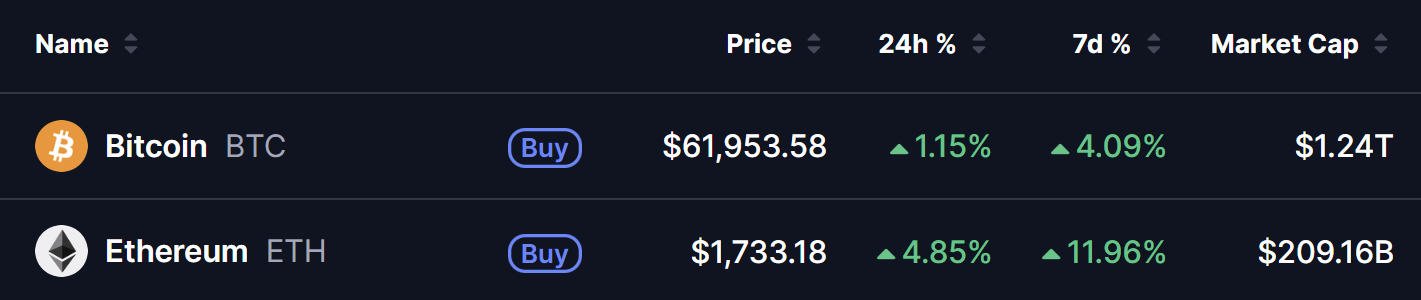
- Bitcoin is trading near $61,954, supported by softer U.S. jobs data.
- Analyst FrankAFetter says short-term holder metrics show early recovery signals.
- Another analyst sees a 2017-style bullish BTC/NVDA fractal, hinting at a potential reversal.
- While not yet confirmed, the combined signals point to an improving near-term outlook for Bitcoin.
Bitcoin is holding its recovery above $61,000 — and today’s data flow is adding meaningful analytical context to why that level may be more significant than the modest +1.15% daily gain suggests on its surface. Soft US employment data is providing the macro tailwind, while two independent on-chain and technical analyses are identifying what may be early-stage structural recovery signals beneath the price action.
BTC Price at a Glance — July 3, 2026
The Macro Tailwind
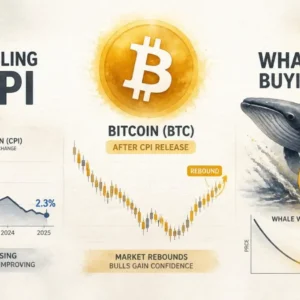
Soft US jobs data released has acted as a risk-on catalyst across financial markets — including Bitcoin. Weaker-than-expected employment figures reduce the likelihood of further Federal Reserve tightening and increase the probability of eventual rate cuts — a macro environment that historically supports risk assets including crypto.
This dynamic fits directly within the framework we covered in our Bitcoin and Fed Chair Warsh article — where monetary policy signals have been one of the most consistent short-term Bitcoin price drivers throughout 2026. Soft jobs data moves the needle toward a more accommodative policy environment, reducing one of the primary macro headwinds that has suppressed Bitcoin during the current correction.
Combined with the first positive Bitcoin ETF daily inflow in 10 days we covered yesterday — today’s macro development adds another layer of support beneath the current price structure.
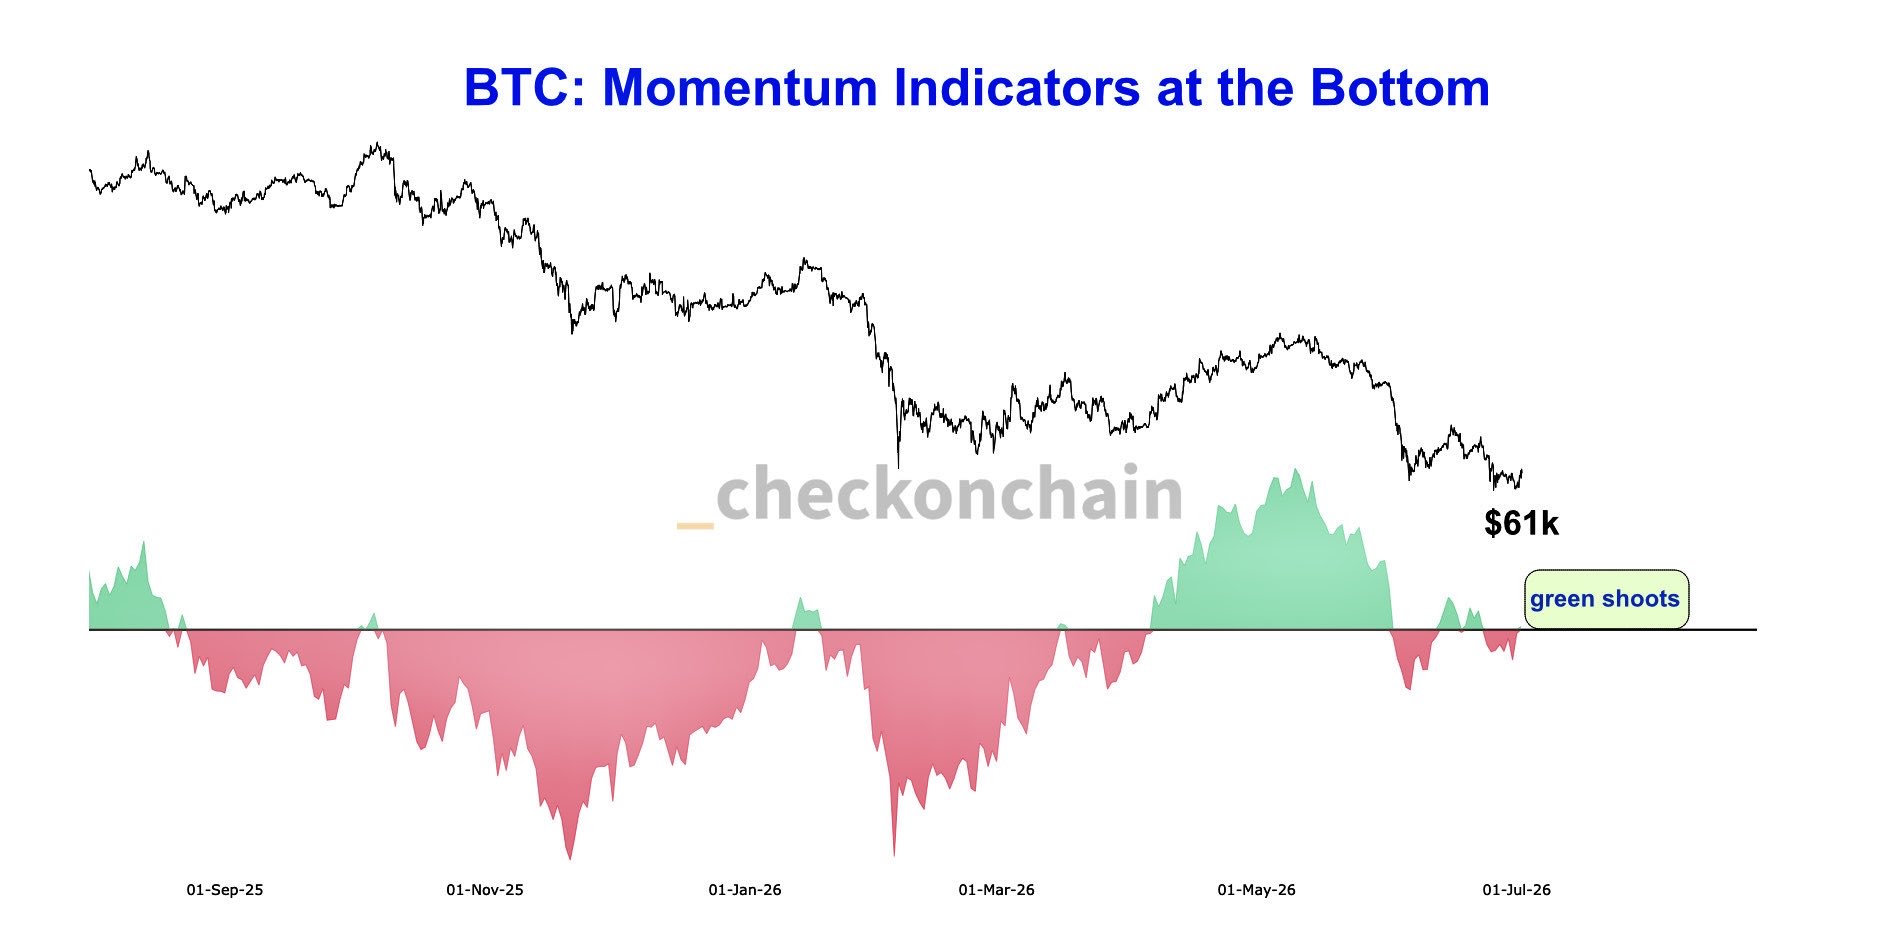
STH Momentum “Green Shoots” at $61K
On-chain analyst @FrankAFetter has identified what he characterises as early but meaningful improvements in Short-Term Holder (STH) momentum indicators — a development that, while not yet a confirmed reversal signal, carries specific predictive relevance for what comes next.
Understanding the STH framework:
Short-Term Holders — typically defined as Bitcoin addresses that have held for less than 155 days — represent the most price-sensitive and sentiment-responsive segment of the market. Their behaviour tends to shift direction faster than Long-Term Holders, making STH momentum indicators particularly useful as early-warning signals for broader market direction changes.
The key insight from @FrankAFetter:
While Bitcoin’s overall demand profile remains relatively weak at this stage of the cycle — consistent with the broader bearish context we have documented throughout 2026 — the STH momentum indicators are showing specific “green shoots” at current $61K levels. This emerging positivity within the STH cohort is being driven by the type of investors that have been on the bid over the past five months — suggesting the accumulation behaviour we covered in our coordinated multi-cohort buying article is beginning to influence shorter-term momentum metrics as well.
Why STH signals can lead traditional indicators:
@FrankAFetter specifically notes that STH momentum shifts often lead traditional Wall Street indicators — meaning they tend to turn positive before the broader market’s conventional metrics register the improvement. This makes them particularly useful as early-stage recovery signals: by the time traditional momentum indicators confirm a recovery, the early-stage entry opportunity within the on-chain data may have already passed.
The practical implication: if STH momentum continues to build from the current green shoots at $61K, it could be signalling that the early stages of recovery are underway before broader market participants have fully recognised the change.
The BTC/NVDA 2017 Fractal
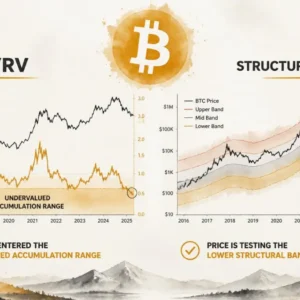
Technical analyst @Crypto_Moe84 has highlighted a ratio analysis that adds a compelling second dimension to the current setup: the BTC/NVDA ratio chart — measuring Bitcoin’s price performance relative to NVIDIA’s stock — is showing a pattern comparable to a setup that preceded one of Bitcoin’s most powerful historical expansion rallies.
Understanding the BTC/NVDA ratio:
The ratio between Bitcoin and a leading AI/tech stock like NVIDIA captures the relative performance of speculative digital assets versus speculative technology equities. When this ratio rises, Bitcoin is outperforming NVIDIA — and when it falls, NVIDIA is capturing a larger share of risk-on capital flows relative to Bitcoin.
The 2017 parallel:
In 2017, the BTC/NVDA ratio formed what @Crypto_Moe84 identifies as a classic Power of 3 (PO3) structure — comprising three phases:
Accumulation — A period of quiet, range-bound price action where smart money builds positions.
Manipulation — A sharp, scary move designed to shake out weak hands and stop-hunt overleveraged positions before the real move begins.
Expansion — The powerful directional move that follows the manipulation phase — in 2017’s case, a significant outperformance of Bitcoin relative to NVIDIA as capital rotated from tech into crypto.
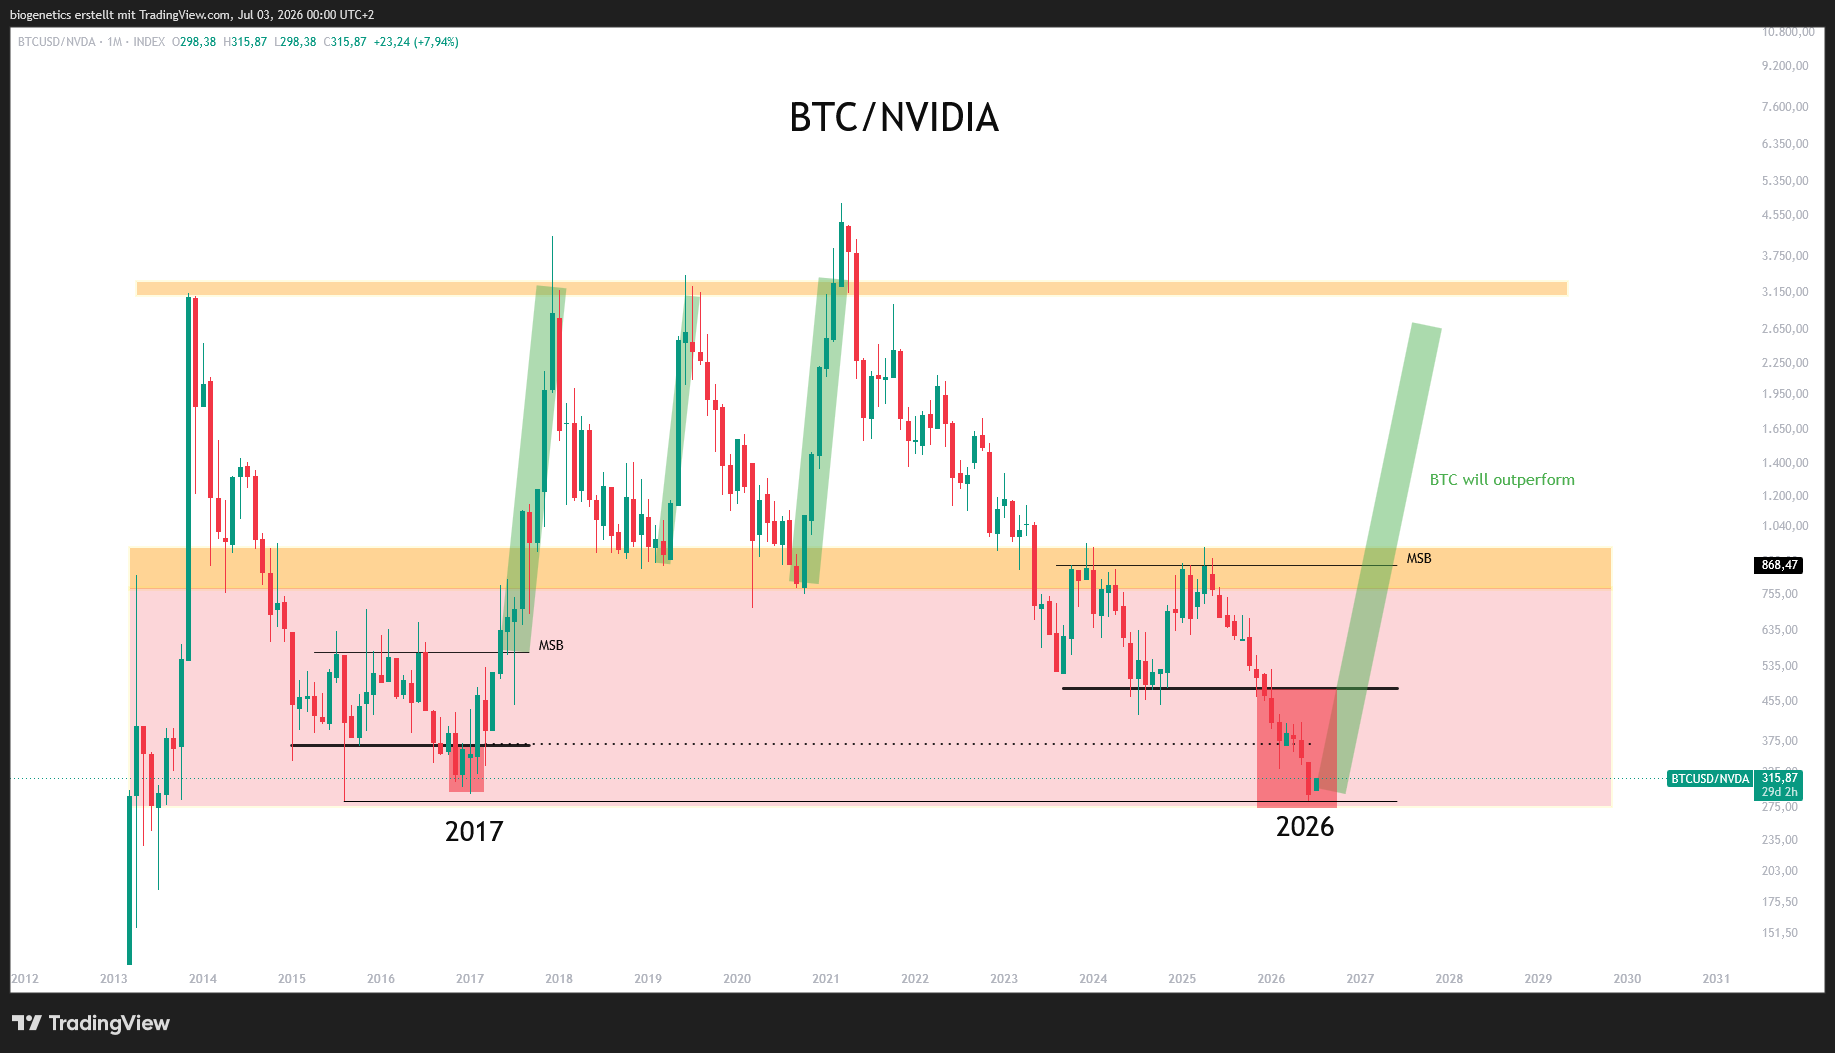
The current reading:
The BTC/NVDA chart today appears to be in the early stages of reversal from the manipulation phase — the point in the PO3 structure that, in 2017, immediately preceded the expansion rally. This suggests that Bitcoin may be approaching a point where it begins to meaningfully outperform NVIDIA — a rotation narrative that has gained traction as NVIDIA has shown relative weakness while Bitcoin has held key support levels through the current correction.
Why this matters for the broader market: A confirmed rotation from NVIDIA into Bitcoin would be a significant capital flow event — given NVIDIA’s scale and the amount of investment it has attracted during the AI infrastructure buildout cycle we documented in our Saylor AI capital absorption article. Even a partial rotation of that capital back into Bitcoin would represent a meaningful demand catalyst.
How These Signals Fit the Broader Picture
Today’s two signals — STH momentum green shoots and the BTC/NVDA 2017 fractal — sit within a broader context of accumulating evidence we have been tracking throughout June and early July 2026:
- 45% of LTH supply in unrealised loss — with Long-Term Holders still actively accumulating
- Bitcoin ETF inflows returning after 10 days of outflows — $221M inflow signalling institutional sentiment shift
- All wallet size cohorts simultaneously in accumulation — retail, mid-sized whales, and large entities all buying
- Now: Soft jobs data providing macro tailwind + STH momentum showing green shoots + BTC/NVDA fractal suggesting early rotation setup
Each signal measures a different dimension of the same underlying dynamic: the selling pressure that defined the correction phase appears to be gradually exhausting itself across multiple analytical frameworks simultaneously.
What’s Still Missing — Confirmation
Both analysts are careful to characterise their findings as early-stage signals rather than confirmed reversals — and that framing matters.
@FrankAFetter describes “green shoots” — a term that implies early, fragile positive development rather than established strength. @Crypto_Moe84 identifies Bitcoin as being in the early stages of reversal from the manipulation phase — which means the expansion move has not yet begun, only that the preconditions for it appear to be forming.
What would elevate these signals from early-stage indicators to confirmed recovery:
STH momentum fully flipping positive across multiple consecutive days — rather than the current early green shoots reading.
BTC/NVDA ratio breaking above key levels with conviction — confirming the ratio reversal is genuine rather than a temporary fluctuation.
Bitcoin reclaiming the $65,000–$68,000 resistance zone on a sustained basis — the first meaningful technical confirmation that the broader recovery is underway.
Bottom Line
Bitcoin at $61,953 is accumulating early-stage recovery signals from multiple directions today. Soft US jobs data removes a near-term macro headwind. @FrankAFetter’s STH momentum analysis identifies “green shoots” at current levels that historically lead broader market indicators. And @Crypto_Moe84’s BTC/NVDA fractal points to a potential rotation setup comparable to the 2017 expansion cycle’s early setup.
None of these are confirmed reversals — they are early-stage indicators that the selling pressure exhaustion process may be progressing. But combined with the ETF inflow return, the multi-cohort accumulation signal, and the LTH behaviour data already documented, the structural backdrop around Bitcoin’s current price is more constructive than at any point in the past several weeks.
Watch STH momentum for continuation, watch the BTC/NVDA ratio for confirmation of the fractal, and watch the $65,000–$68,000 zone for the technical confirmation that converts these early signals into a confirmed recovery structure.
Frequently Asked Questions
What are STH momentum?
@FrankAFetter identifies early positive shifts in Short-Term Holder momentum indicators at current $61K levels — fragile but meaningful early-stage signals that historically lead traditional Wall Street indicators before broader markets recognise the recovery.
What is the BTC/NVDA 2017 fractal?
@Crypto_Moe84’s analysis of the Bitcoin-to-NVIDIA price ratio shows a Power of 3 structure comparable to 2017 — suggesting Bitcoin may be in the early reversal from a manipulation phase, setting up a potential expansion move where BTC significantly outperforms NVIDIA.
The opinions and market insights shared on CoinsProbe represent the views of individual authors based on prevailing market conditions at the time of publication. Cryptocurrency investments carry significant risk and volatility. Readers are encouraged to conduct their own research and seek professional financial advice before making investment decisions. CoinsProbe and its contributors do not accept responsibility for financial losses or decisions made based on published content.
CoinsProbe may publish sponsored articles, affiliate links, or promotional collaborations. All sponsored material is clearly labeled to maintain transparency with our audience. Our editorial decisions remain fully independent, and advertising partnerships do not influence reviews, rankings, or published opinions.
Since 2023, CoinsProbe has delivered reliable insights on cryptocurrency, blockchain, and digital assets. Our content is created by experienced researchers and analysts who follow strict editorial standards focused on accuracy, transparency, and credibility. Every article is carefully reviewed and verified using trusted sources and current market data. We provide unbiased analysis and timely updates covering everything from emerging crypto projects to major industry developments.