
- Bitcoin trades at $75,491 (-1.74% 24h) as Senate rejection of the Clarity Act triggers immediate STH panic selling
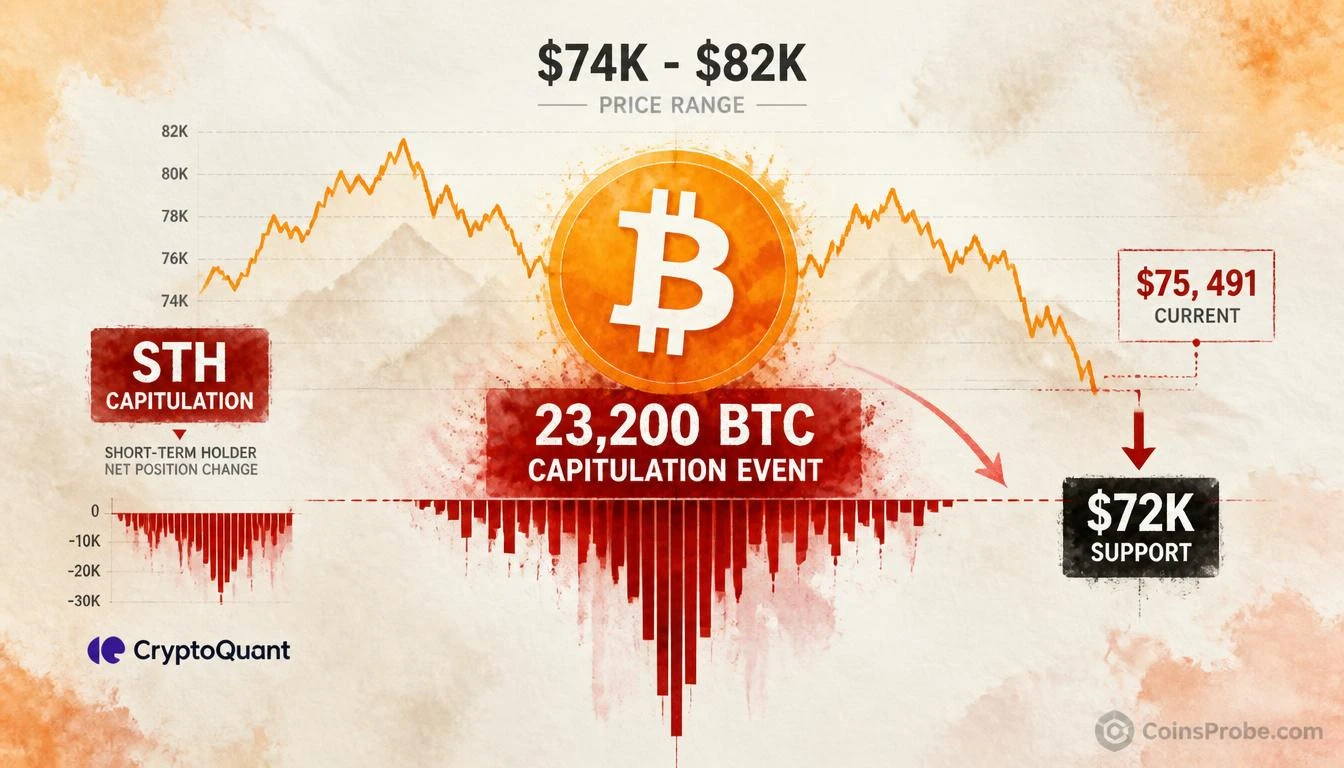
- 23,200 BTC sent to exchanges at a loss on September 15 — the largest STH capitulation event of the past 30 days, per @Darkfost_Coc (CryptoQuant)
- Bitcoin peaked near $82,000 on September 3–5 before declining — the capitulation spike hit as price approached $74,000–$75,000 support
- Watch $72,000 as critical invalidation level — a daily close below opens downside toward $65,000–$67,000
Bitcoin is trading at $75,491 — down 1.74% in the past 24 hours — with a market cap of $1.516 trillion and $39 billion in daily volume. The headline is not the price. It is what happened beneath it: on September 15, short-term holders (STHs) sent 23,200 BTC to exchanges at a realized loss — the single largest STH capitulation event recorded over the preceding 30 days.
The event was identified and quantified by CryptoQuant analyst Darkfost (@Darkfost_Coc), who published the finding via the official CryptoQuant channel. His exact words: “With 23,200 BTC sent to exchanges at a loss, this STH capitulation event is the largest recorded over the past month.” The catalyst was external and named: the U.S. Senate’s rejection of the Clarity Act — the primary federal crypto market structure legislation — which triggered an immediate and measurable wave of panic selling from recent Bitcoin buyers.
What Is an STH Capitulation Event — and Why This One Matters
Short-term holder capitulation is a specific on-chain condition, not a price observation. It occurs when Bitcoin wallets that have held coins for fewer than 155 days — classified by CryptoQuant and Glassnode as short-term holders — send BTC to exchanges at prices below their cost basis, realizing a loss. This is not speculative sentiment. It is an irreversible, on-chain economic action: a holder absorbing a realized loss to exit.
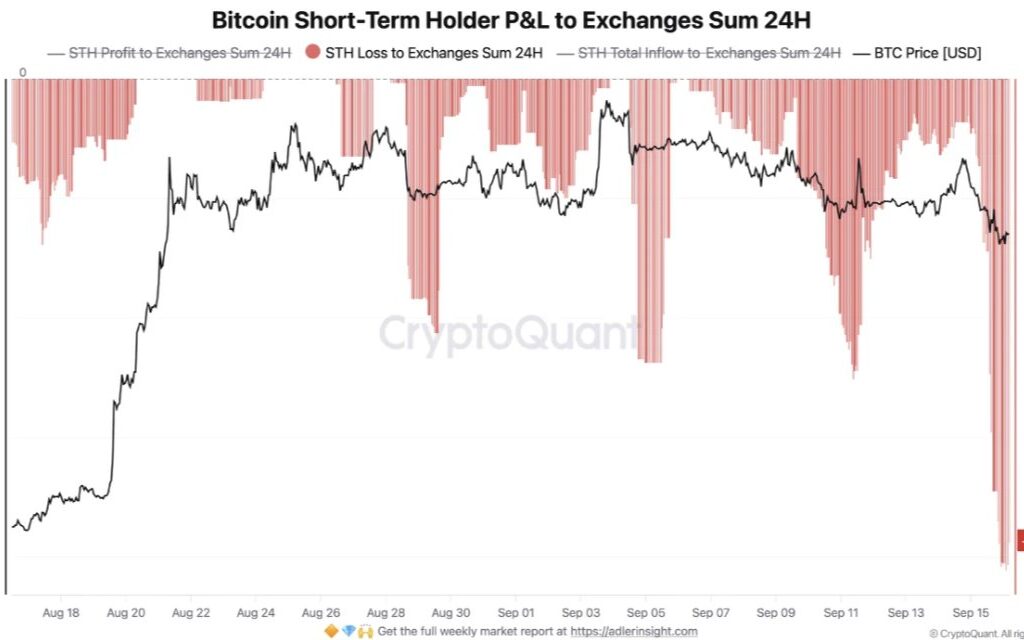
The STH Profit and Loss metric tracked by CryptoQuant disaggregates these flows by direction (profit or loss) and magnitude (volume of BTC). A red bar on this chart represents BTC sold at a loss to exchanges. The September 15 bar registers 23,200 BTC — dwarfing every prior loss-event bar across the preceding four-week window, which the chart shows ranged from isolated red spikes to moderate selling clusters, none approaching this scale.
The directional trigger is unambiguous. The U.S. Senate’s rejection of the Clarity Act — legislation designed to establish a clear jurisdictional framework separating SEC and CFTC oversight of crypto assets — removed the single most anticipated piece of regulatory certainty from the near-term calendar. For short-term holders who had positioned around a favorable legislative outcome, the rejection transformed a speculative long into an underwater position requiring an exit decision. 23,200 of them made that decision on the same day.
The Chart — STH P&L from August 18 to September 15
The CryptoQuant chart shared by @Darkfost_Coc covers a ~4-week daily window from August 18 to September 15. Bitcoin’s price range across this period spans approximately $62,000 to $82,000, with a peak near $82,000 on September 3–5 and a recent low of approximately $74,000–$75,000 on September 15.
Key observations from the chart:
- Red bars (loss realizations) dominate the entire four-week period — indicating that STH selling at a loss was not a single-day event but a persistent condition.
- The September 15 bar is visually discontinuous with the preceding data — its magnitude dramatically exceeds every prior spike in the window.
- Price was already declining from the $82,000 peak when the capitulation spike registered — meaning this was not a price-induced panic from new lows, but a regulatory catalyst applied to an already weakening market.
STH Profit & Loss — September 15, 2026 | Source: @Darkfost_Coc via CryptoQuant
Capitulation Paradox — Historically, Peak Panic Precedes Potential Bottoms
This is the structural tension at the center of the current setup. A 23,200 BTC loss-send to exchanges is bearish in isolation — it represents distribution pressure arriving at the exchange order book. But capitulation events at historic magnitude within a defined window carry a documented paradox: they tend to cluster near exhaustion points, not continuation points.
The mechanism: short-term holders are, by definition, the weakest hands in any holder cohort. Once they have sold — at a loss, to exchanges — they are no longer participants in the downside. Their BTC has been transferred to market makers, arbitrageurs, or longer-duration buyers willing to absorb at current prices. If that absorption occurs at the exchange level without pushing price materially lower, it signals that demand at current levels is sufficient to clear the supply. That absorption test is what the market is running right now in the $72,000–$75,000 support zone identified in the chart analysis.
This is not a bullish call. It is a structural observation: historically, the largest capitulation event within a defined window has often marked the local bottom of that selling cycle, not the beginning of a new one. Whether this instance confirms that pattern depends entirely on whether exchange inflows normalize in the sessions ahead — and whether regulatory uncertainty generates a second wave of forced selling.
The Regulatory Catalyst — Why the Clarity Act Rejection Is Structurally Significant
The Clarity Act was not a speculative narrative. It was formal legislation moving through the Senate with bipartisan support, designed to resolve the foundational legal ambiguity around whether crypto assets are securities or commodities. Its rejection does not create new legal exposure — it maintains existing ambiguity. But for short-term holders who had priced in a near-term regulatory resolution, the rejection is a timeline extension of uncertainty, and that recalibration triggered immediate selling.
The regulatory dimension also carries a forward-looking risk factor: if further negative legislative or enforcement news emerges in the near term, STH panic could generate a second capitulation wave before the first has been absorbed. That risk remains elevated until either legislative momentum resumes or the $72,000–$74,000 support zone demonstrates structural demand capable of clearing exchange inflows without further price deterioration.
For broader context on how regulatory developments continue to shape crypto market structure, see our coverage of Solana Spot ETFs logging nine consecutive weeks of net inflows — a parallel data point showing institutional demand persisting through legislative headwinds.
Bull and Bear Scenarios
Bullish Scenario — Absorption at $72,000–$75,000
If the 23,200 BTC in exchange inflows is absorbed at current levels without a sustained break below $72,000, it would confirm that the capitulation event was an exhaustion spike rather than the start of a new selling leg. A stabilization and reclaim of $78,000 would signal that the weak-hand exit is complete and that demand has returned to the order book. Historical STH capitulation exhaustion events have preceded recoveries of 15%–40% in subsequent sessions when absorption was confirmed.
Bearish Scenario — Loss of $72,000 Support
If exchange selling pressure continues and Bitcoin closes a daily candle below $72,000 — the lower bound of the chart’s identified support zone — it would negate the exhaustion narrative. A sustained break below $72,000 opens the range toward $65,000–$67,000, where the next significant on-chain cost basis cluster for STH cohorts resides. A second negative regulatory catalyst before exchange inflows normalize would be the primary trigger for this scenario.
Key Metric to Watch
CryptoQuant’s STH Profit and Loss daily chart is the definitive metric for this setup. If red bar magnitude normalizes — dropping back to pre-September 15 levels — it confirms the capitulation spike was an isolated event. If red bars remain elevated at comparable scale in subsequent sessions, the selling has not exhausted. CryptoQuant’s platform updates this data in near-real time and is the primary instrument for monitoring resolution of this setup.
Separately, monitoring the relationship between exchange supply and price action across assets provides supplemental context on whether broader exchange inflow trends are accelerating or decelerating.
Frequently Asked Questions
What is STH capitulation and why does the 23,200 BTC figure matter?
Why did the Senate rejecting the Clarity Act cause Bitcoin to drop?
Does a record STH capitulation event signal a Bitcoin bottom?
What price level must Bitcoin hold to prevent further downside?
Where does @Darkfost_Coc publish Bitcoin on-chain analysis?
Source: CryptoQuant · Published by CoinsProbe Markets Desk
The opinions and market insights shared on CoinsProbe represent the views of individual authors based on prevailing market conditions at the time of publication. Cryptocurrency investments carry significant risk and volatility. Readers are encouraged to conduct their own research and seek professional financial advice before making investment decisions. CoinsProbe and its contributors do not accept responsibility for financial losses or decisions made based on published content.
CoinsProbe may publish sponsored articles, affiliate links, or promotional collaborations. All sponsored material is clearly labeled to maintain transparency with our audience. Our editorial decisions remain fully independent, and advertising partnerships do not influence reviews, rankings, or published opinions.
Since 2023, CoinsProbe has delivered reliable insights on cryptocurrency, blockchain, and digital assets. Our content is created by experienced researchers and analysts who follow strict editorial standards focused on accuracy, transparency, and credibility. Every article is carefully reviewed and verified using trusted sources and current market data. We provide unbiased analysis and timely updates covering everything from emerging crypto projects to major industry developments.